Select a Region
Welcome to wxmaps.net – Synoptic Weather Visualization Hub
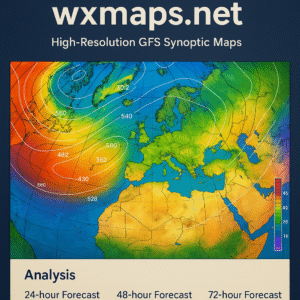
At wxmaps, we provide high-resolution, up-to-date synoptic weather maps generated from the . Designed for meteorologists, researchers, students, and weather enthusiasts, this platform offers clear and detailed insight into the structure and evolution of the atmosphere over Europe and surrounding regions.
Our website presents a comprehensive suite of weather fields through four forecast intervals:
- 00 hour – Analysis maps
- 24-hour Forecast – Day 1
- 48-hour Forecast – Day 2
- 72-hour Forecast – Day 3
These forecast windows allow users to monitor atmospheric developments in both the short and medium range, supporting situational awareness and early warning efforts for potential severe weather.
What We Offer
Our charts cover a broad range of pressure levels and meteorological variables critical for synoptic-scale analysis:
- 500 hPa Geopotential Height and Vorticity:
Provides insight into troughs, ridges, and mid-level cyclonic activity, helping identify potential areas of dynamic weather. - Sea Level Pressure and 1000–500 hPa Thickness:
Key to analyzing surface pressure systems, identifying warm and cold air masses, and tracking fronts. - 850 hPa Temperature, Relative Humidity, and Wind:
Offers information about lower tropospheric thermodynamics, moisture content, and wind flow patterns. - 200 hPa Streamlines and Jet Stream Isotachs:
Visualizes upper-level wind patterns, jet streaks, and potential areas of divergence or convergence aloft. - Precipitable Water and CAPE (Convective Available Potential Energy):
Highlights atmospheric moisture availability and instability for thunderstorm forecasting. - Relative Humidity at 800, 500, and 300 hPa or Cloud Cover (Low/Mid/High):
Helps assess vertical moisture distribution and cloud layering for sky condition evaluation.
Each chart is regularly updated with the latest GFS model output. The site is lightweight, fast, and accessible from any device, making it ideal for both quick checks and in-depth analyses.
Learn More About the Atmosphere and Satellite Data
At wxmaps.net, we go beyond maps. Our mission is also to make atmospheric science understandable for everyone. Whether you’re a student, teacher, or simply curious about the weather, our articles and guides help you explore how the atmosphere functions — in a clear and engaging way.
We explain topics such as:
- What causes different weather patterns
- How clouds, winds, and storms form
- What satellite images actually show
- How weather forecasts are created using space-based data
We especially focus on the importance of space technology and satellite observations in today’s weather analysis. Satellite data allows us to monitor temperature, humidity, and cloud movements across the entire planet — giving us a unique, global perspective of Earth’s atmosphere. Through real examples from our maps, we show how this technology improves our understanding of weather and climate systems.
Whether you’re analyzing synoptic patterns, exploring satellite imagery, preparing educational materials, or just want to better understand the sky above — wxmaps.net is your trusted, scientifically accurate, and visually intuitive weather resource.Each chart is updated regularly to reflect the latest model output, ensuring that the information remains timely and relevant. The site layout is intentionally simple and fast-loading, making it accessible for quick weather briefings or deeper synoptic assessments.
Whether you’re analyzing synoptic patterns, preparing educational materials, or simply keeping an eye on the atmospheric setup across Europe, wxmaps.net is your go-to platform for scientifically accurate and visually intuitive weather maps.