Successful weather forecasting relies on understanding the dynamics of the upper atmosphere. This page presents the complete series of Euro 500 hPa Geopotential Height and Relative Vorticity charts, ranging from the current analysis (00) to the 3-day forecast (72). Whether you are tracking a developing storm or looking for a window of clear weather, these maps provide the essential data.
Understanding Geopotential Height Meteorology
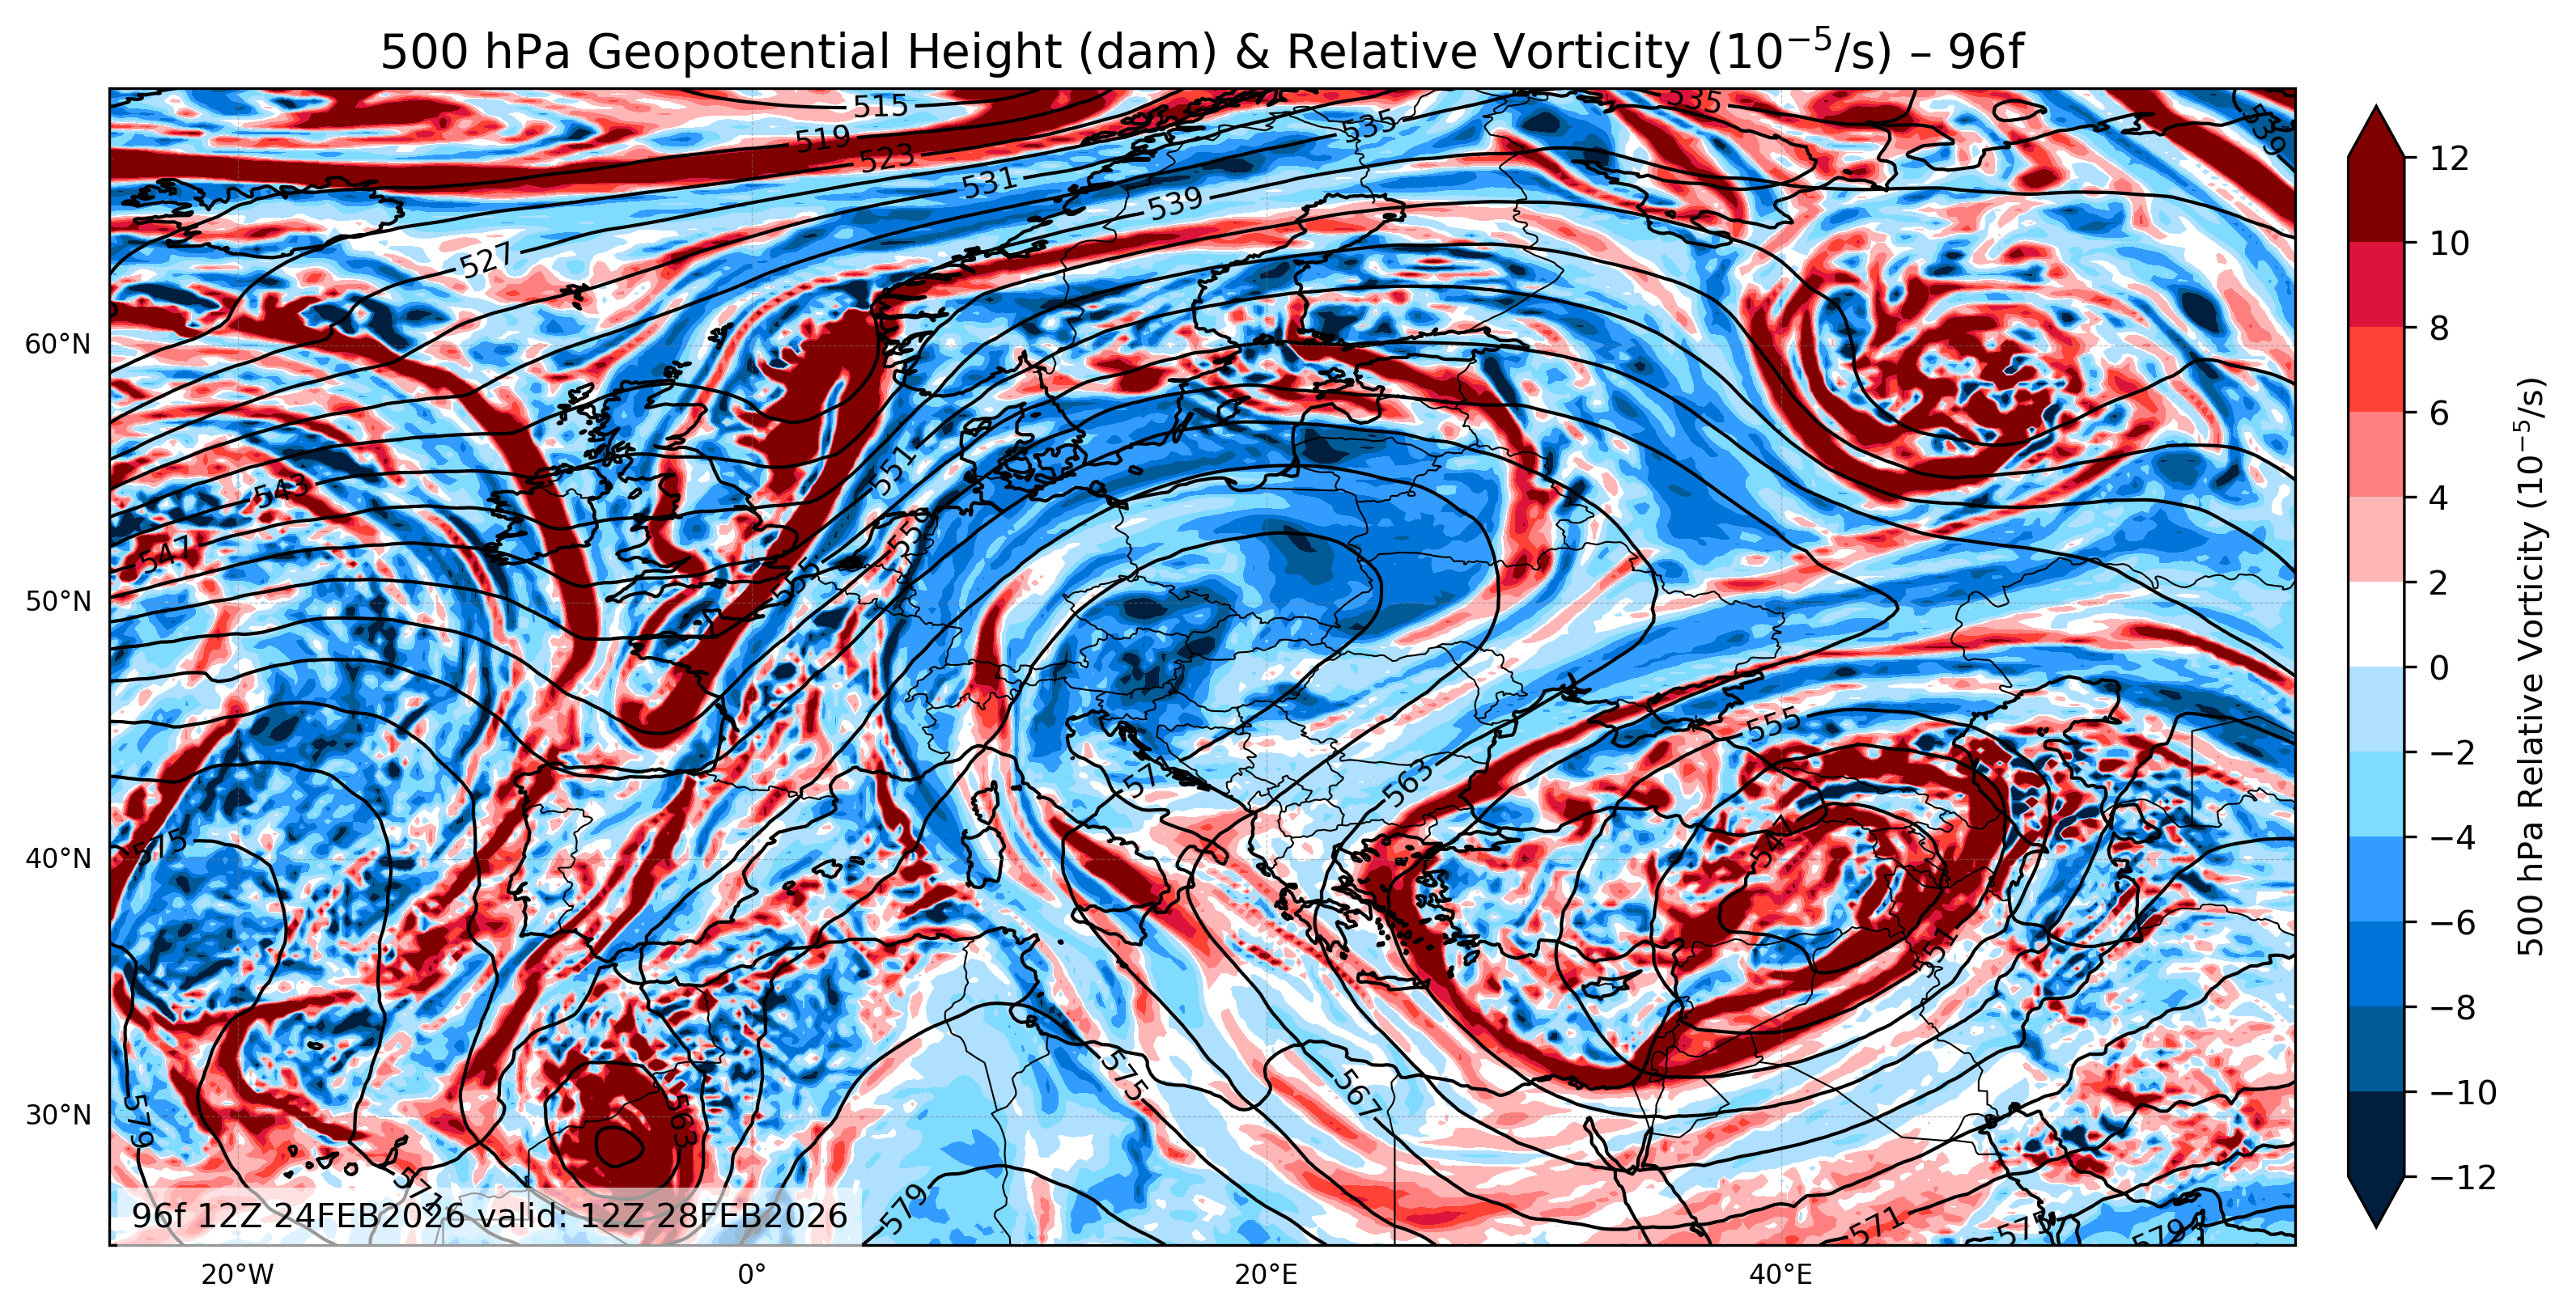
To interpret these charts effectively, you must understand two core concepts: geopotential height and vorticity.
First, let’s look at the 500 hpa geopotential height map. In geopotential height meteorology, we do not measure pressure at a fixed altitude. Instead, we measure the actual height of the 500 hPa pressure surface, which sits roughly 5,500 meters above sea level.
- Black Contours: These lines on the map act like topographic lines.
- Troughs and Ridges: Similar to standard GFS geopotential height models, dips in the lines (troughs) indicate cold, unstable air, while peaks (ridges) indicate warm, stable air.
What is Relative Vorticity?
The second layer of data on the Euro 500 hPa Geopotential Height and Relative Vorticity map is the color shading. This represents vorticity. But what is relative vorticity? Simply defined, it is the measurement of the local rotation or “spin” of the air.
1. Red Areas (Positive Relative Vorticity)
The red and brown zones indicate positive relative vorticity.
- The Physics: This represents cyclonic (counter-clockwise) rotation.
- Weather Impact: Positive vorticity induces upward vertical motion. Therefore, these red areas are the “engines” of storms, bringing clouds and precipitation.
2. Blue Areas (Negative Relative Vorticity)
The blue zones indicate negative relative vorticity.
- The Physics: This represents anticyclonic (clockwise) rotation.
- Weather Impact: Negative vorticity causes air to sink (subsidence). Consequently, these blue areas are associated with clear skies and high-pressure stability.
Available Charts: Analysis and Forecast
Our platform offers four distinct timeframes for the Euro 500 hPa Geopotential Height and Relative Vorticity model:
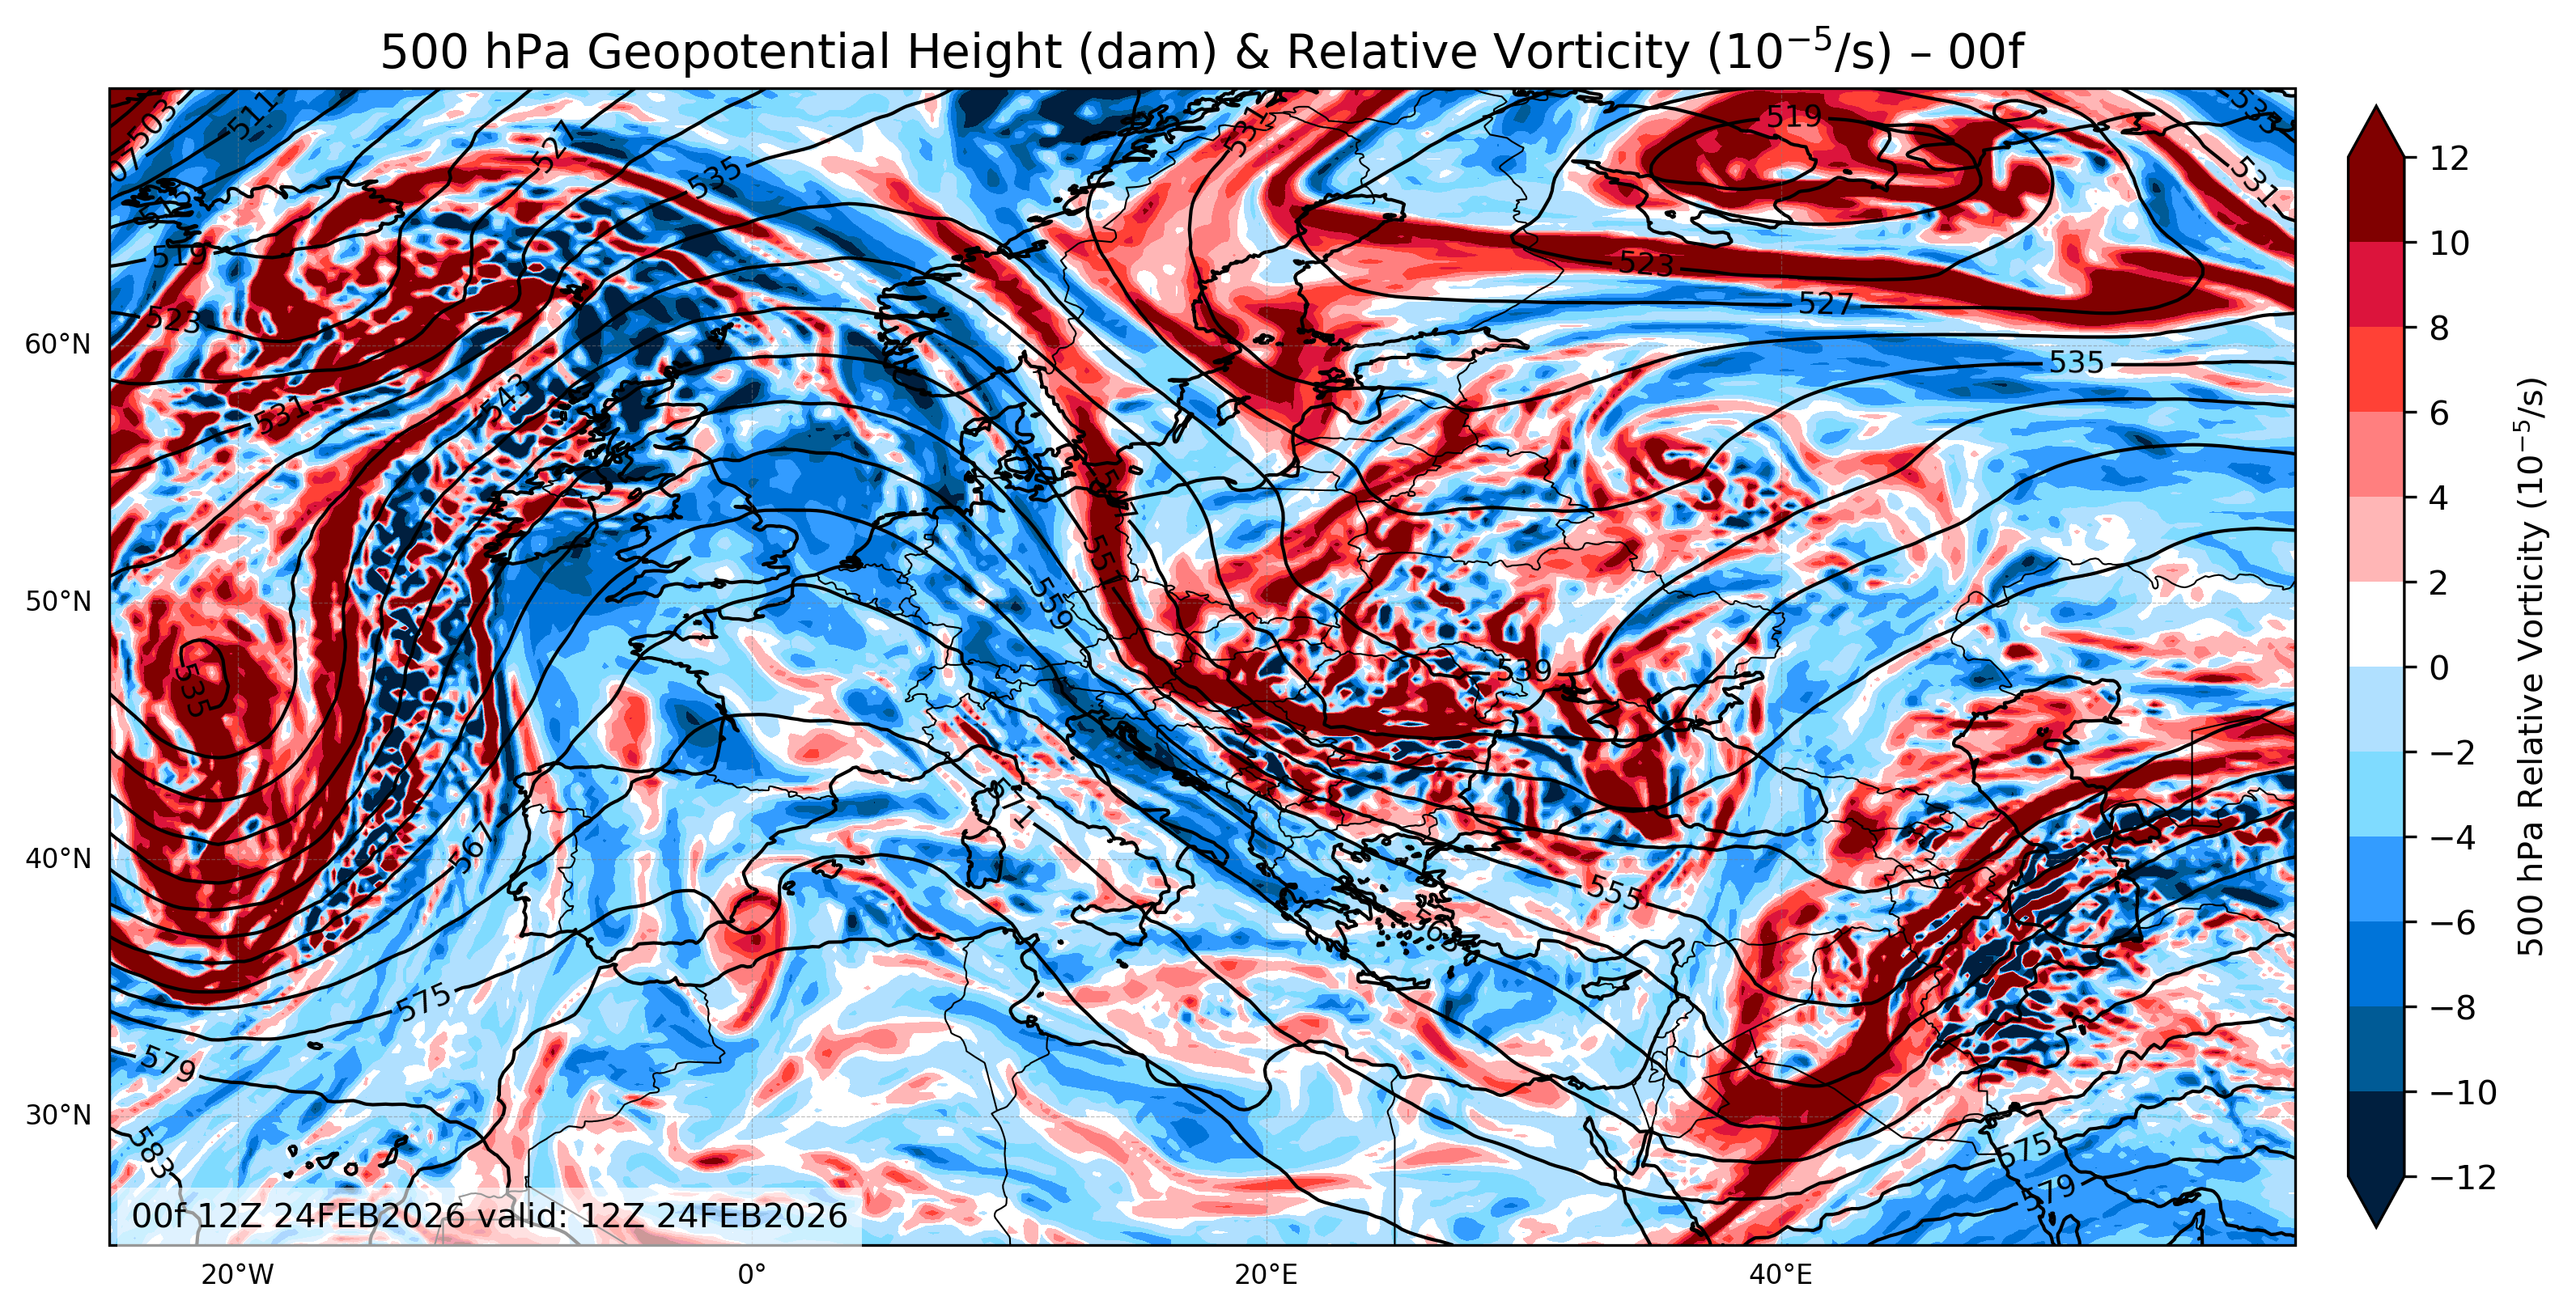
- 00 Analysis: This map shows the current state of the atmosphere. Use it to see what is happening right now.
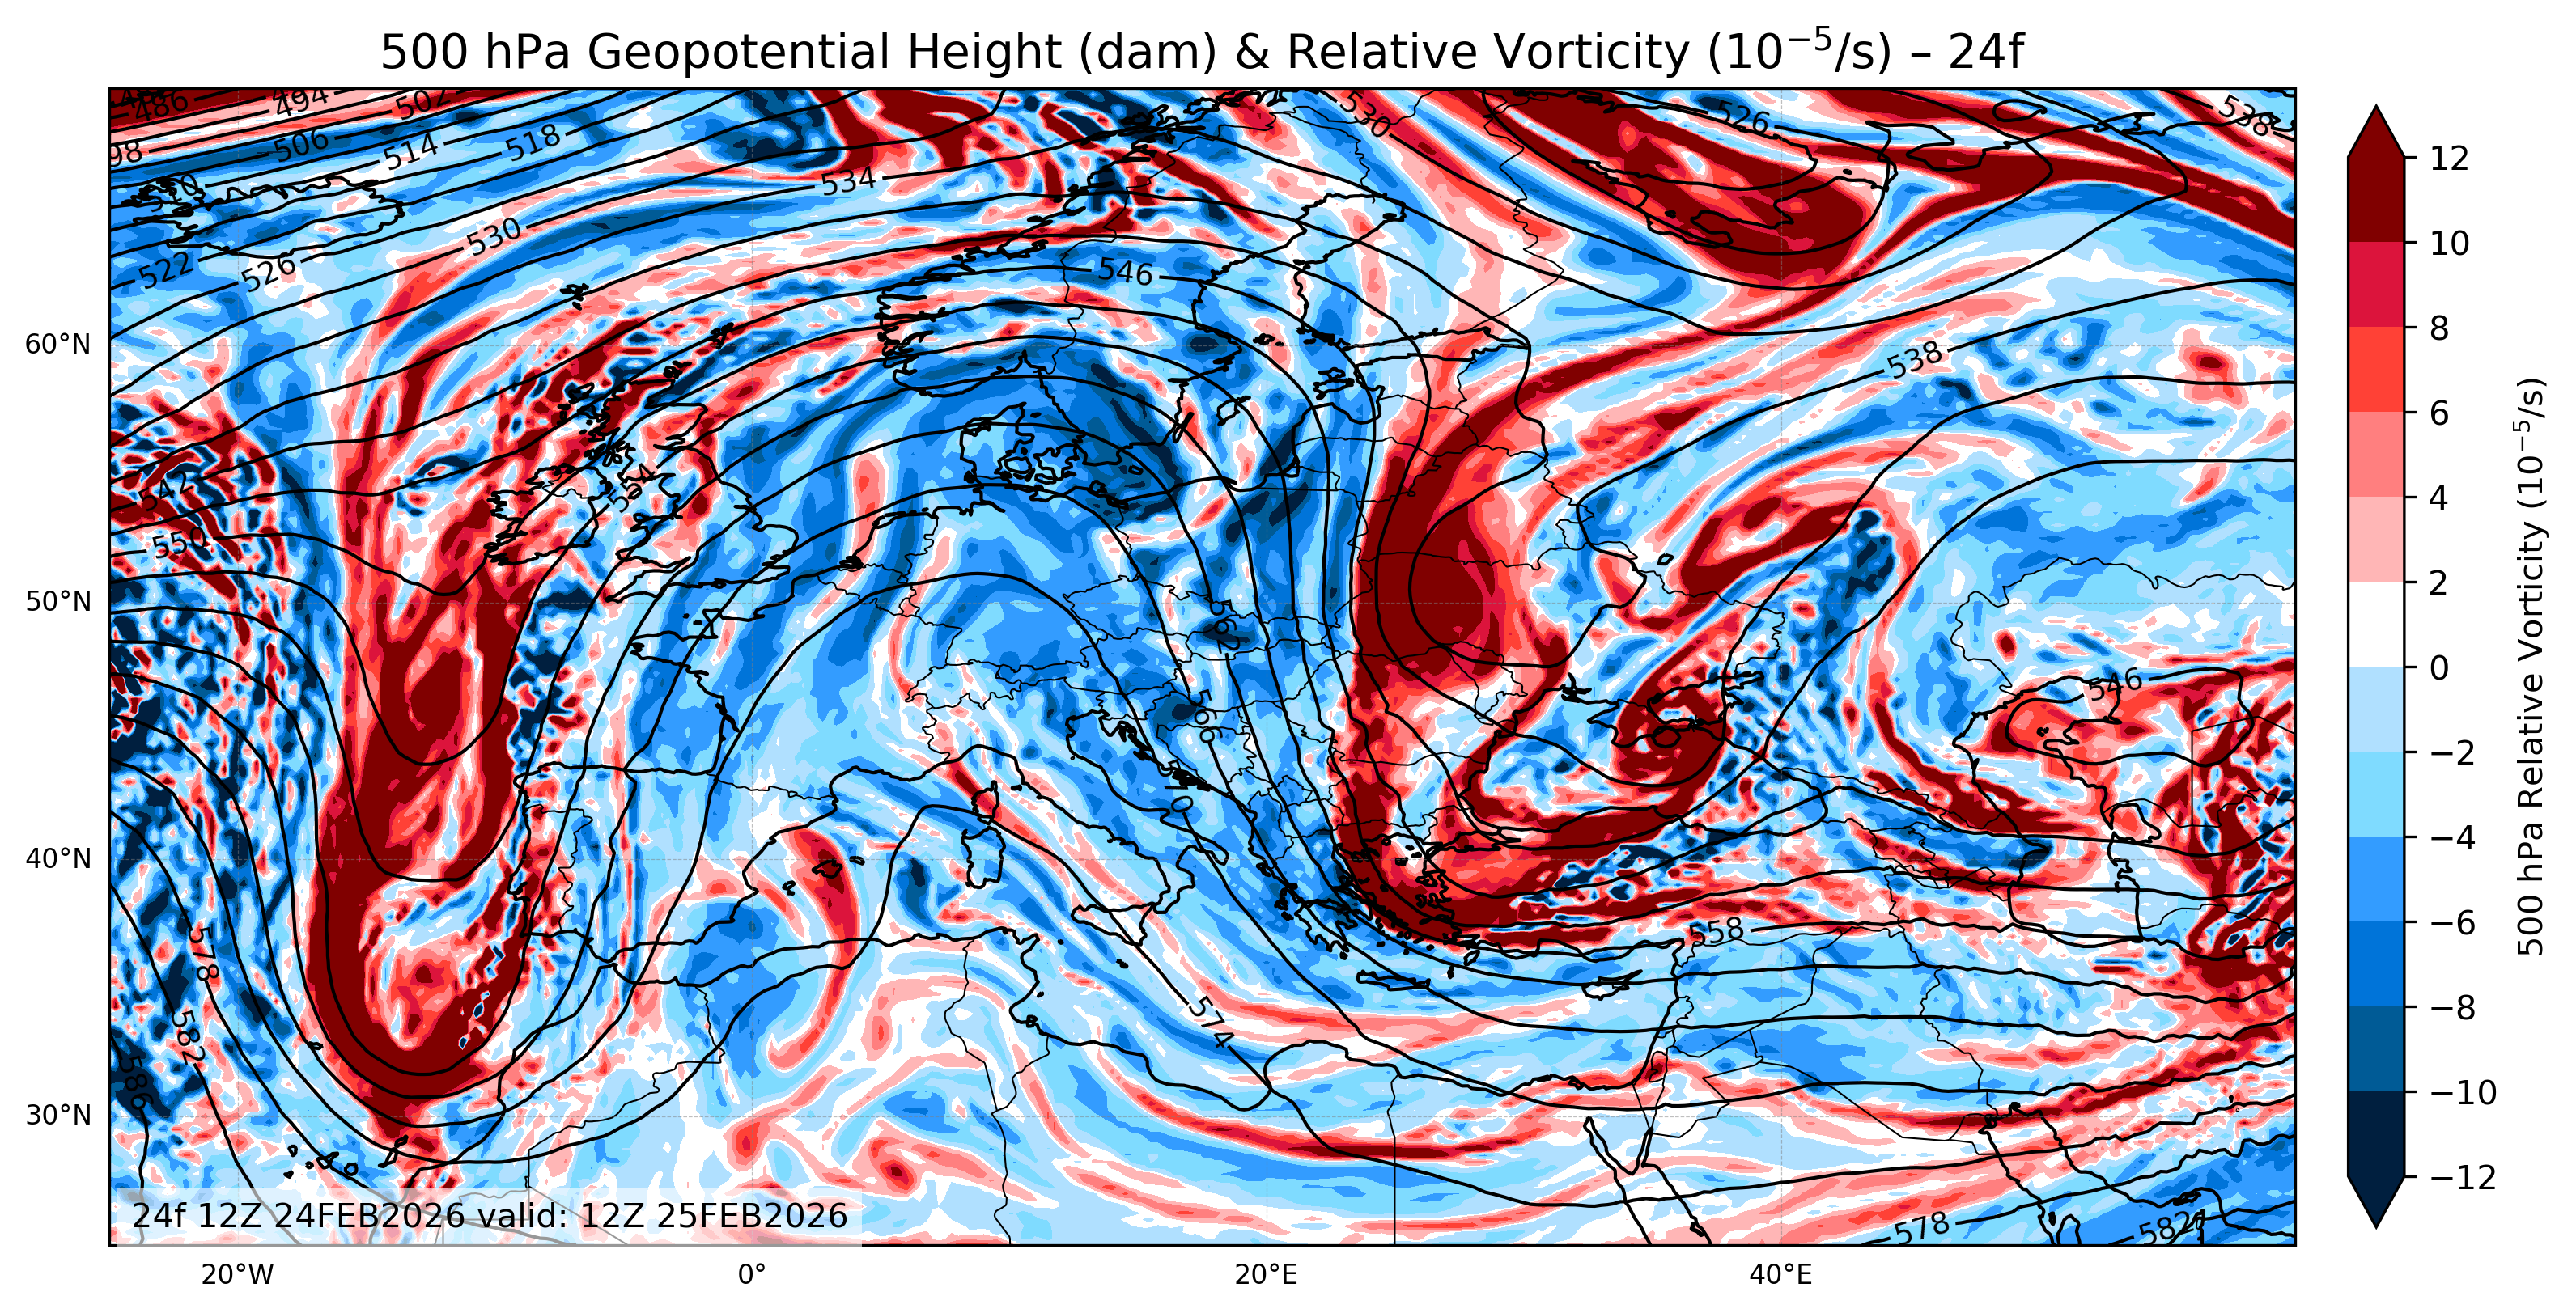
- 24-Hour Forecast: A short-term prediction for tomorrow’s weather patterns.
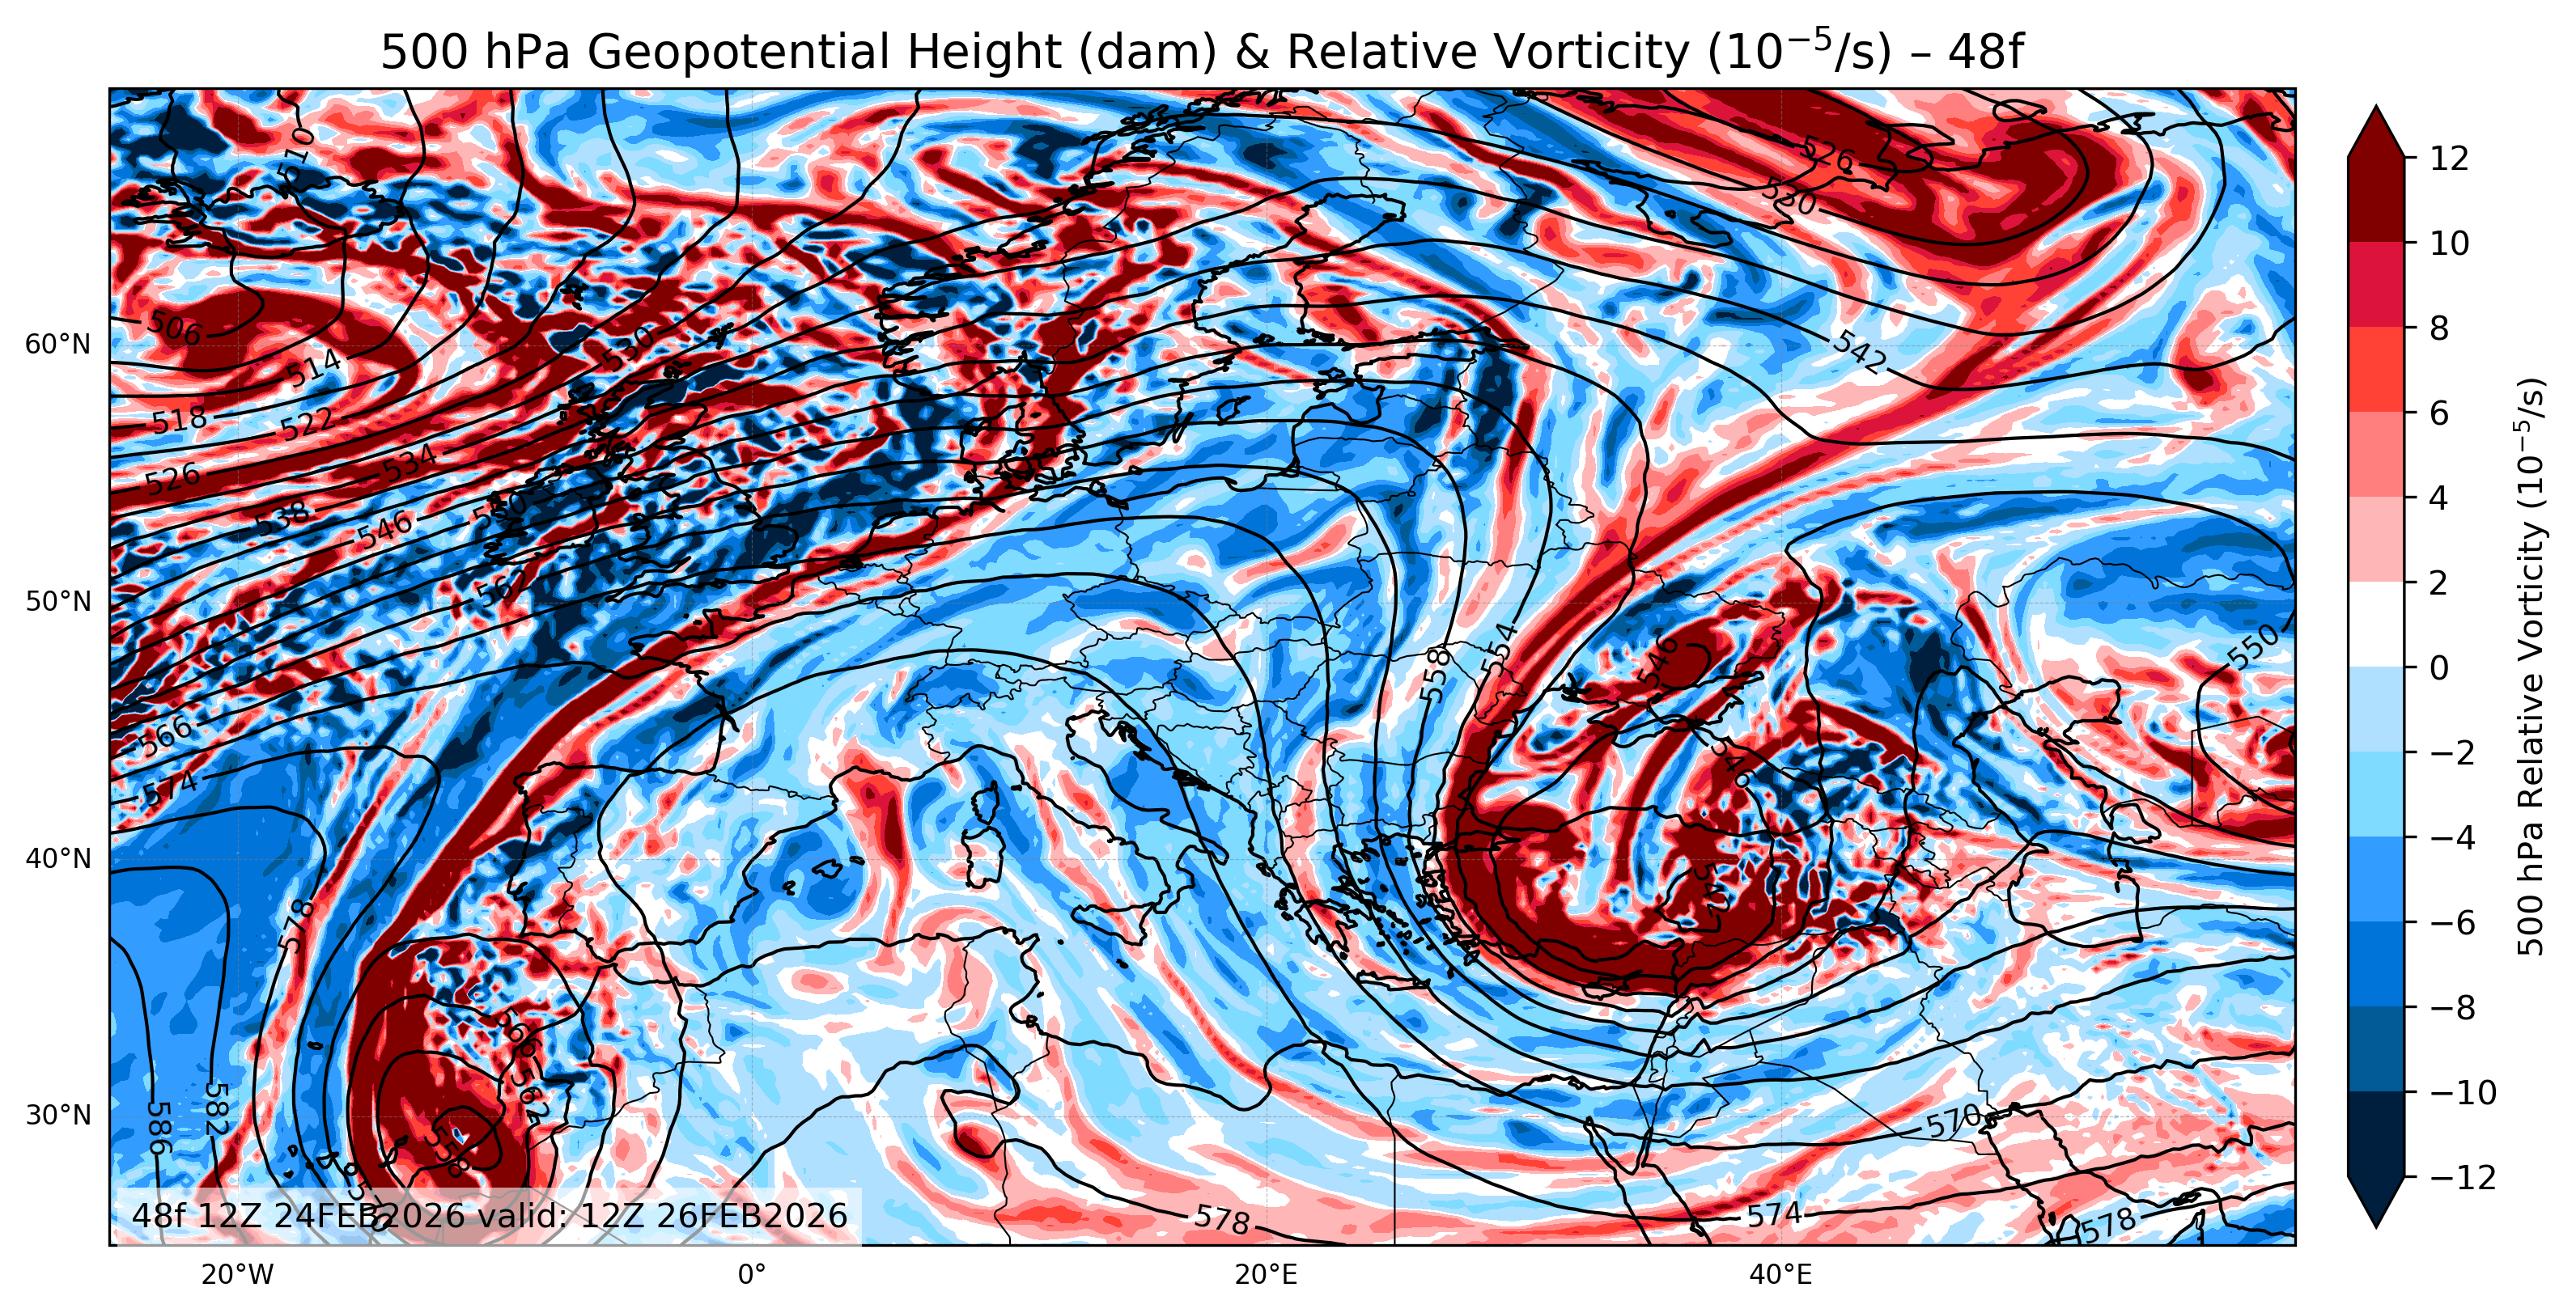
- 48-Hour Forecast: A medium-range view showing how troughs and ridges will shift in two days.
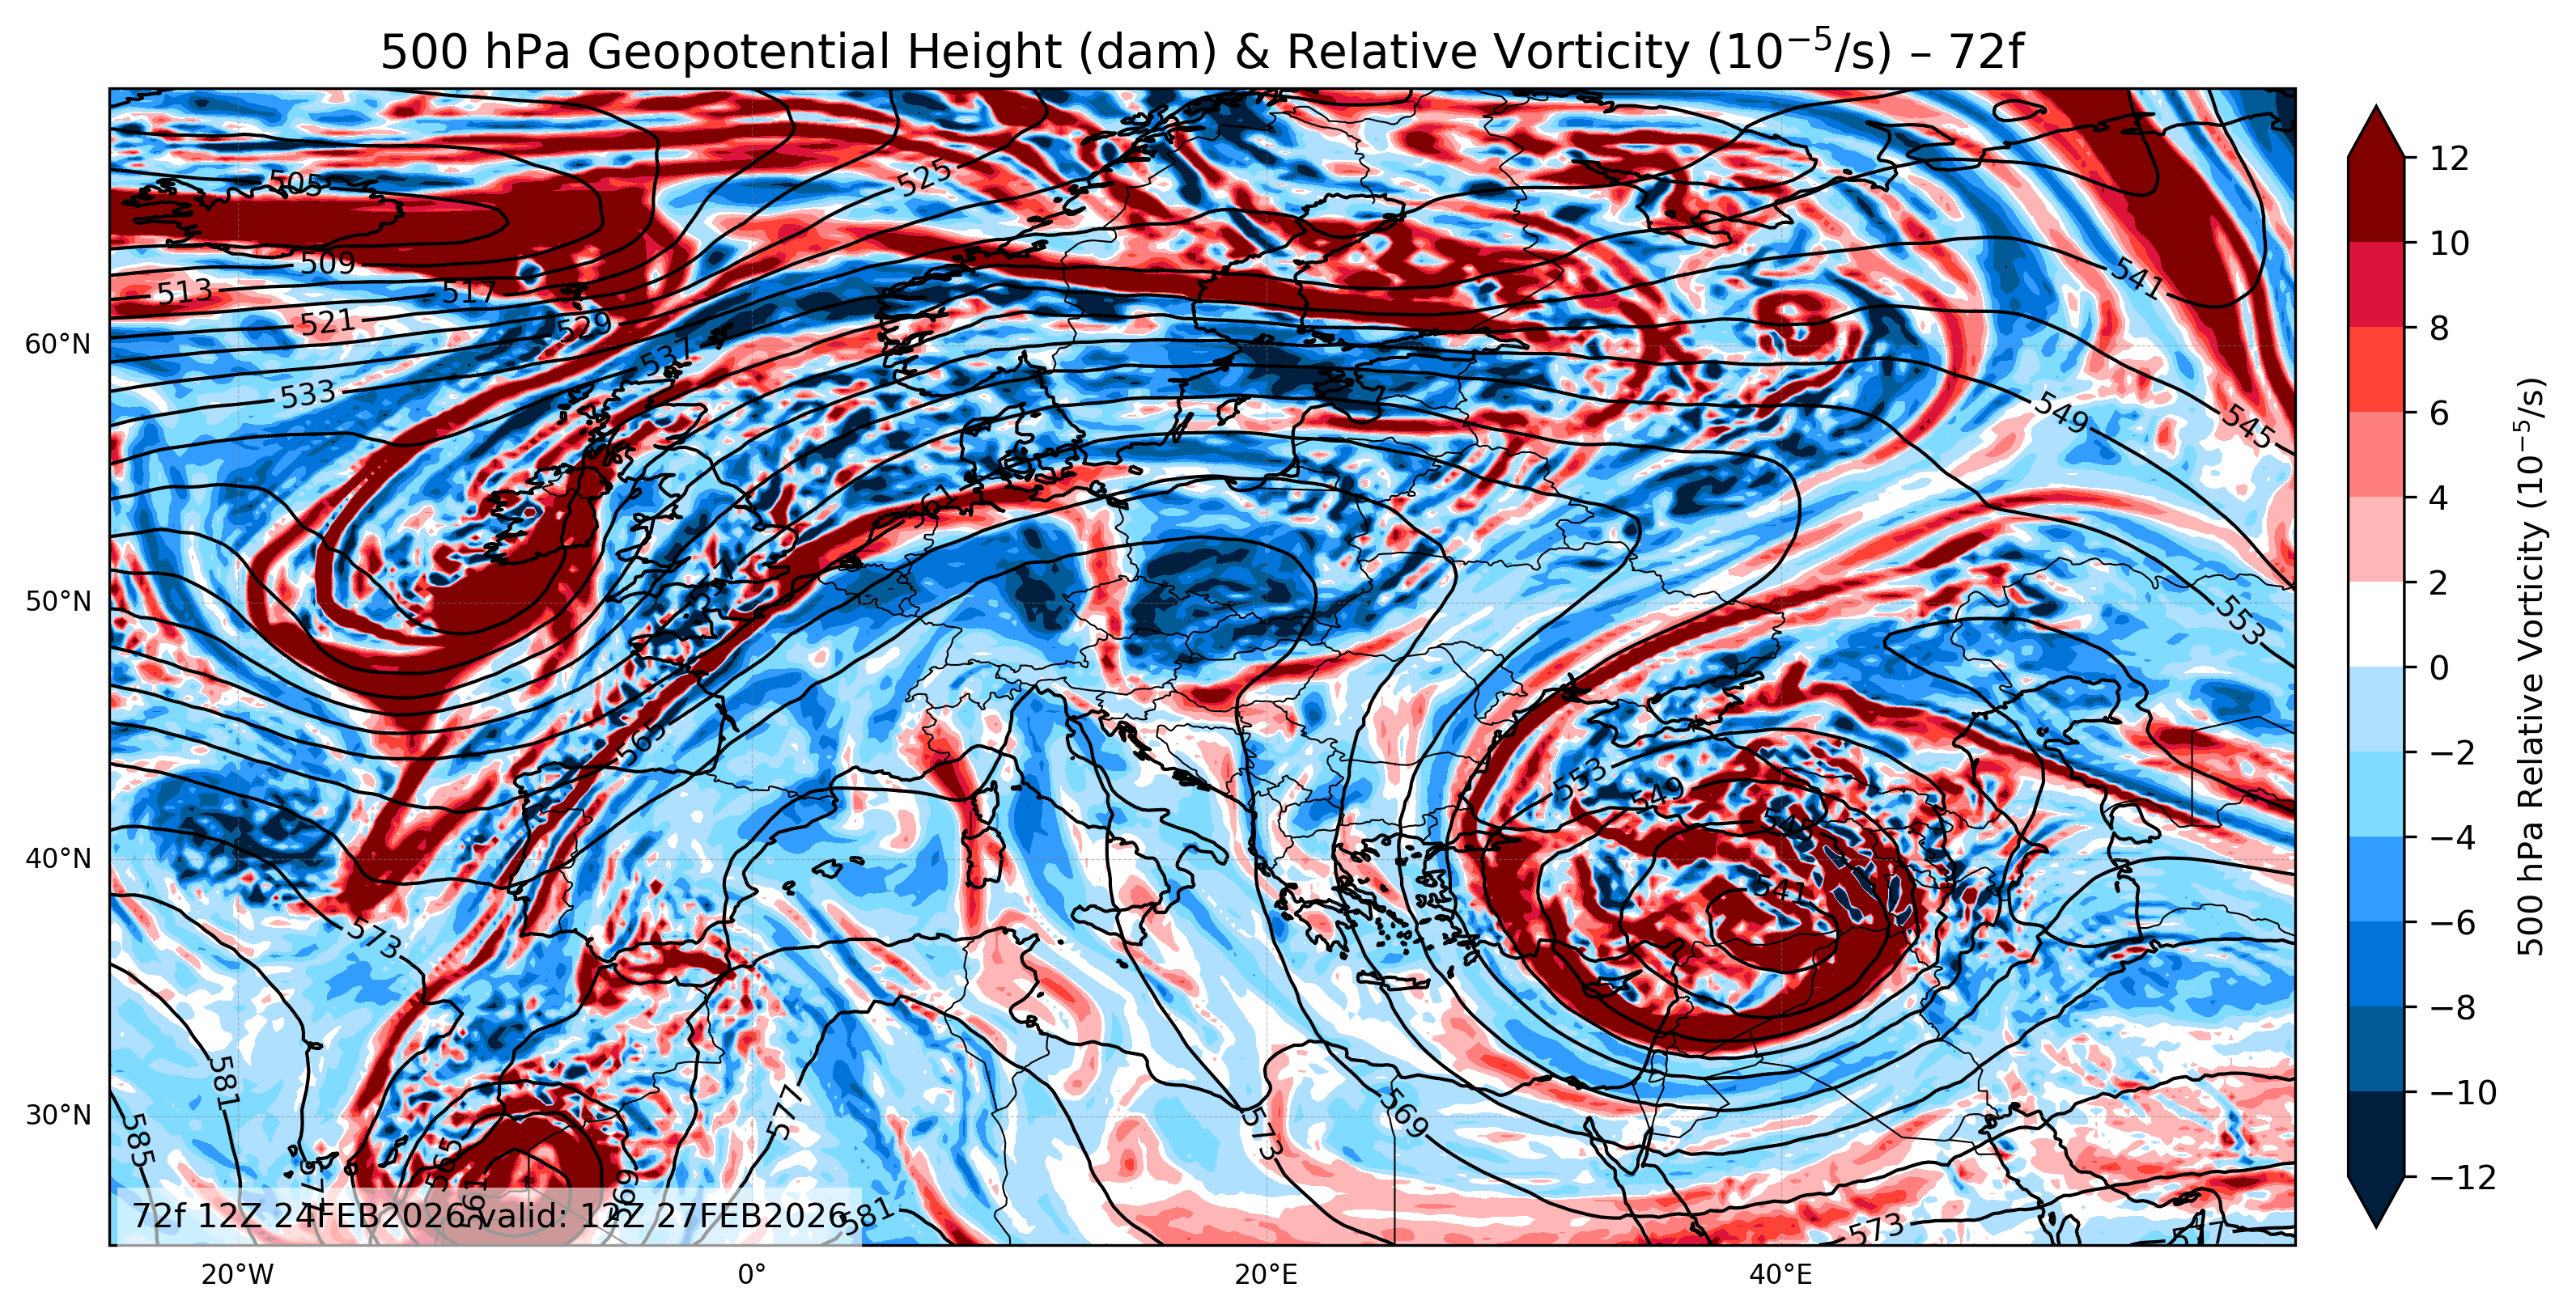
- 72-Hour Forecast: A 3-day outlook essential for spotting major weather changes before they arrive.
Conclusion: Euro 500 hPa Geopotential Height and Relative Vorticity
In summary, the Euro 500 mb Geopotential Height and Relative Vorticity chart series is a powerful forecasting tool. By combining the steering flow of the geopotential height map with the storm-generating power of positive relative vorticity, you can accurately predict European weather patterns. Definitely use it on other maps.