To predict tomorrow’s weather accurately, forecasters rely on specific predictive models. The Euro 500 hPa Geopotential Height and Relative Vorticity 24 chart is the standard tool for visualizing the state of the upper atmosphere exactly 24 hours from now.
This guide will help you interpret this geopotential height map, understand the physics of relative vorticity, and use this 24-hour forecast to anticipate weather changes.
What Is Geopotential Height in Forecasting?
Before diving into the forecast, it is essential to understand the basics of geopotential height meteorology.
What is geopotential height? It is the actual altitude of a pressure surface above mean sea level. On this 500 hpa geopotential height map, we are looking at the atmosphere roughly 5,500 meters up. This level is critical because it steers surface weather systems. Models like the GFS 500mb geopotential height use these contours to show us the “traffic flow” of the atmosphere.
Reading the Euro 500 hPa Geopotential Height and Relative Vorticity 24 Map
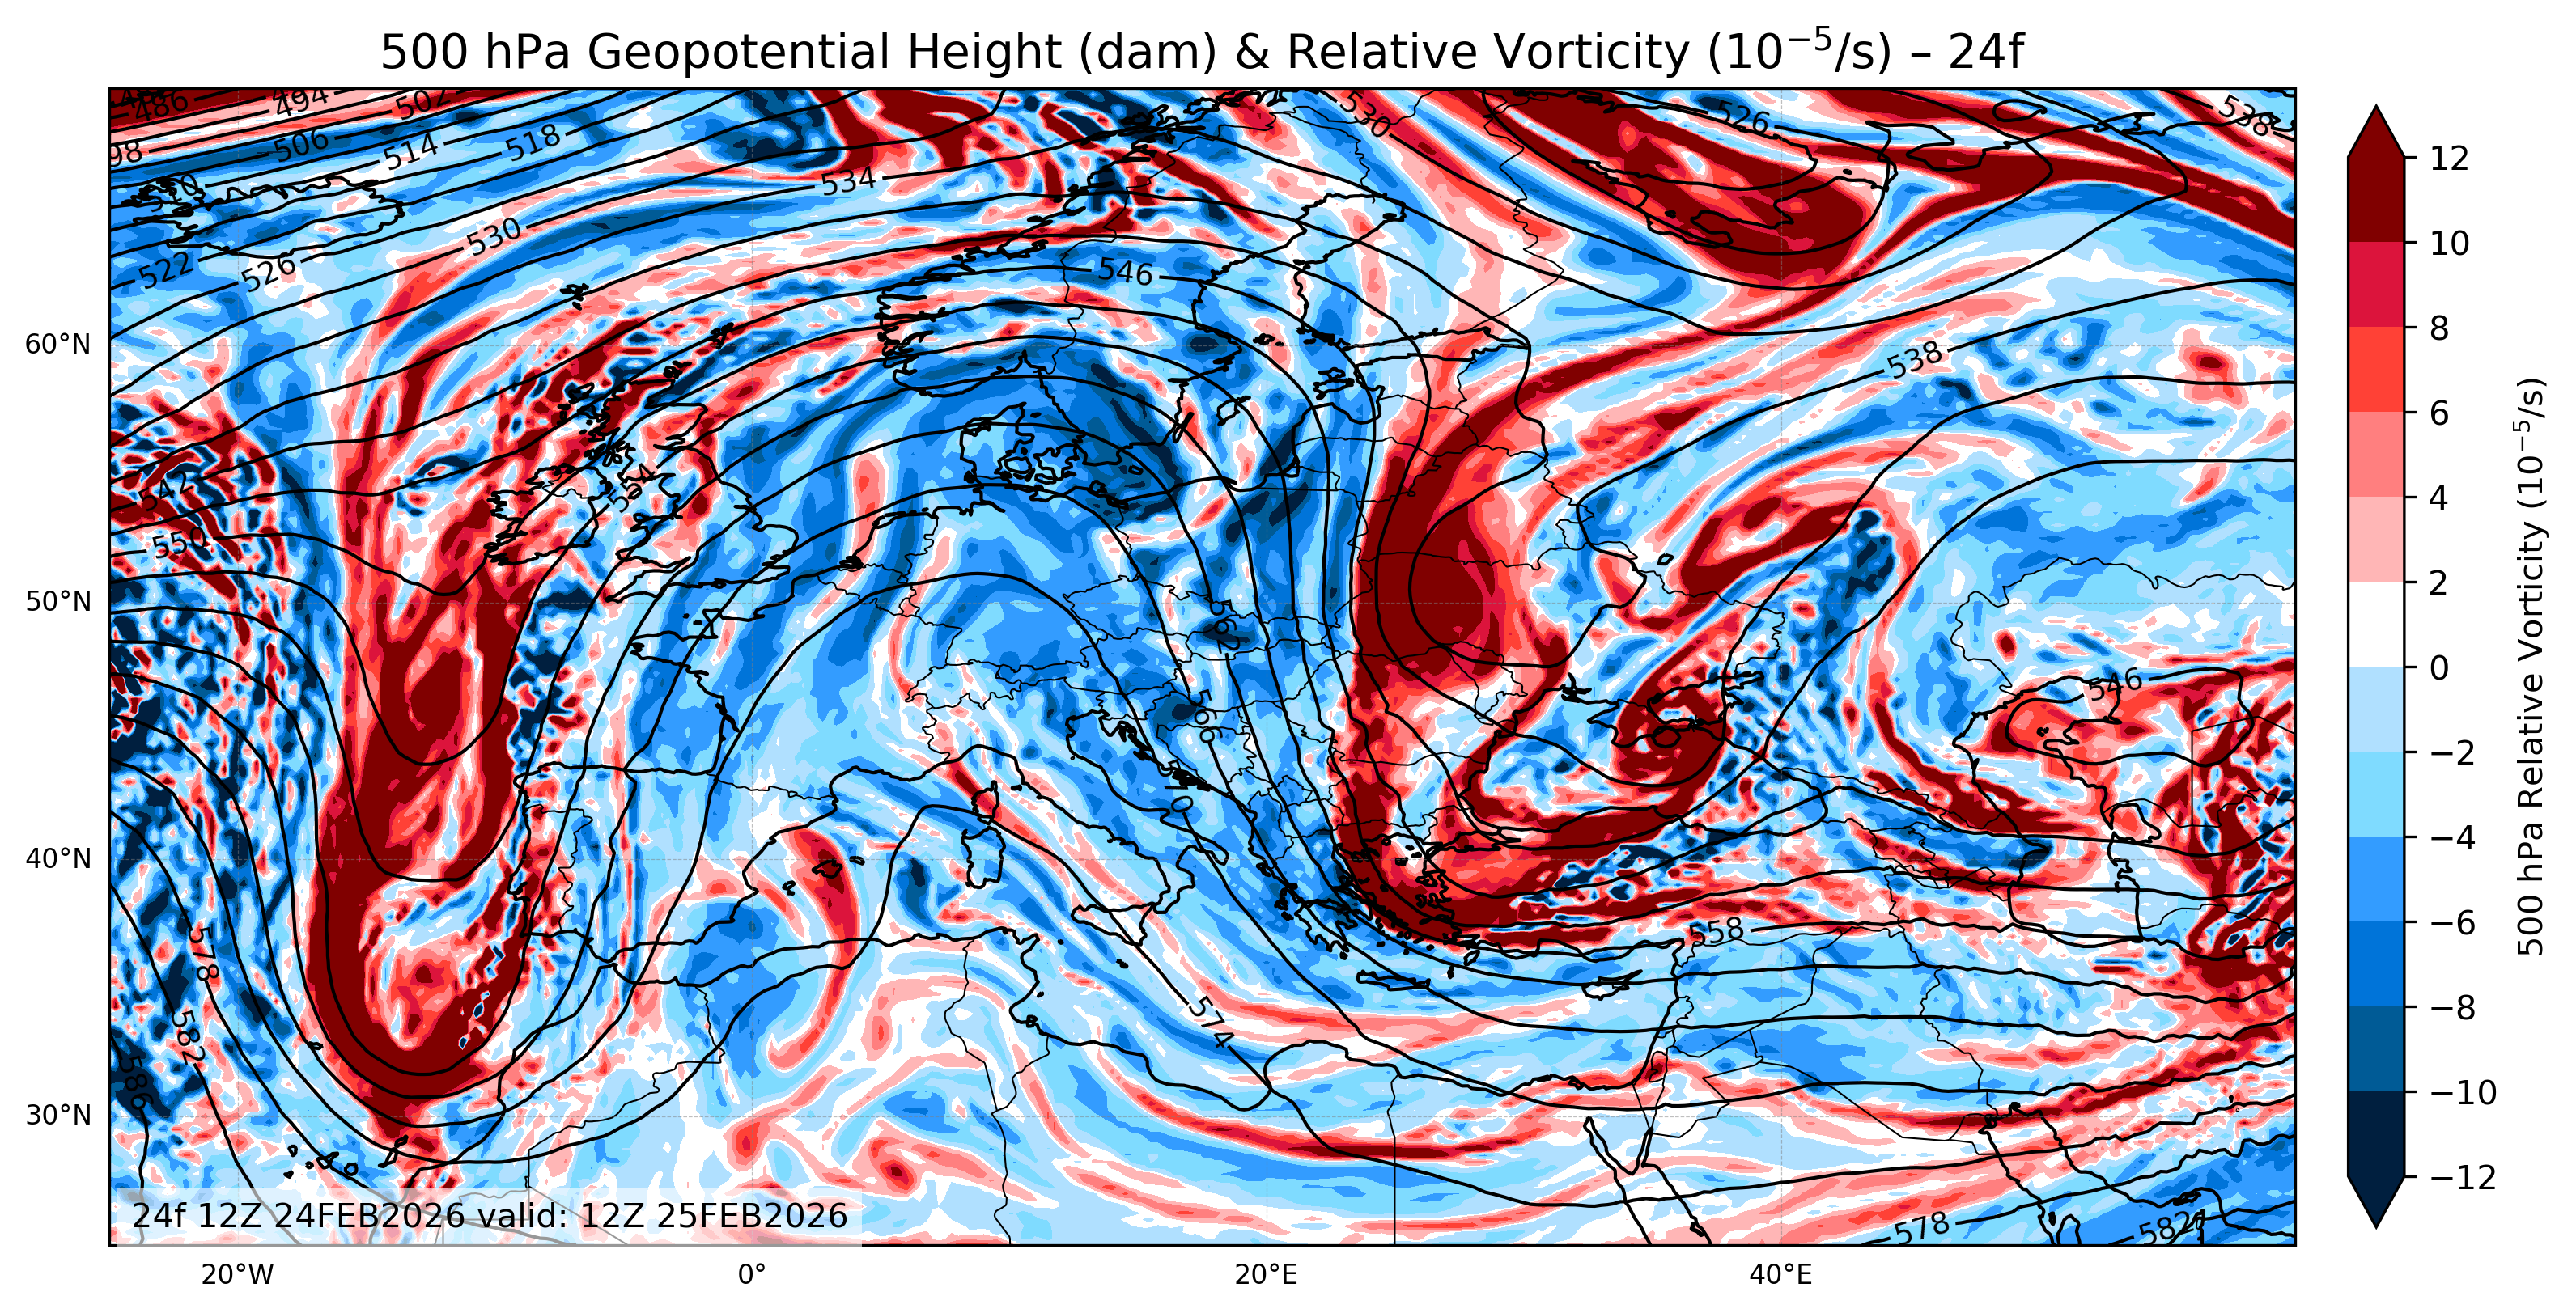
This specific chart projects the weather one day into the future. It combines the black height contours with colored zones representing relative vorticity. Here is how to read the forecast for tomorrow:
1. Red Areas (Positive Vorticity)
The red and dark brown zones on the Geopotential Height and Relative Vorticity 24 map indicate predicted positive relative vorticity.
- The Forecast: These colors represent areas where the air will have strong cyclonic rotation (counter-clockwise spin) in 24 hours.
- Weather Expectation: Positive vorticity creates lift. Therefore, if you see red approaching your area on this chart, expect clouds, rain, or storm development tomorrow. These zones often sit inside low-pressure troughs.
2. Blue Areas (Negative Vorticity)
The blue zones indicate predicted negative relative vorticity.
- The Forecast: These areas represent anticyclonic rotation (clockwise spin).
- Weather Expectation: Negative vorticity suppresses vertical motion. Consequently, if the map shows blue over your region in 24 hours, you can predict clearing skies and stable conditions associated with high-pressure ridges.
Conclusion: Euro 500 hPa Geopotential Height and Relative Vorticity 24
In summary, the Euro 500 mb Geopotential Height and Relative Vorticity 24 chart is your window into tomorrow’s weather. By visualizing where the red zones (active weather) and blue zones (calm weather) will move, you can make accurate short-term predictions. You need to compare it not only to this map but to all other maps. Although it appears red at 500 hPa, conditions such as vertical velocity, low pressure centers at ground level, etc., also affect the weather.
Click for Euro 500 mb geopotential height and relative vorticity 48f