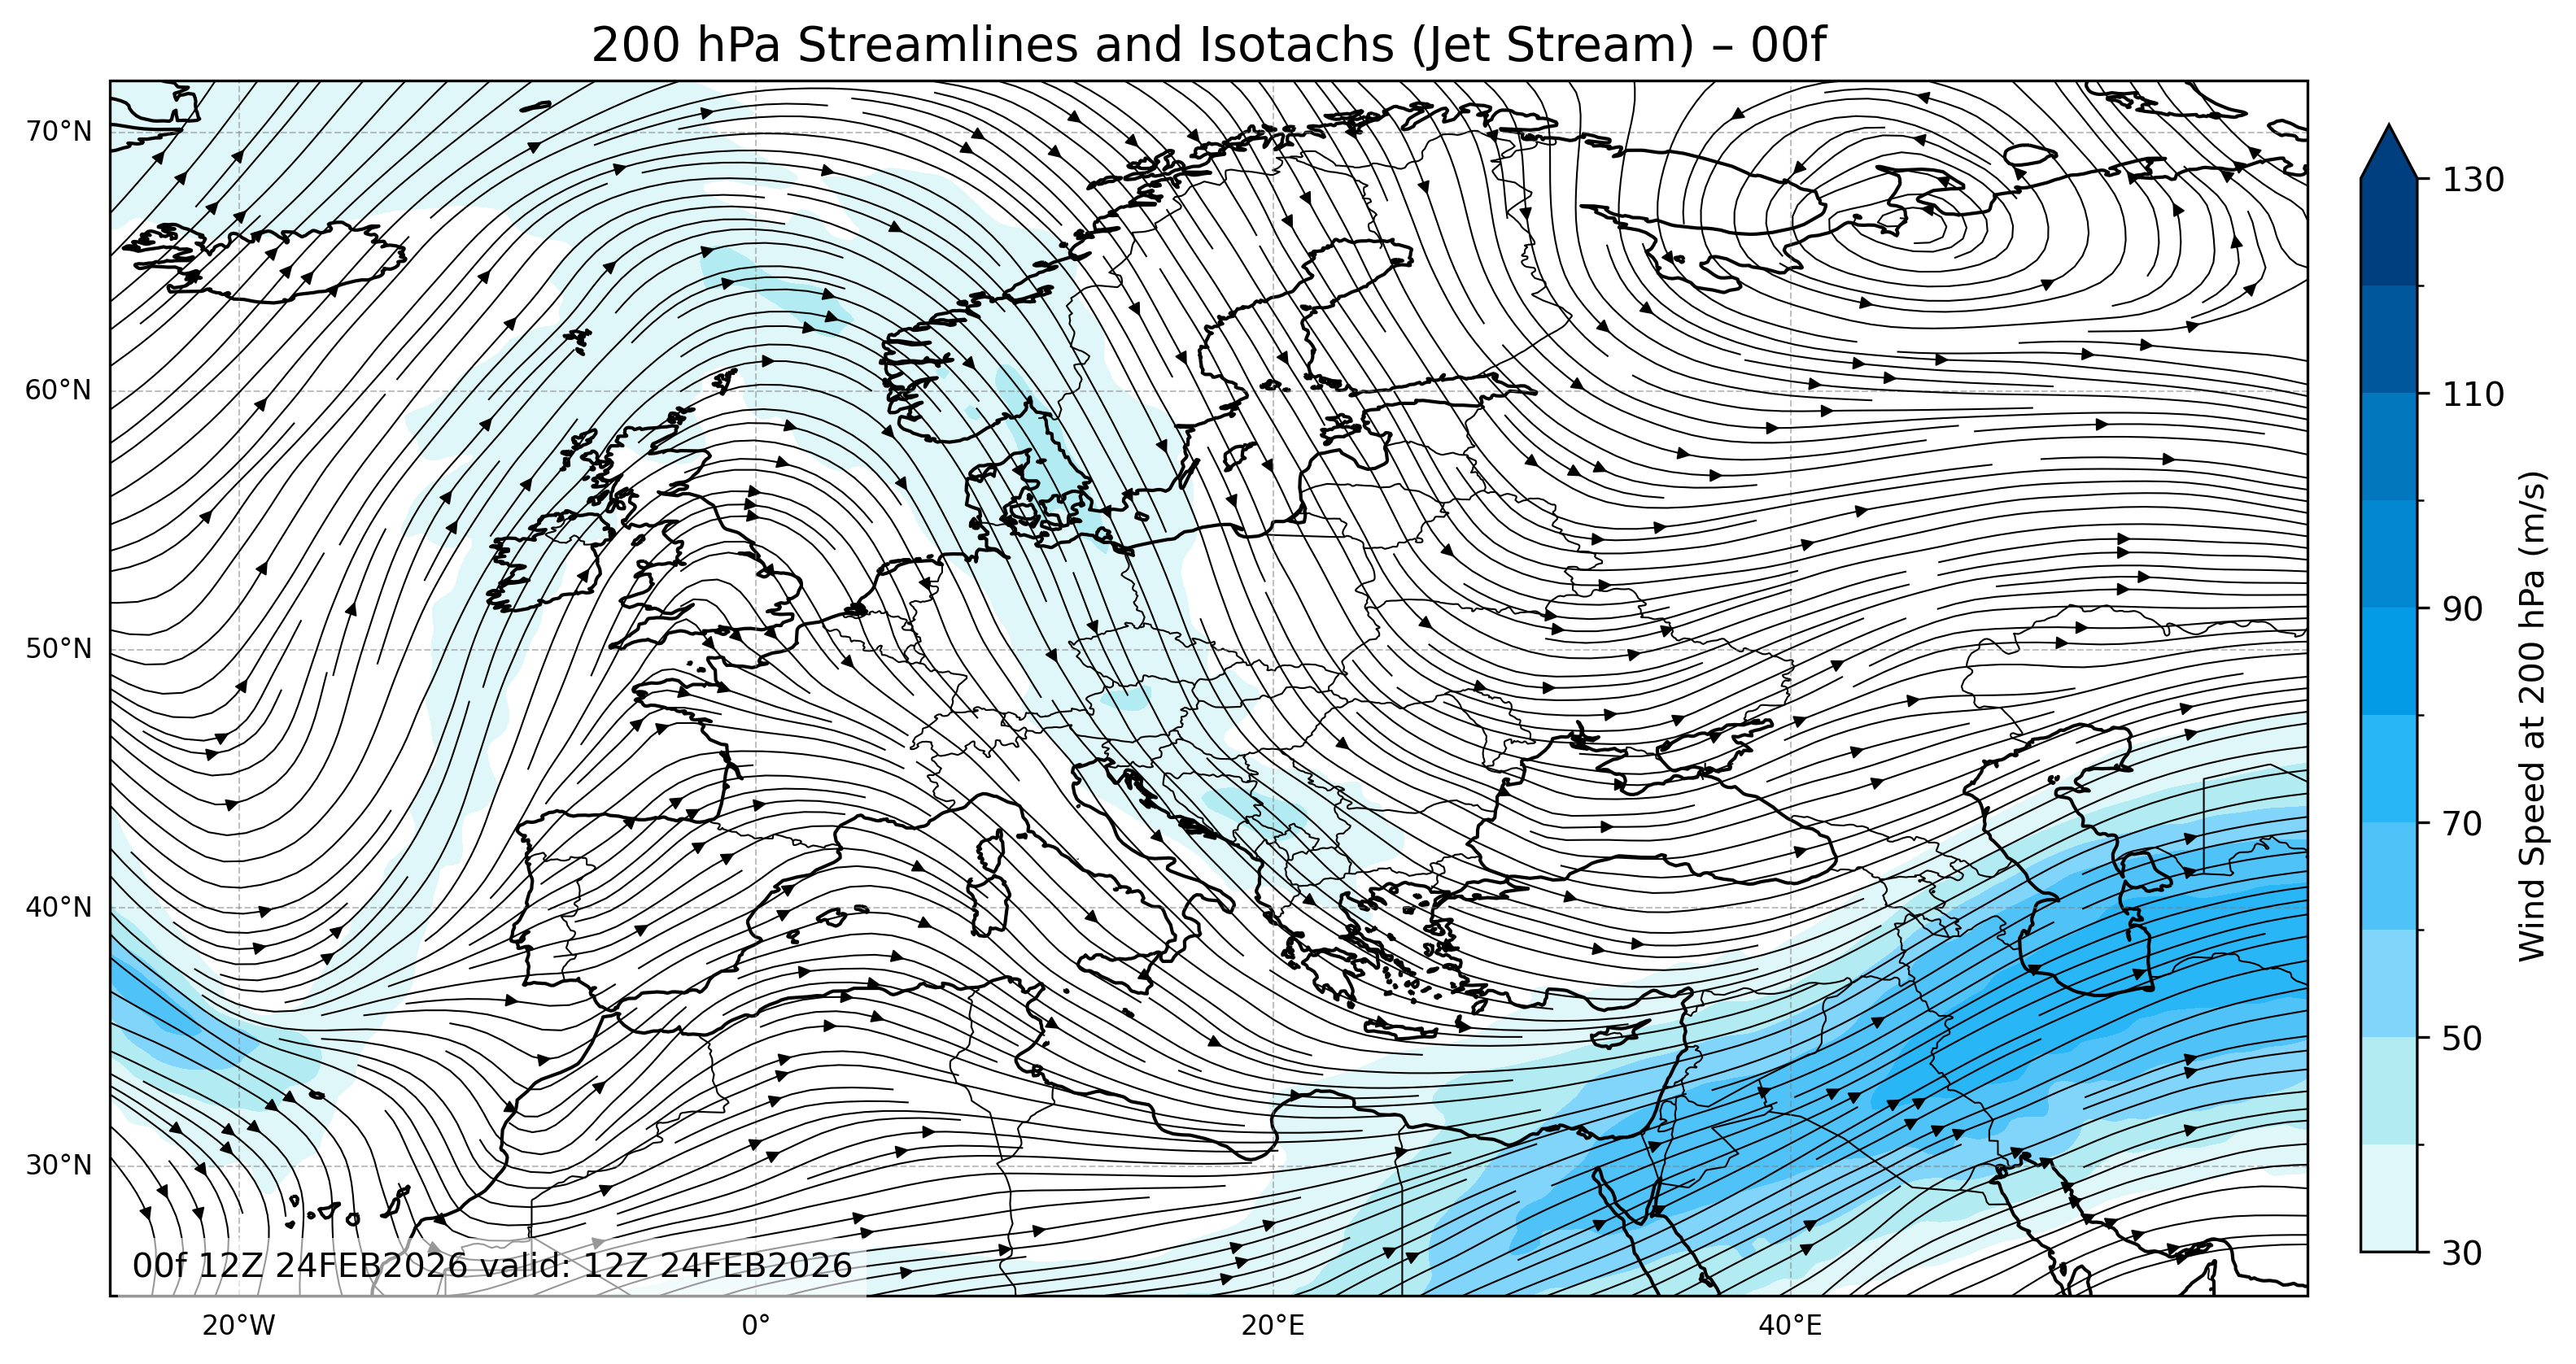
The Euro 200mb Streamlines Isotachs 00 map illustrates the upper-level wind pattern across Europe, highlighting the jet streamlines and isotachs at 200 hPa. This level of the atmosphere—around 12 km above the surface—represents the tropopause, where the strongest upper-air winds are located.
What the 200mb Streamlines and Isotachs Show
The streamlines represent the flow of air, indicating the direction and curvature of the jet stream, while isotachs show areas of equal wind speed.
- Darker blue shades on the map mark stronger wind speeds, often exceeding 100 m/s.
- The tightly packed streamlines reveal regions of enhanced jet streaks, which play a crucial role in storm development and weather dynamics at the surface.
This isotachs map provides meteorologists and weather enthusiasts with essential insight into upper-level dynamics that influence cyclones, anticyclones, and surface fronts across Europe.
Why 200mb Isotachs Maps Matter
Isotachs maps are fundamental for understanding the jet stream’s structure and identifying areas of strong vertical motion.
Meteorologists use these Euro 200mb Streamlines Isotachs analyses to:
- Forecast storm intensification and frontal movement.
- Detect jet streak entrances and exits, which are associated with rising and sinking air.
- Support aviation forecasts by identifying regions of turbulence and high-altitude wind shear.
Data and Visualization: Euro 200mb Streamlines Isotachs 00
This Euro 200mb Streamlines Isotachs 00 chart is based on model forecast data visualized at 200 hPa (≈12 km altitude). The map provides valuable information for synoptic meteorology, aviation weather, and climate research.