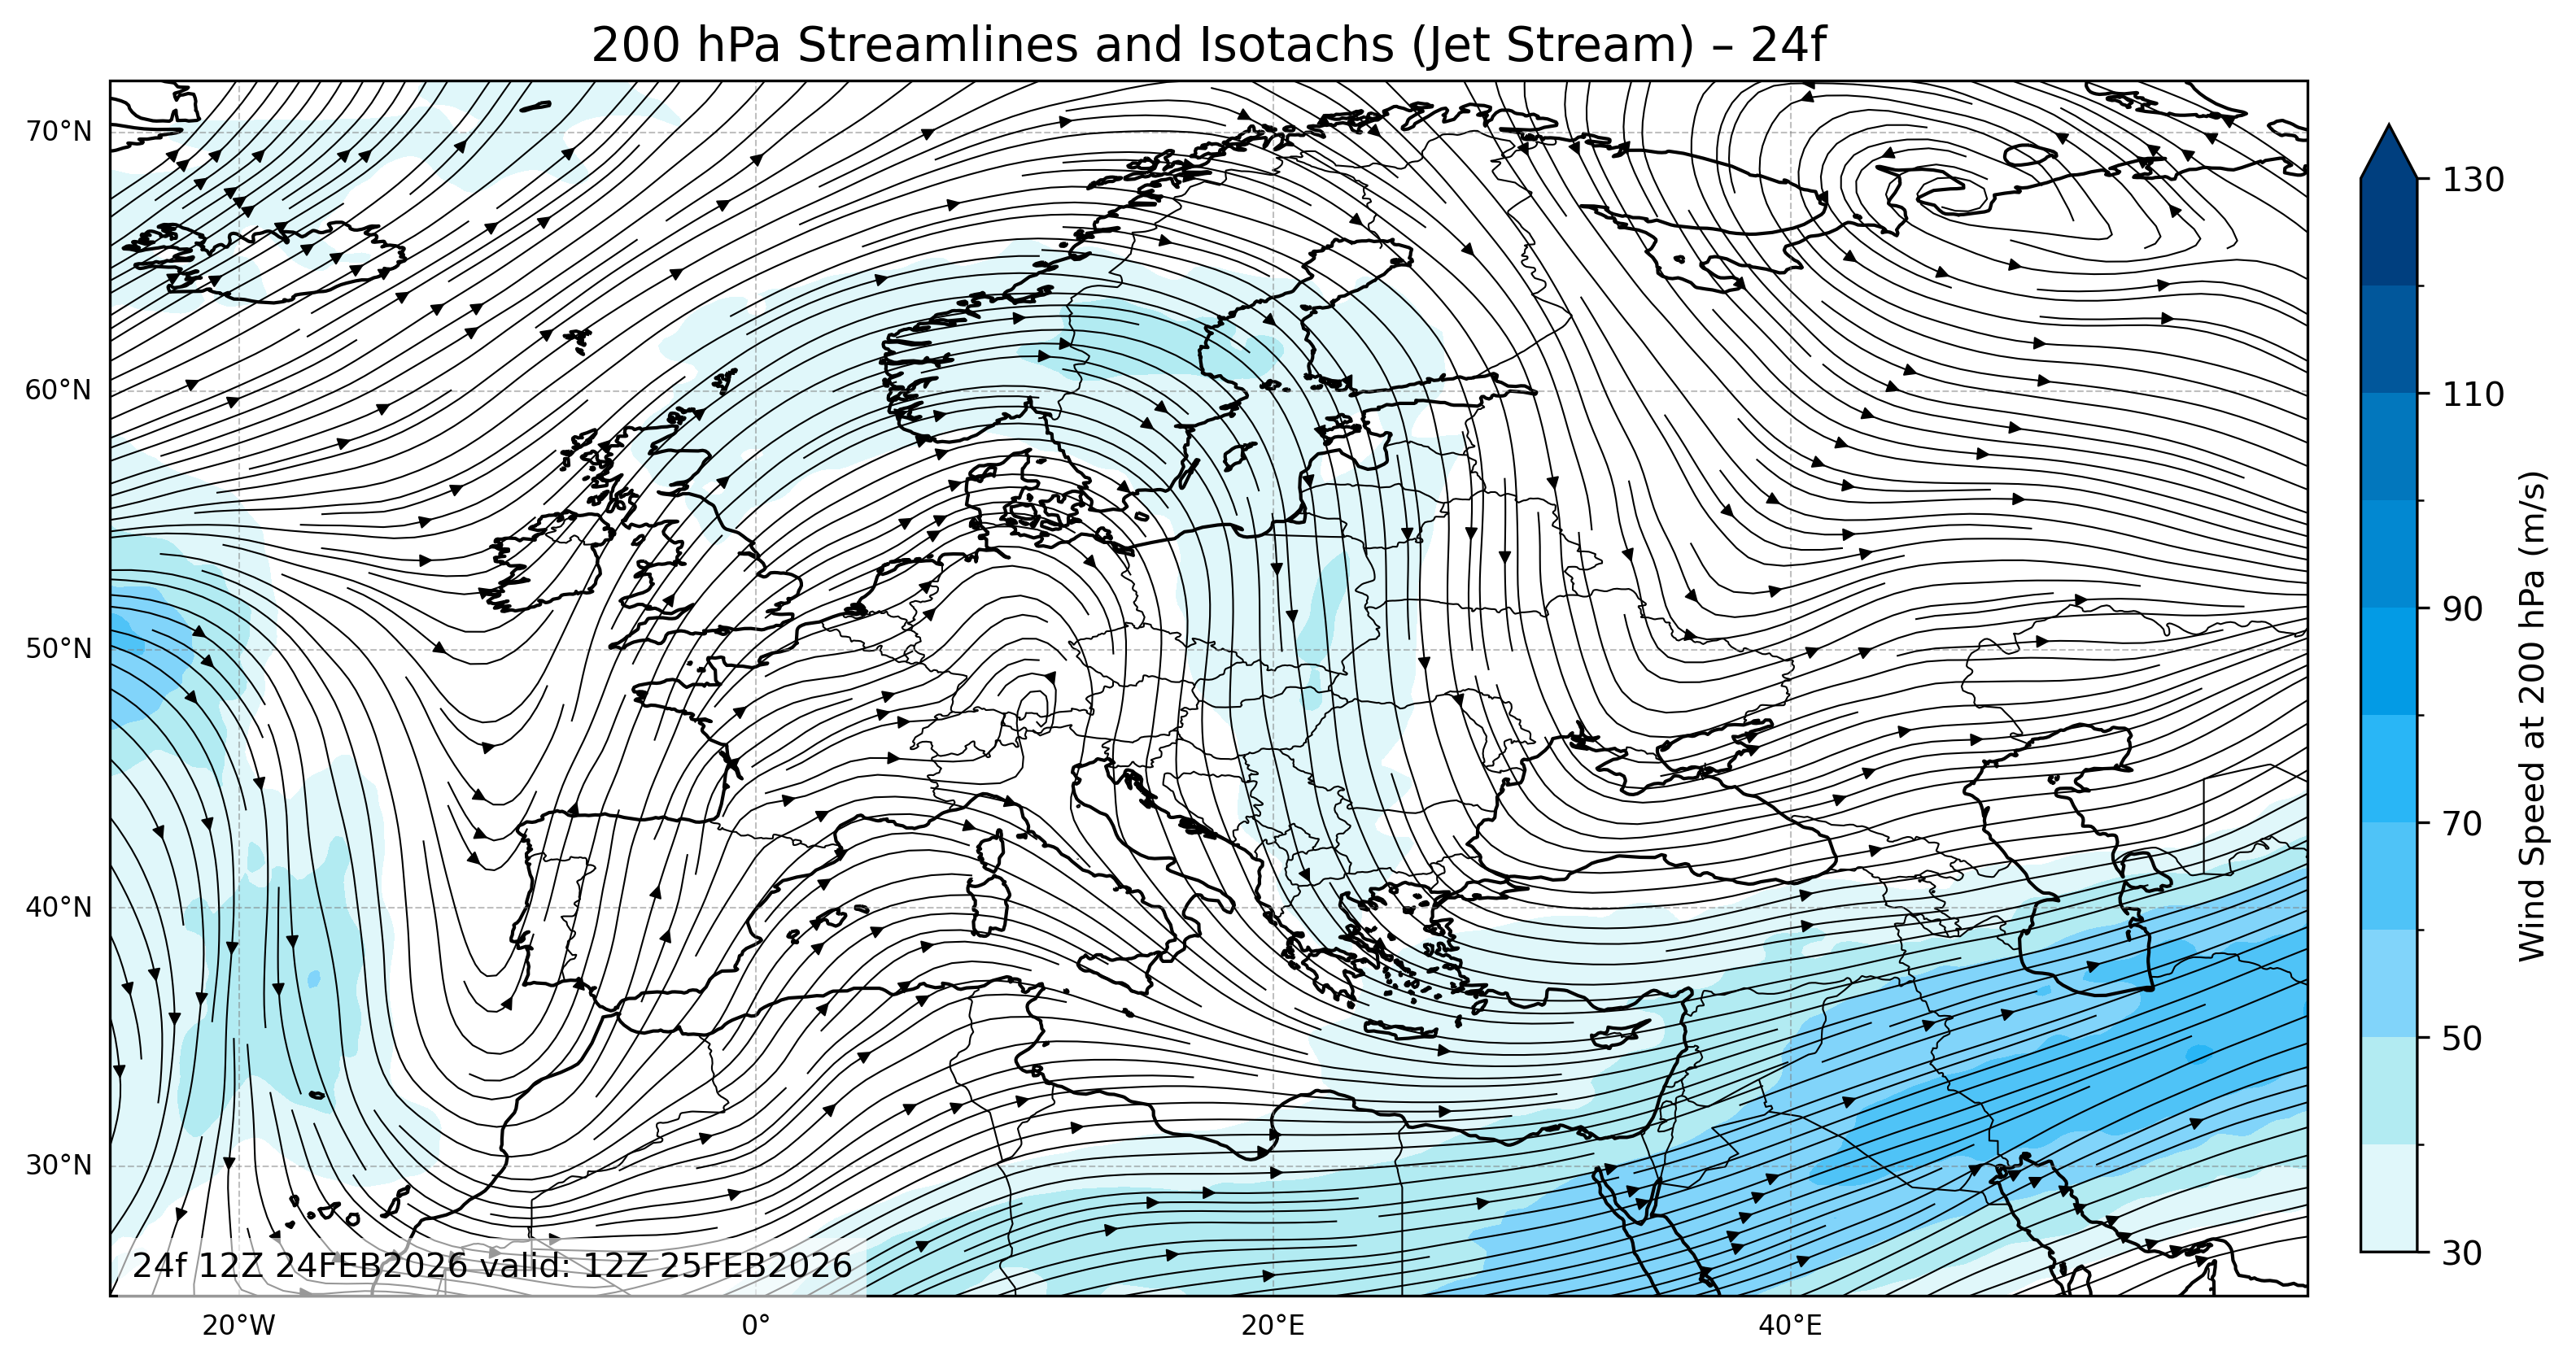
The Euro 200mb Streamlines and Isotachs 24 map displays the upper-level wind flow and jet stream patterns across Europe, based on forecast data at the 200 hPa pressure level—roughly 12 kilometers above the surface. This level corresponds to the tropopause, where the jet stream reaches its maximum intensity.
Understanding Streamlines
- Streamlines represent the direction and curvature of the wind flow.
- Arrows along the lines indicate where the air is moving.
- Closely packed streamlines mean stronger winds and greater wind shear.
- The general flow pattern helps identify troughs (dips) and ridges (rises) in the upper atmosphere.
By following these streamlines, users can track the path of the jet stream, which strongly influences storm systems and temperature advection at the surface.
Reading the Isotachs
- Isotachs are contour lines of equal wind speed, shown as color-filled bands.
- The color scale (usually in shades of blue) indicates wind speed intensity in meters per second (m/s).
- Lighter shades represent moderate winds, while darker shades show jet streaks—areas of maximum upper-level wind speed.
These isotachs maps help identify regions of strong divergence, potential turbulence, and rapid weather development.
What “24” Means in the Forecast
The number 24 in Euro 200mb Streamlines and Isotachs 24 refers to a 24-hour forecast from the model initialization time.
- For example, a “00” map shows current conditions,
- while a “24” map shows the predicted jet stream and isotachs pattern 24 hours later.
This allows users to compare time steps and monitor how the jet stream evolves day by day.
Euro 200mb Streamlines and Isotachs 24: Why These Maps Are Important
These maps are commonly used by:
- Meteorologists to locate jet cores and forecast storm development,
- Pilots to identify turbulent flight routes,
- Researchers studying large-scale atmospheric circulation, and
- Weather enthusiasts observing changes in upper-level dynamics.
Euro 200mb Streamlines and Isotachs 24: How to Interpret the Legend
The color bar on the right shows the wind speed at 200 hPa, typically ranging from 30 m/s to over 130 m/s.
- Lighter blues: slower winds,
- Darker blues: stronger jet stream winds.
The legend helps users quickly assess wind strength and jet intensity at different locations.