

For professional meteorologists and weather enthusiasts, understanding atmospheric motion is the key to accurate prediction. The Euro 700 mb Vertical Velocity chart series is the primary tool used to visualize vertical air movement across the European continent. Whether you are looking at the current analysis or planning for the days ahead, these maps provide the essential data needed to forecast storms and clear spells.
How to Read the Euro 700 mb Vertical Velocity Maps
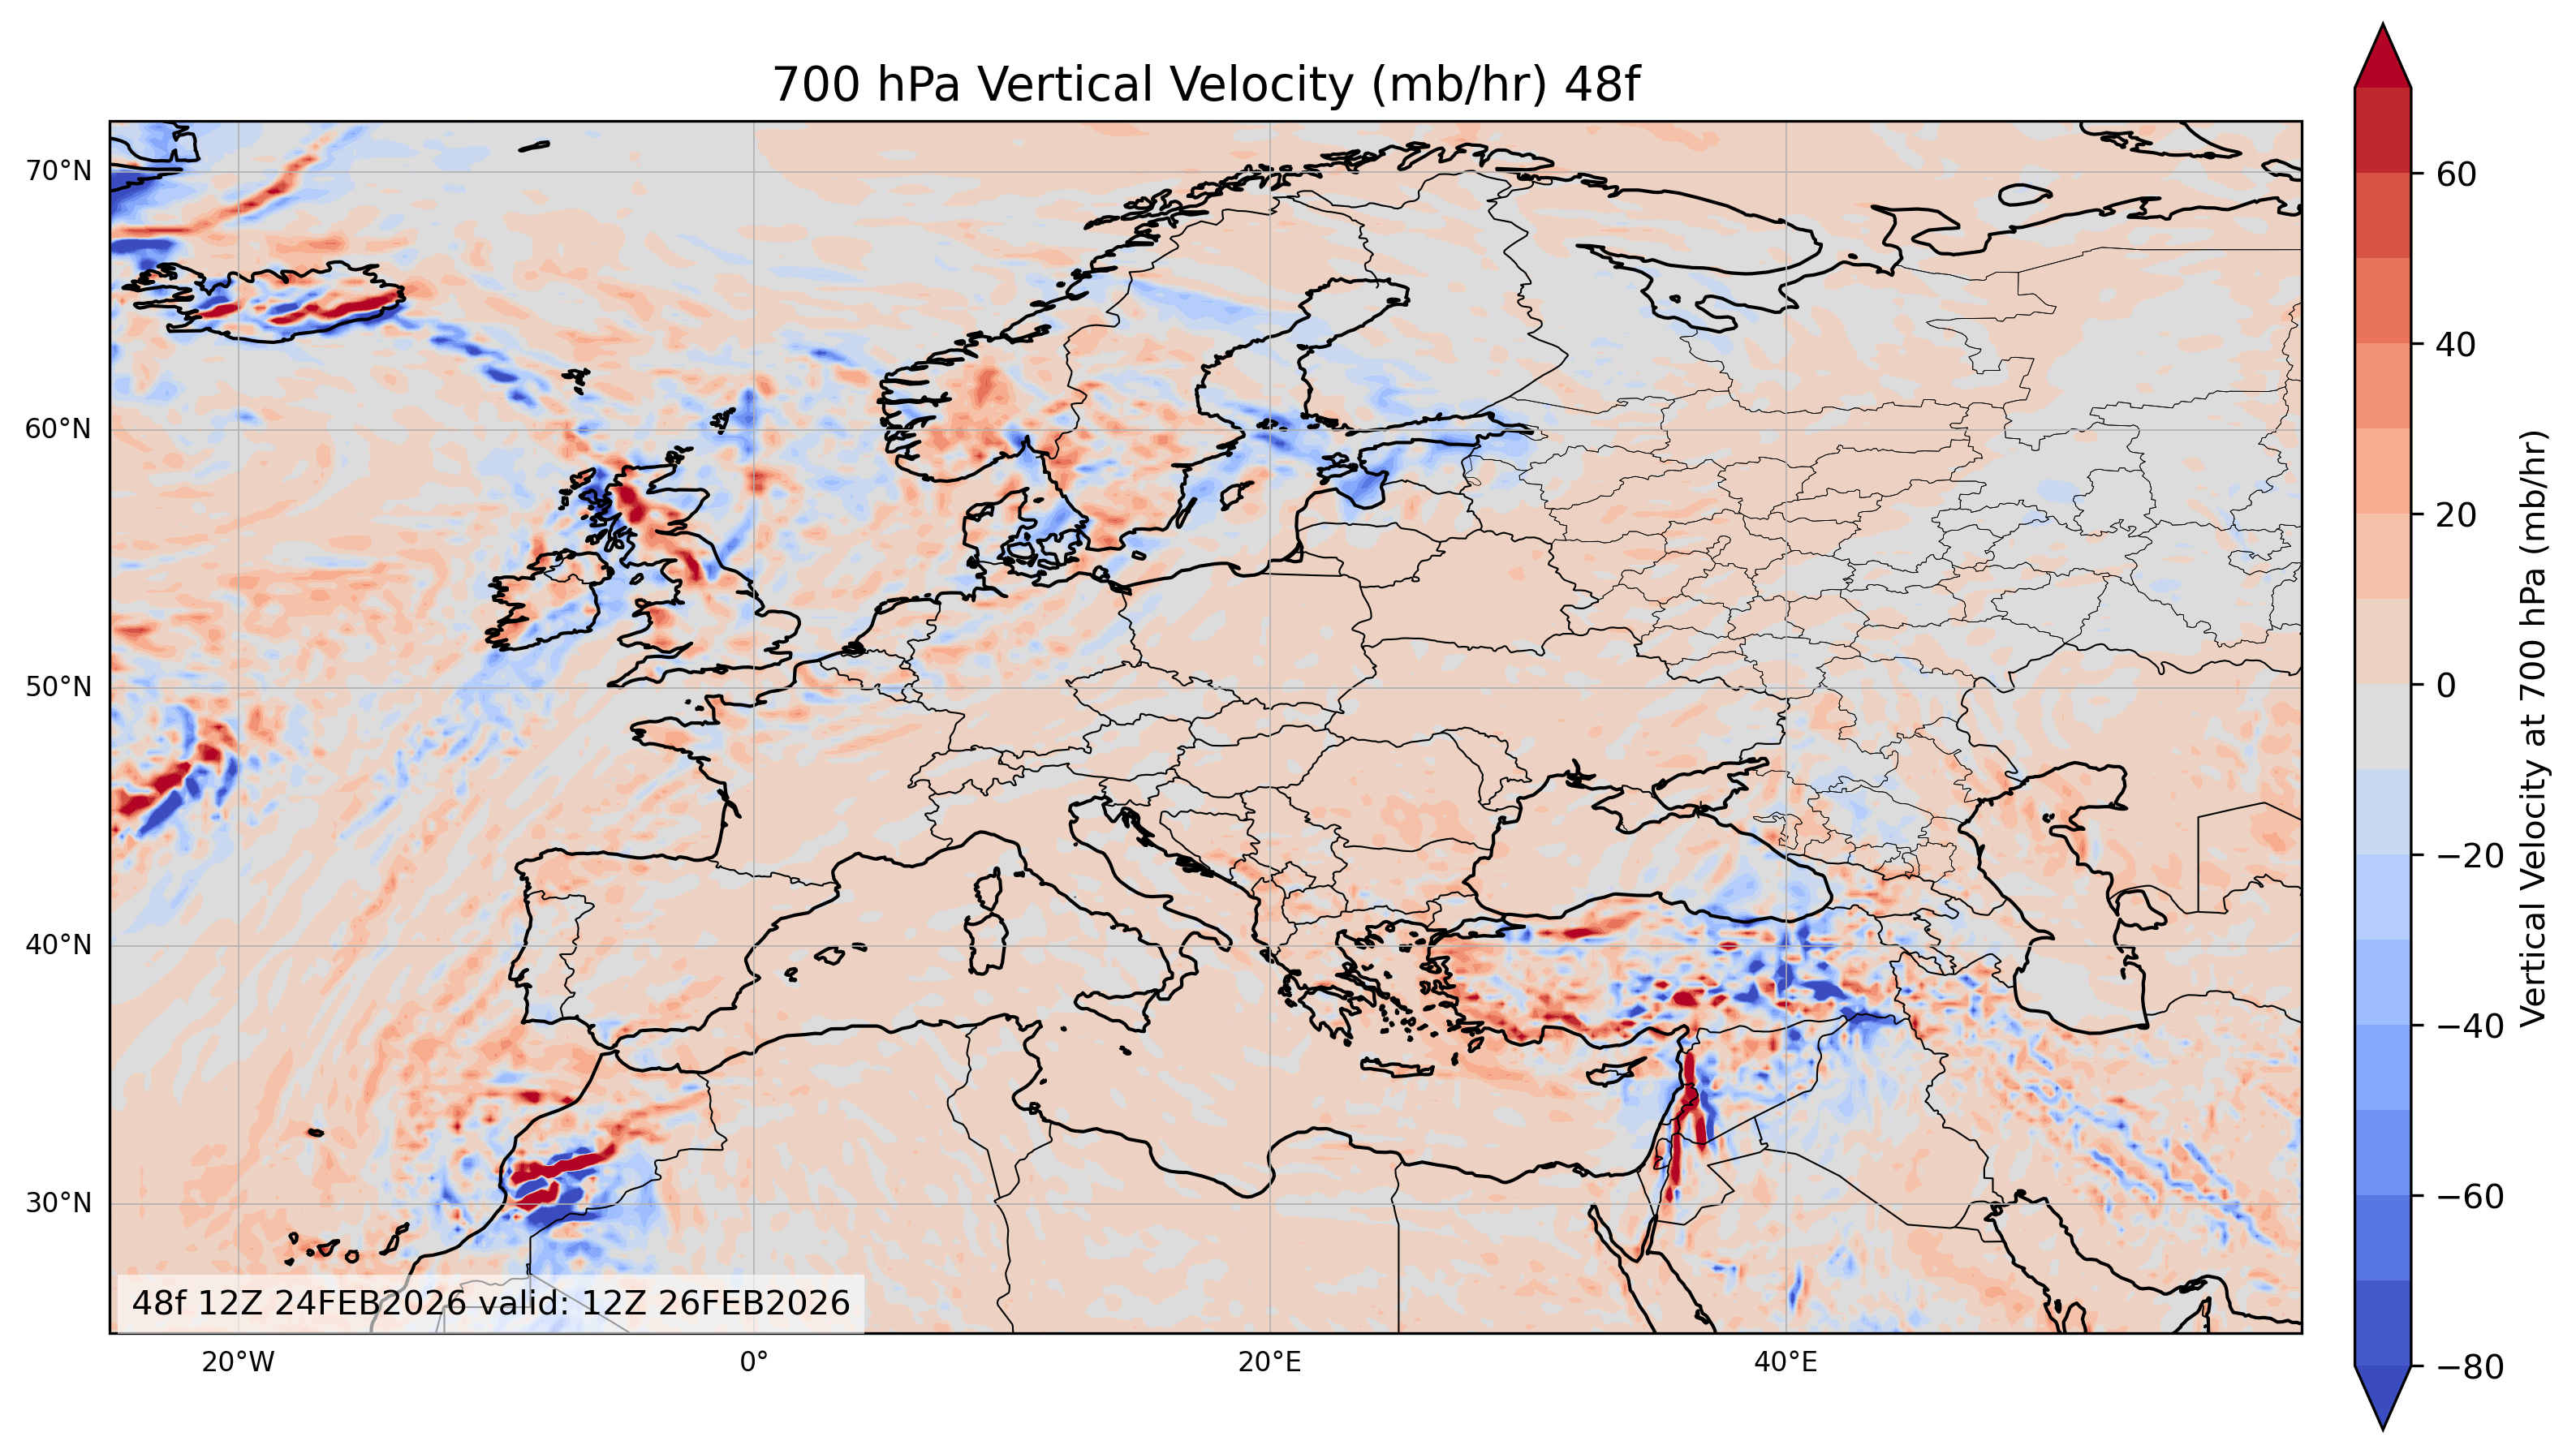
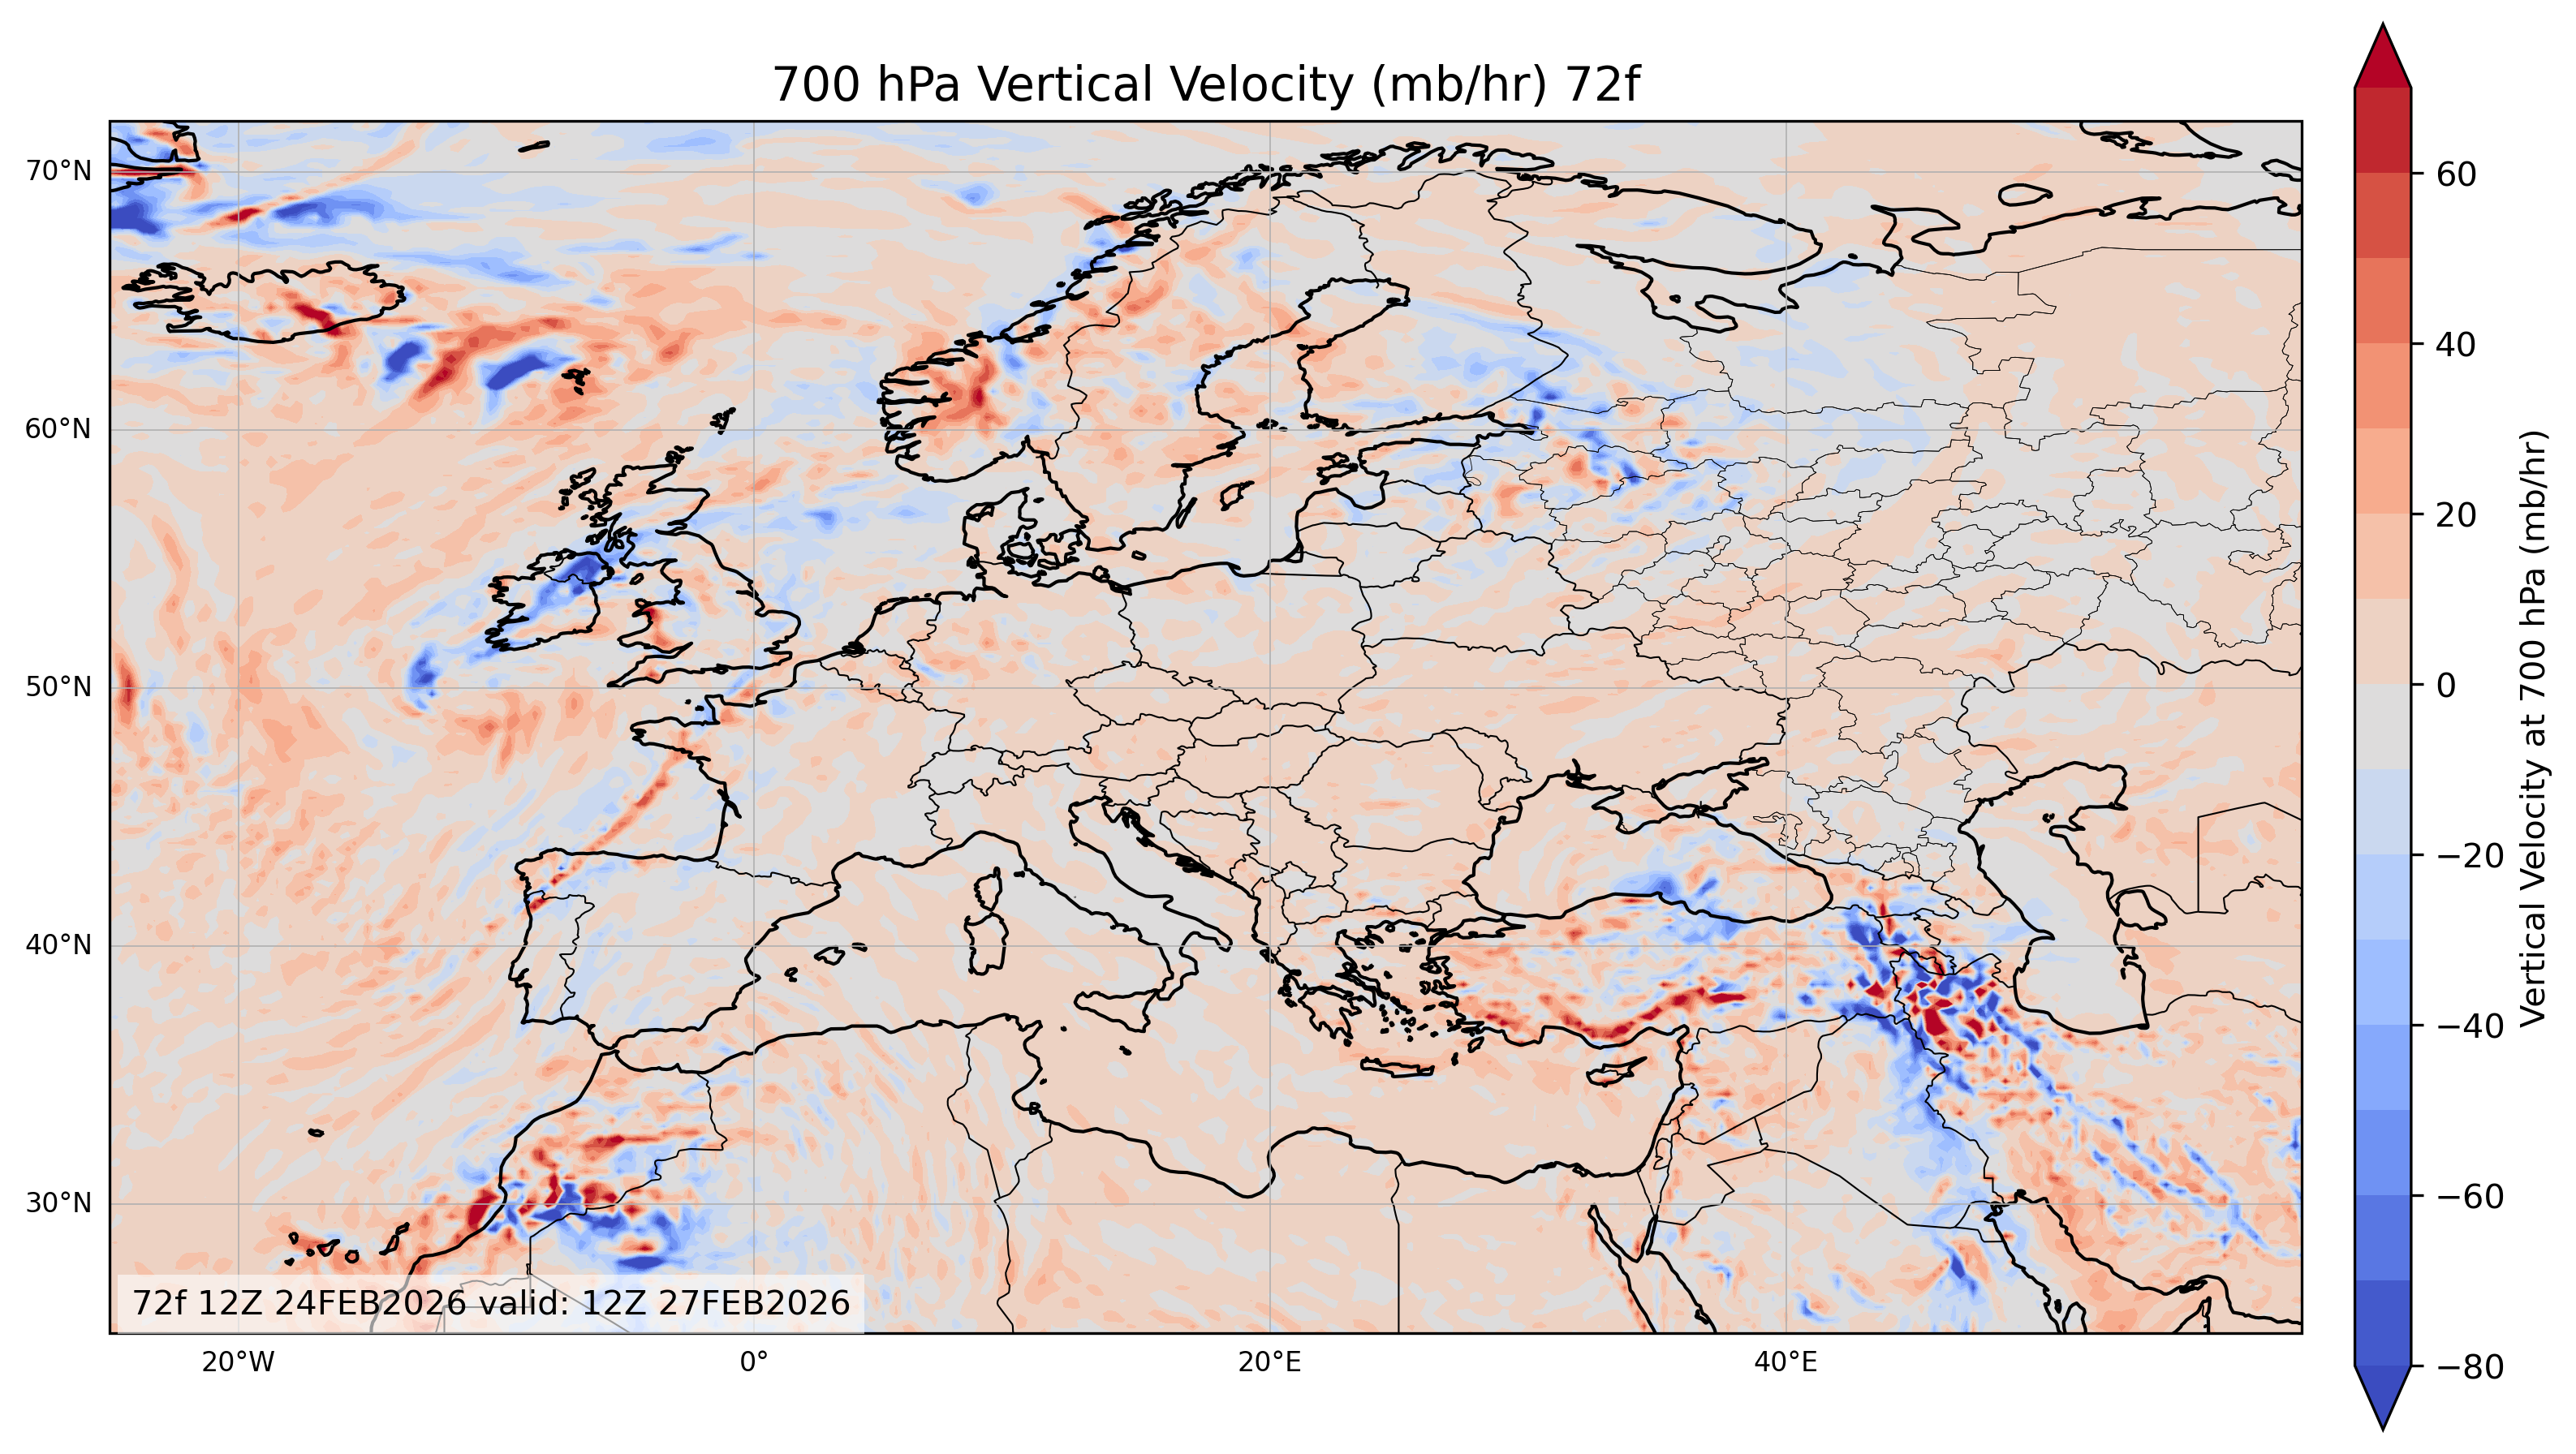
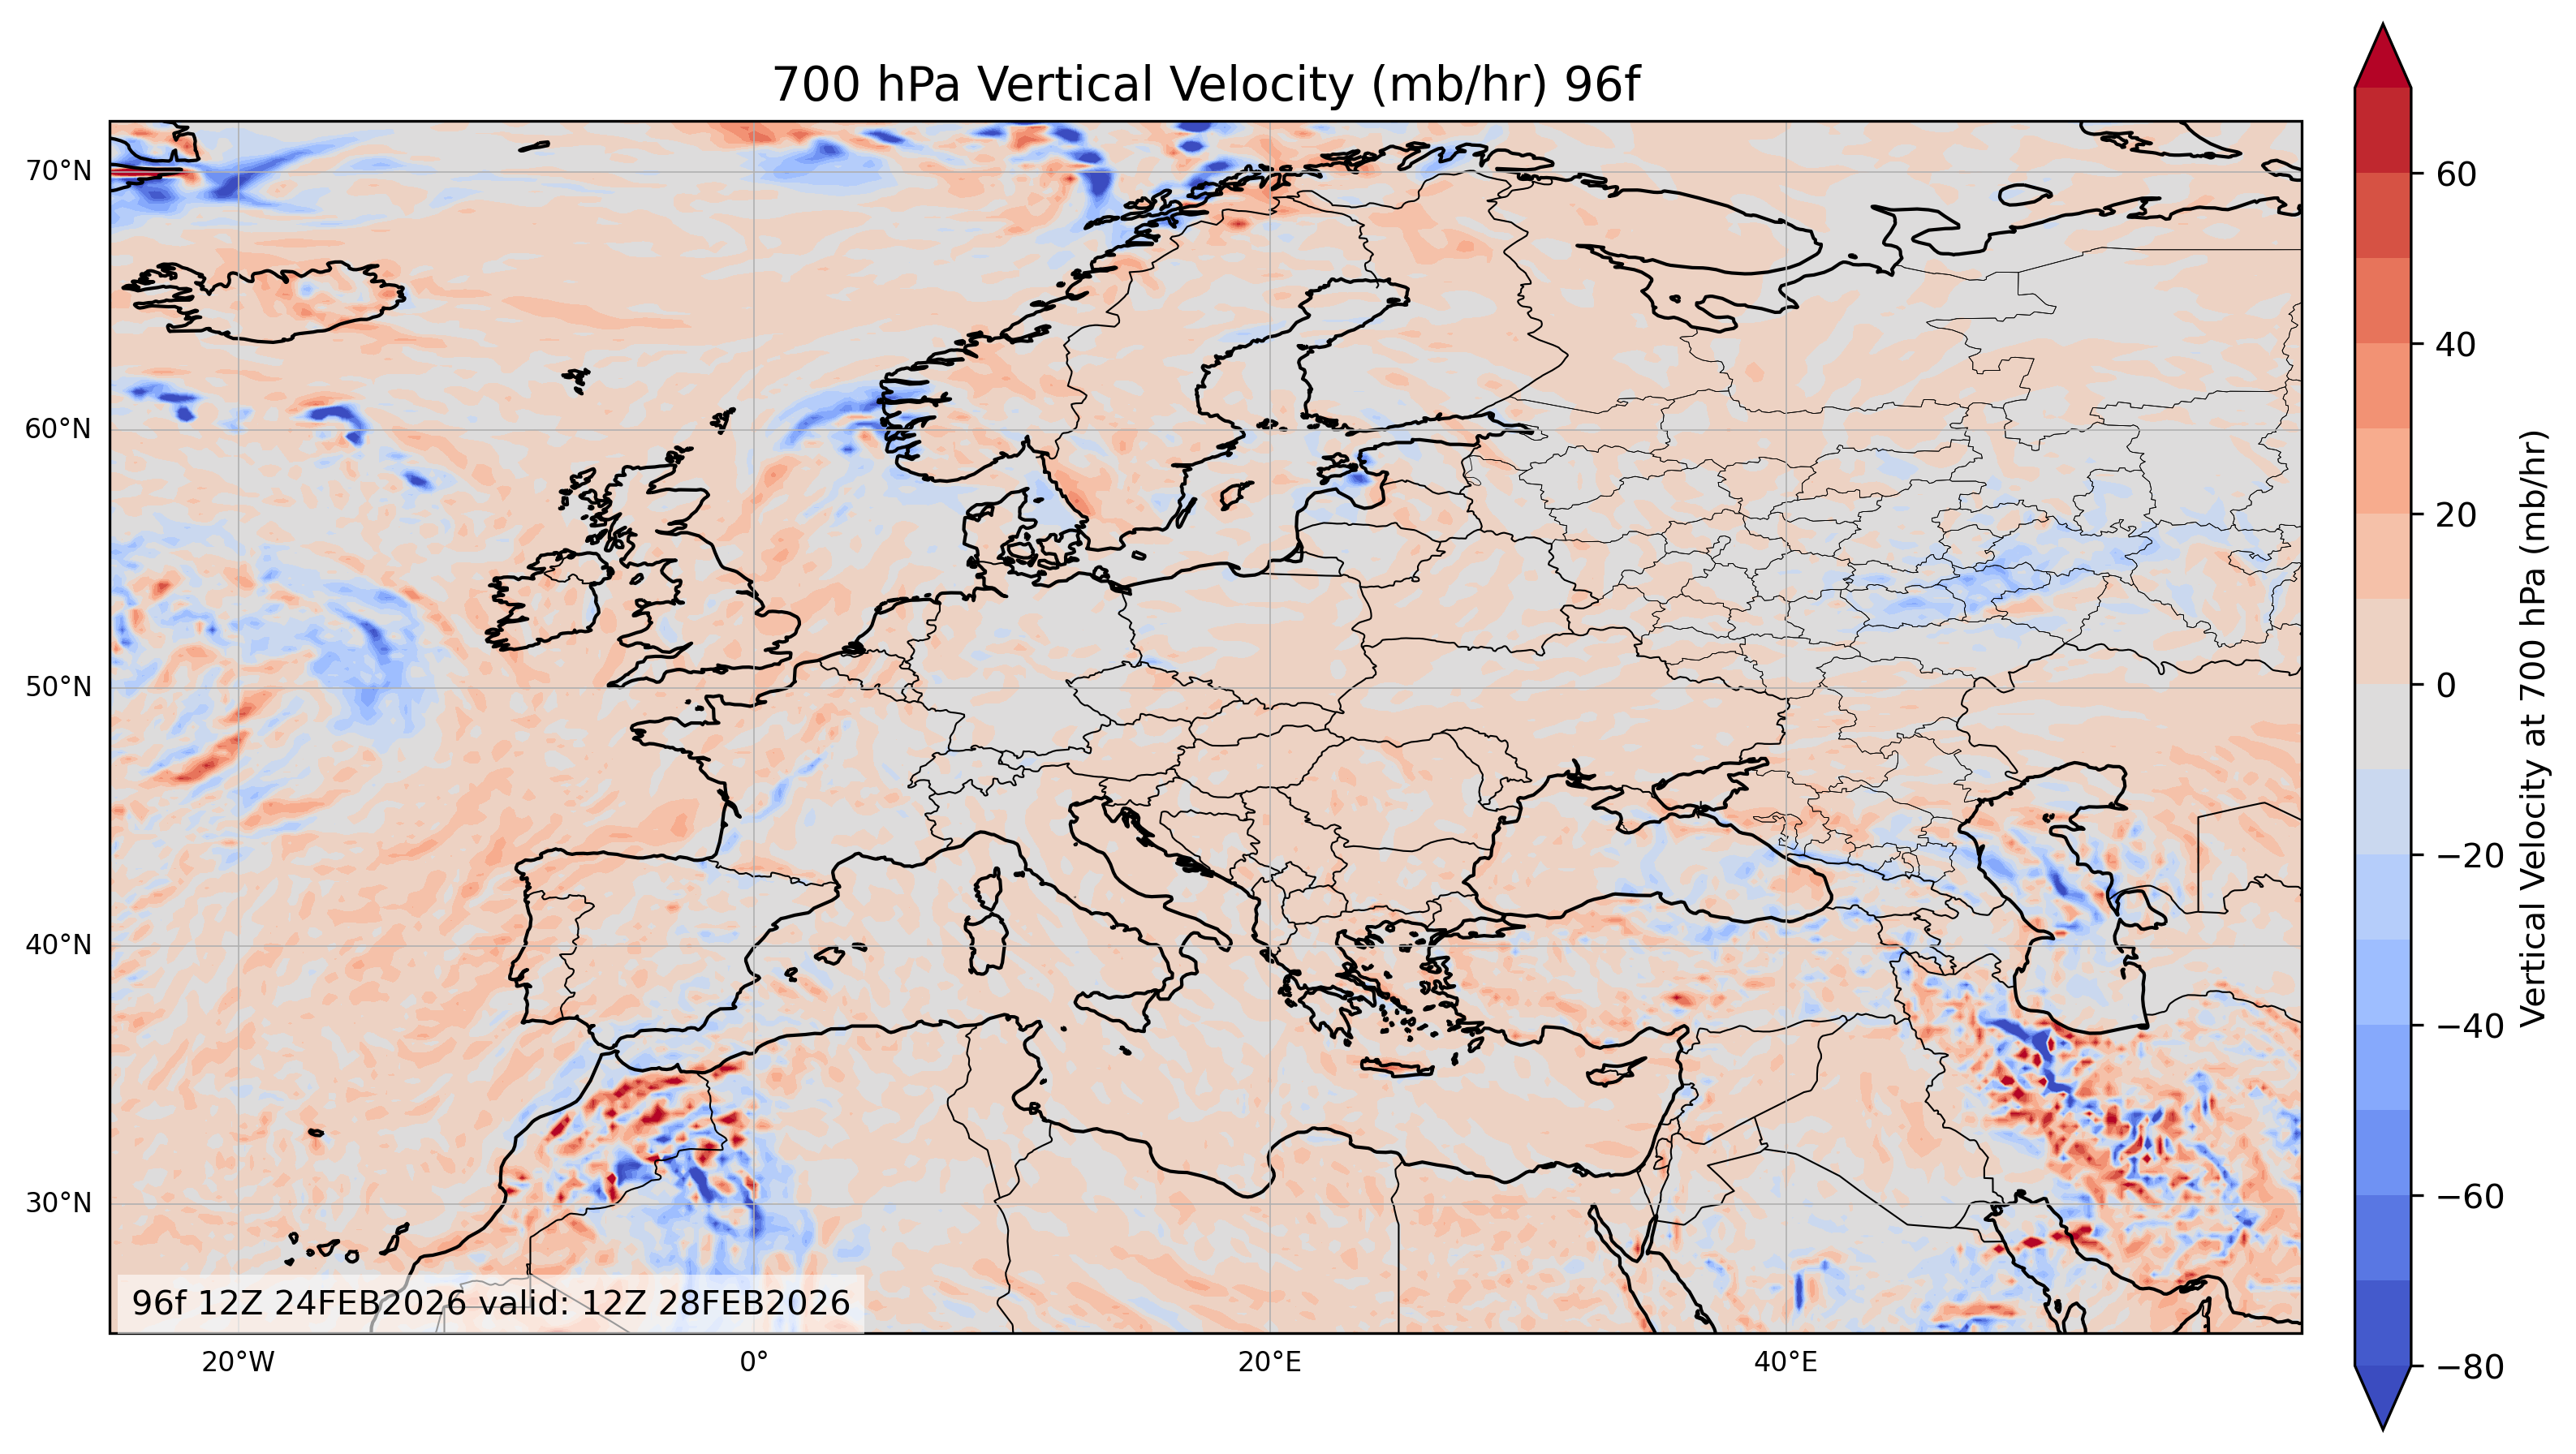
These charts display vertical velocity (Omega) at the 700 mb (or 700 hPa) level, approximately 3,000 meters above the surface. To interpret them correctly, you must understand the relationship between the colors, vertical motion, and vorticity.
1. Blue Areas (Negative Values)
The blue zones on the map represent negative vertical velocity.
- The Physics: In meteorology, negative Omega means the air is rising (uplift).
- Vorticity Connection: These areas are strongly linked to Positive Vorticity Advection. When positive vorticity creates lift in the atmosphere, it generates the blue signatures you see here.
- Weather Result: Expect clouds, rain, and instability in these zones.
2. Red Areas (Positive Values)
The red and orange zones represent positive vertical velocity.
- The Physics: Positive Omega means the air is sinking (subsidence).
- Weather Result: Sinking air warms up and dries out. Consequently, these areas typically indicate stable weather, high pressure, and clear skies.
Available Timeframes: Analysis and Forecast
Our platform provides the full suite of Vertical Velocity data to help you track weather systems over time.
The 00 Analysis (Current State)
The “00” chart represents the initialization of the model. It shows the current “ground truth” of the atmosphere. Use this to understand the weather happening right now.
The 24, 48, and 72-Hour Forecasts
To predict future weather, we offer:
- 24-Hour Forecast: Ideal for short-term planning for tomorrow.
- 48-Hour Forecast: Shows the outlook for two days ahead.
- 72-Hour Forecast: Essential for medium-range forecasting, helping you spot developing troughs or ridges three days in advance.
Conclusion: Euro 700 mb Vertical Velocity
In summary, monitoring the Euro 700 mb Vertical Velocity charts gives you a complete 3D view of the atmosphere. By tracking the movement of blue uplift zones (linked to positive vorticity) and red subsidence zones from the 00 analysis through to the 72-hour forecast, you can master European weather prediction.