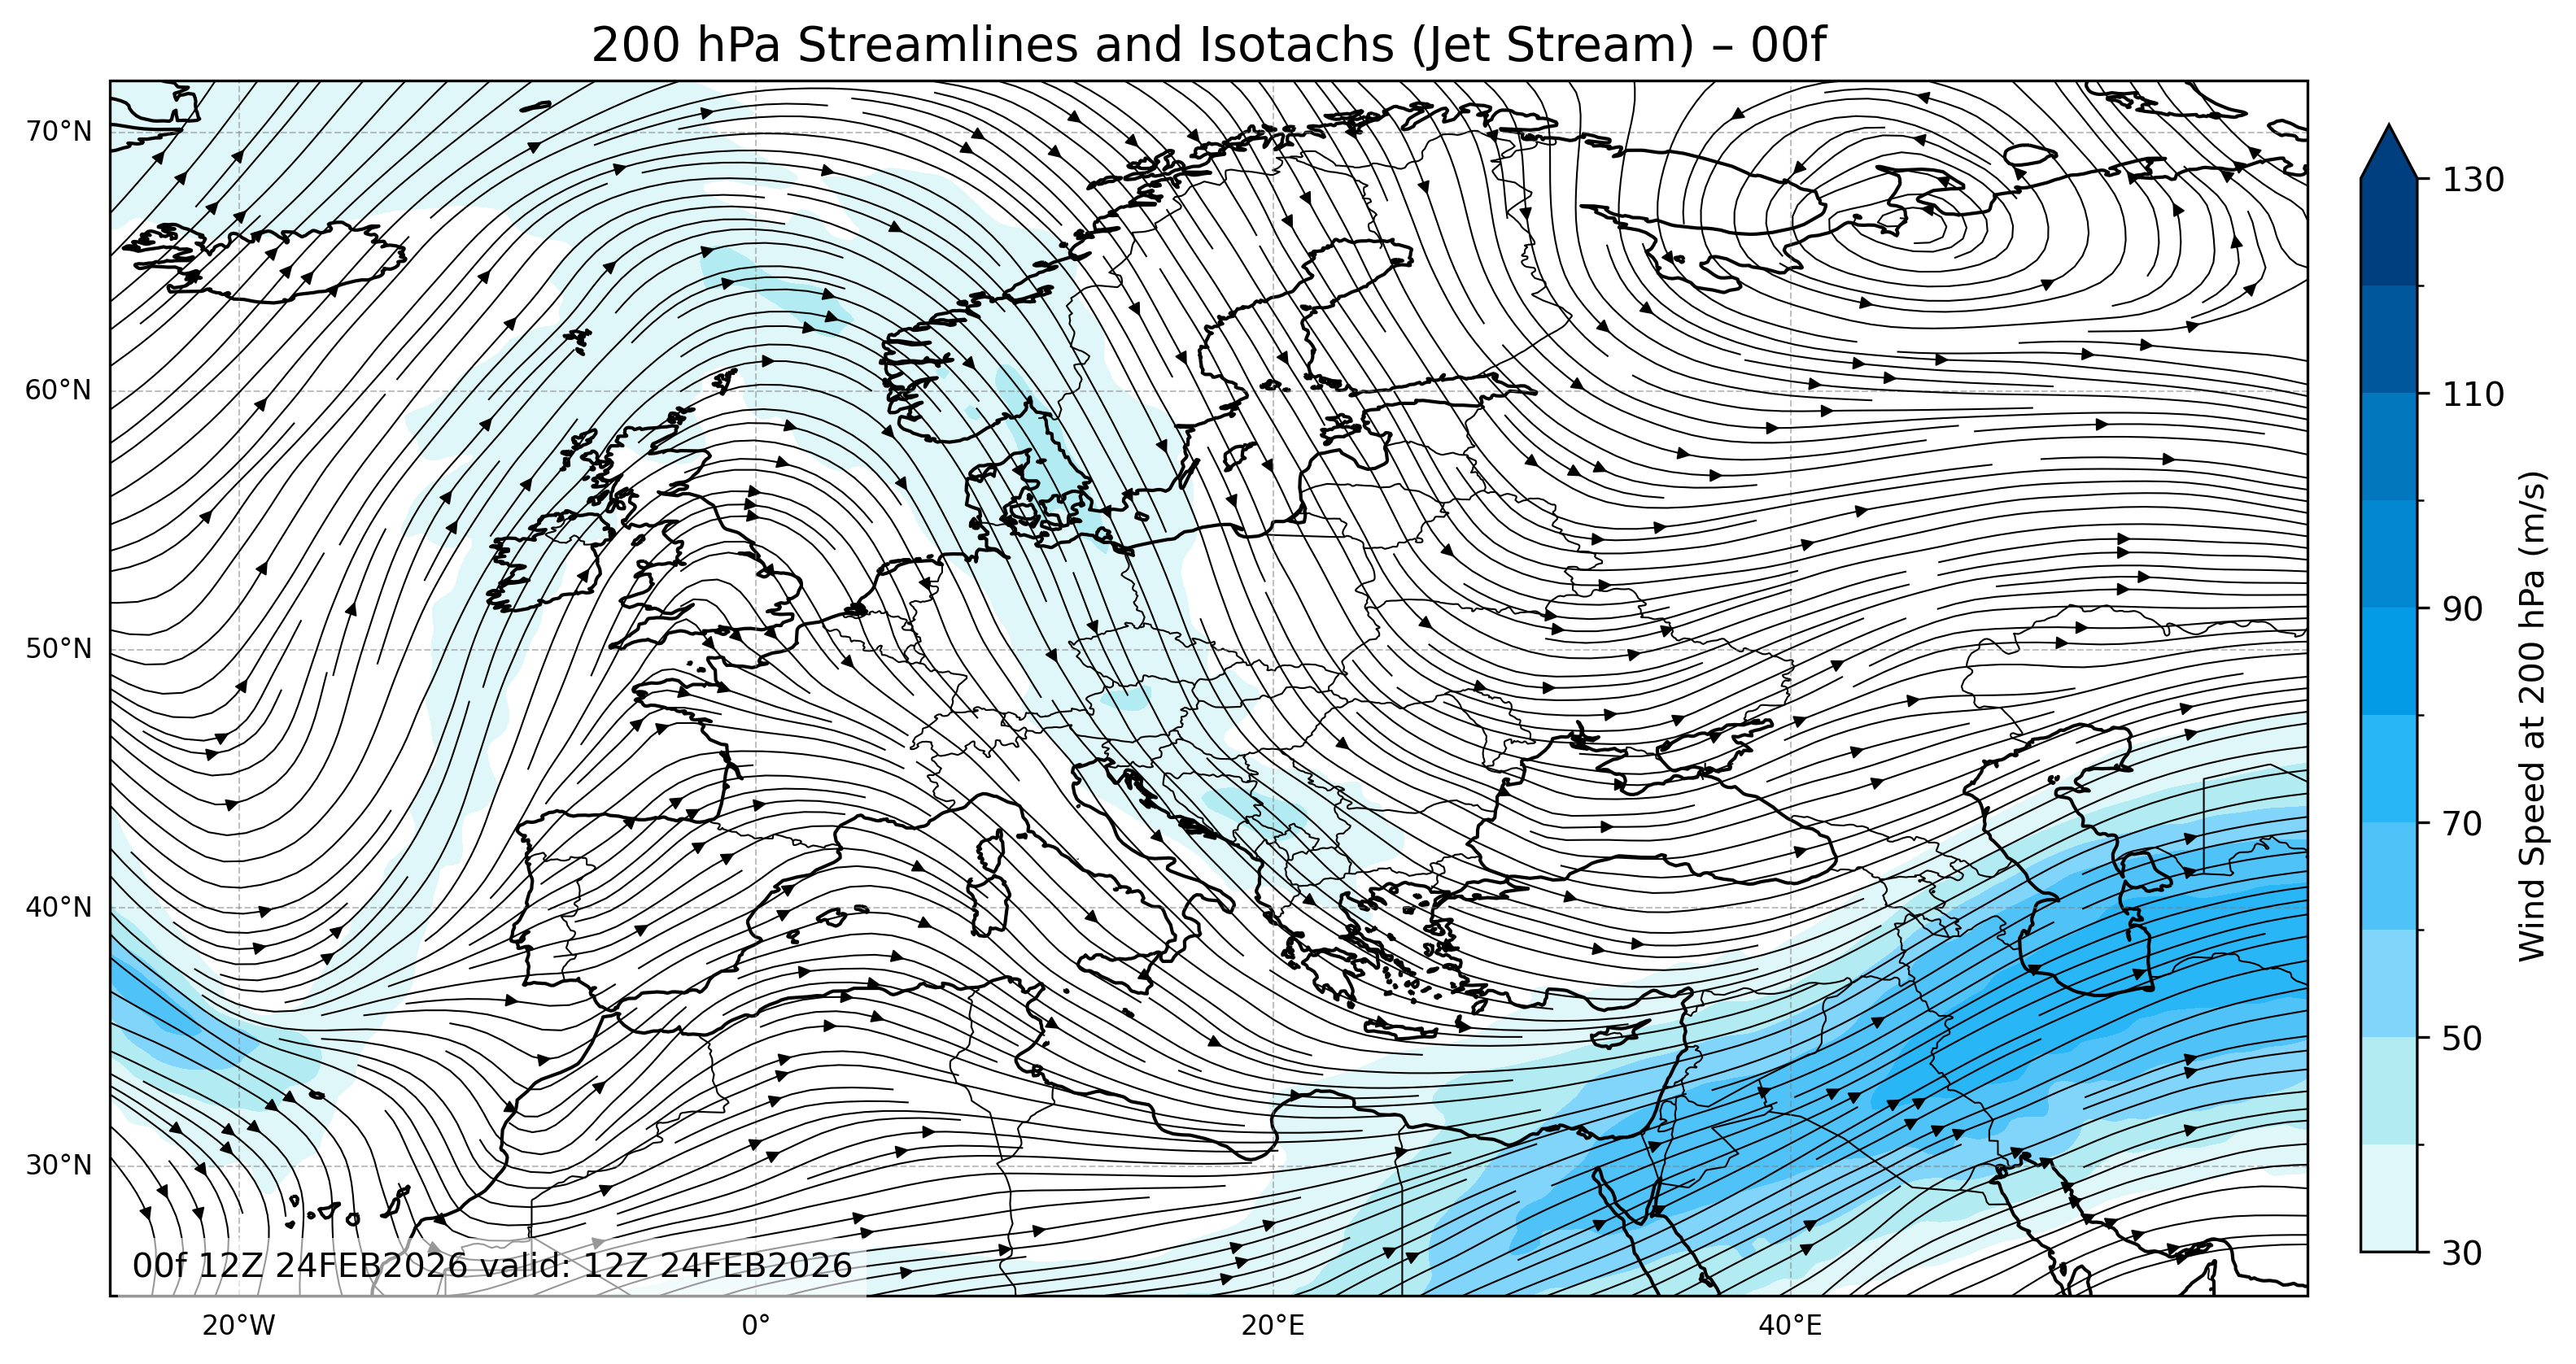
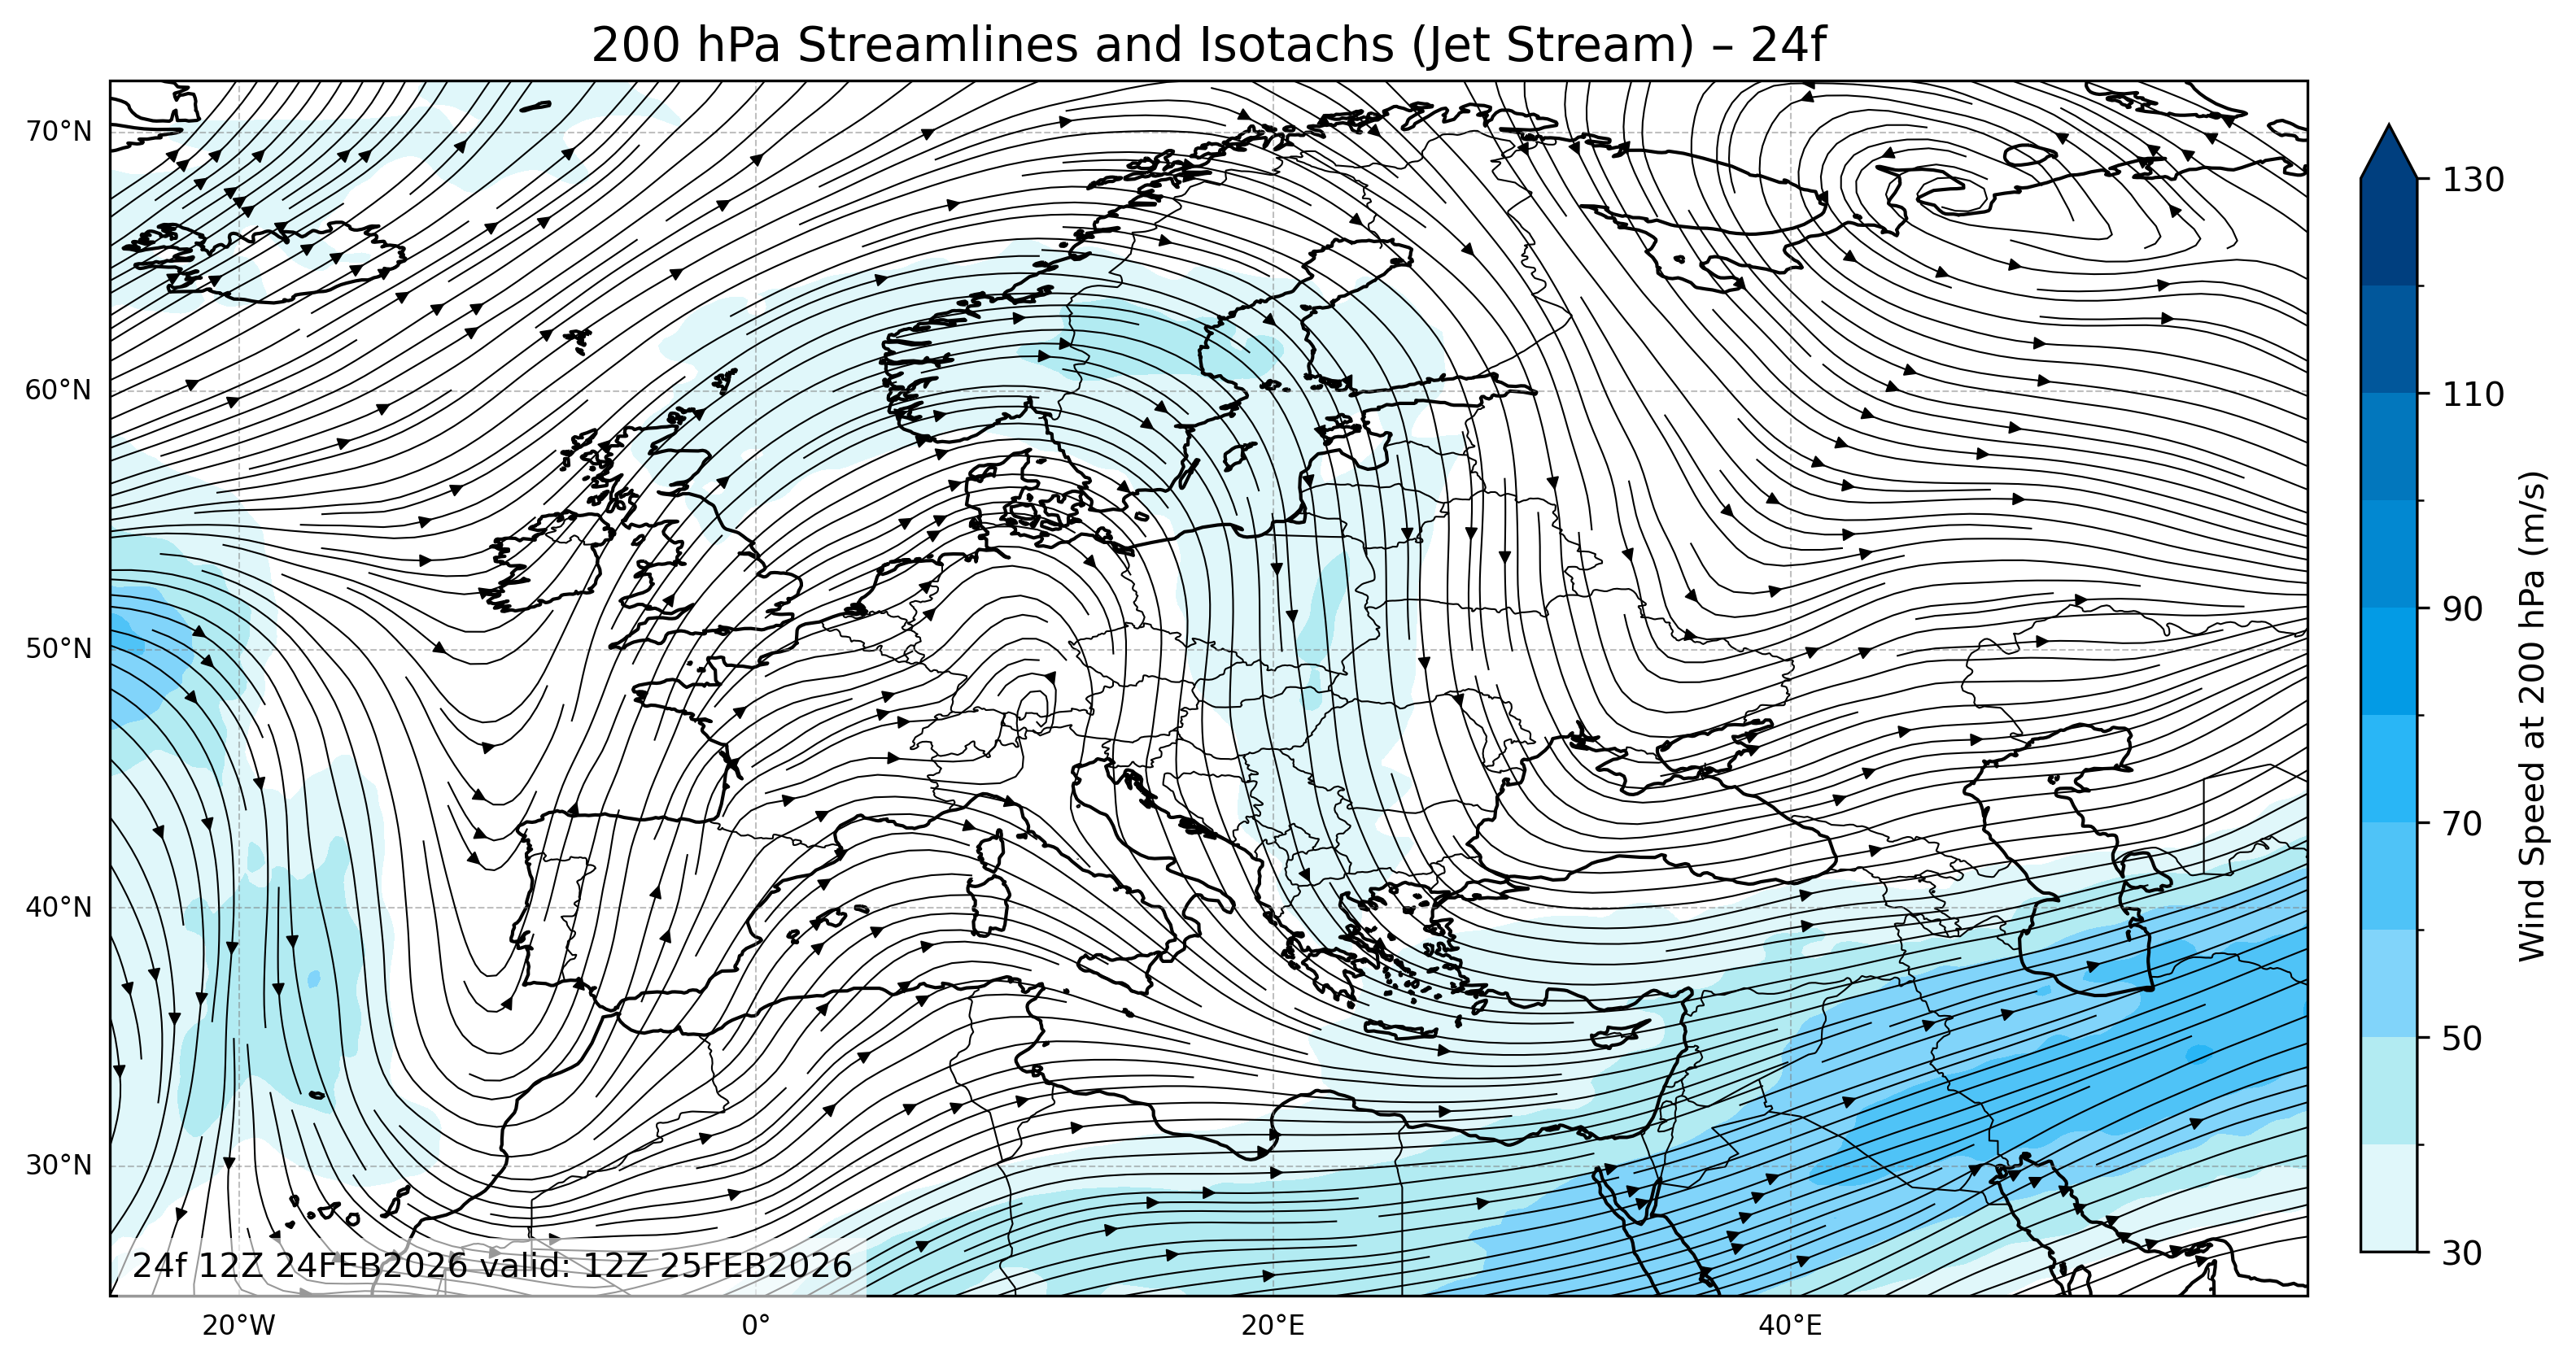
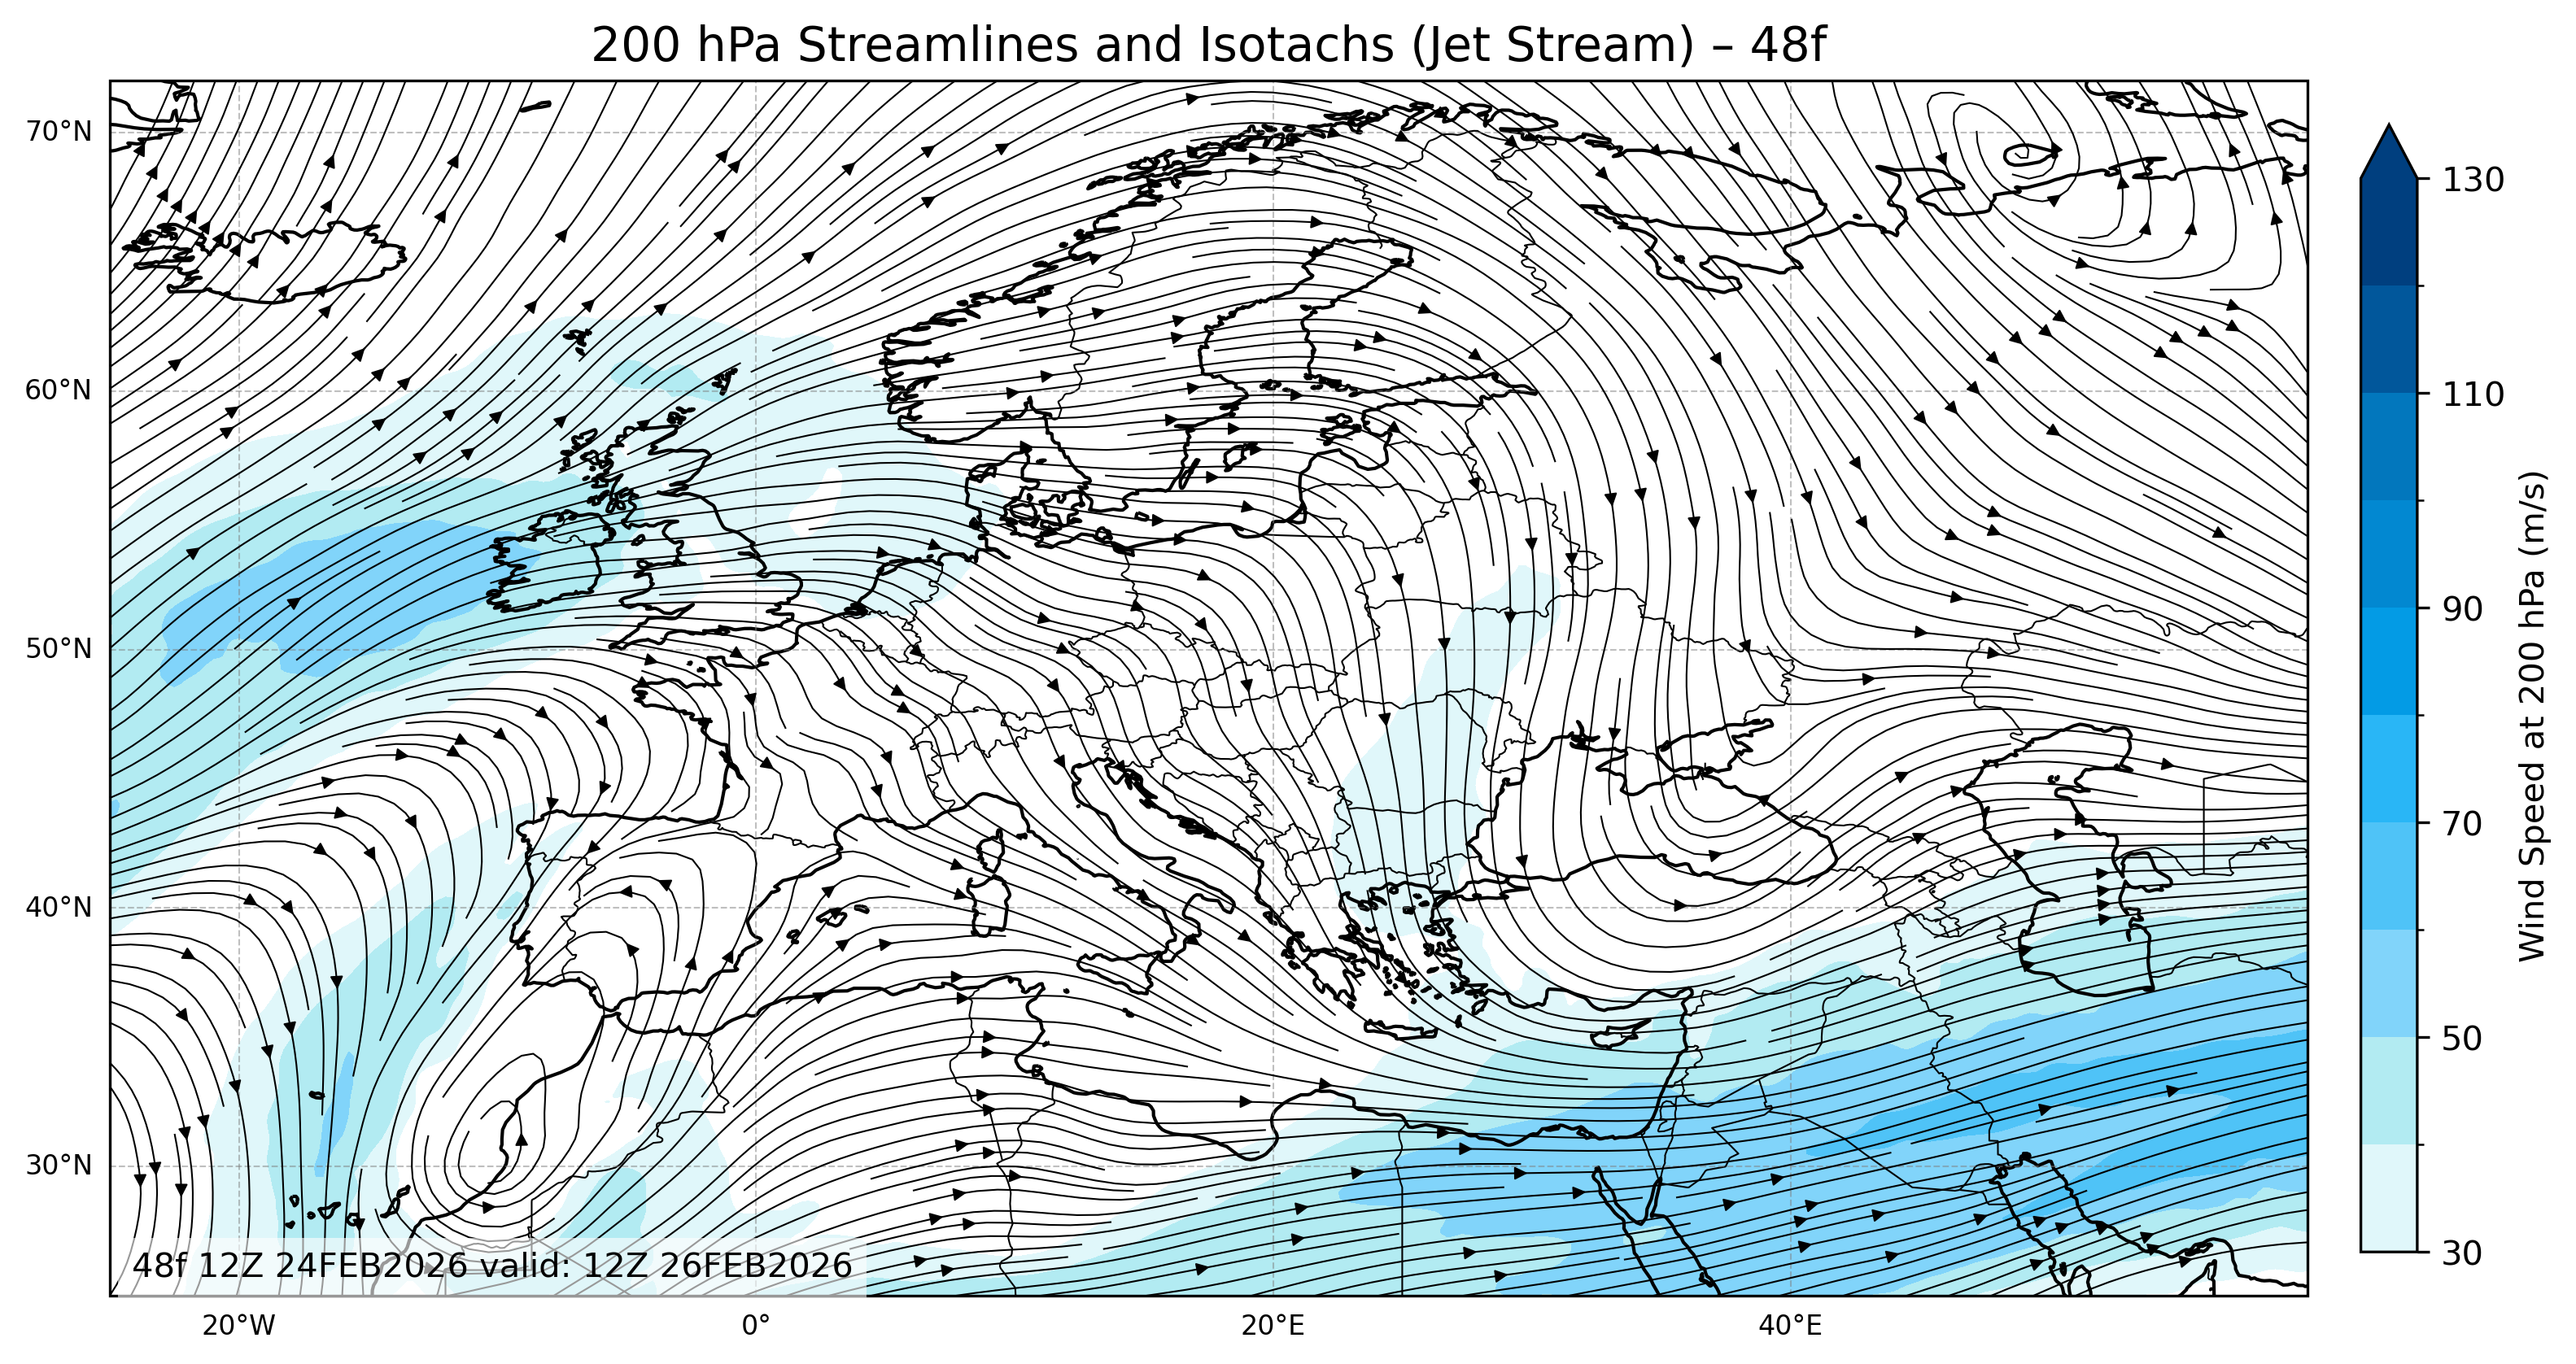
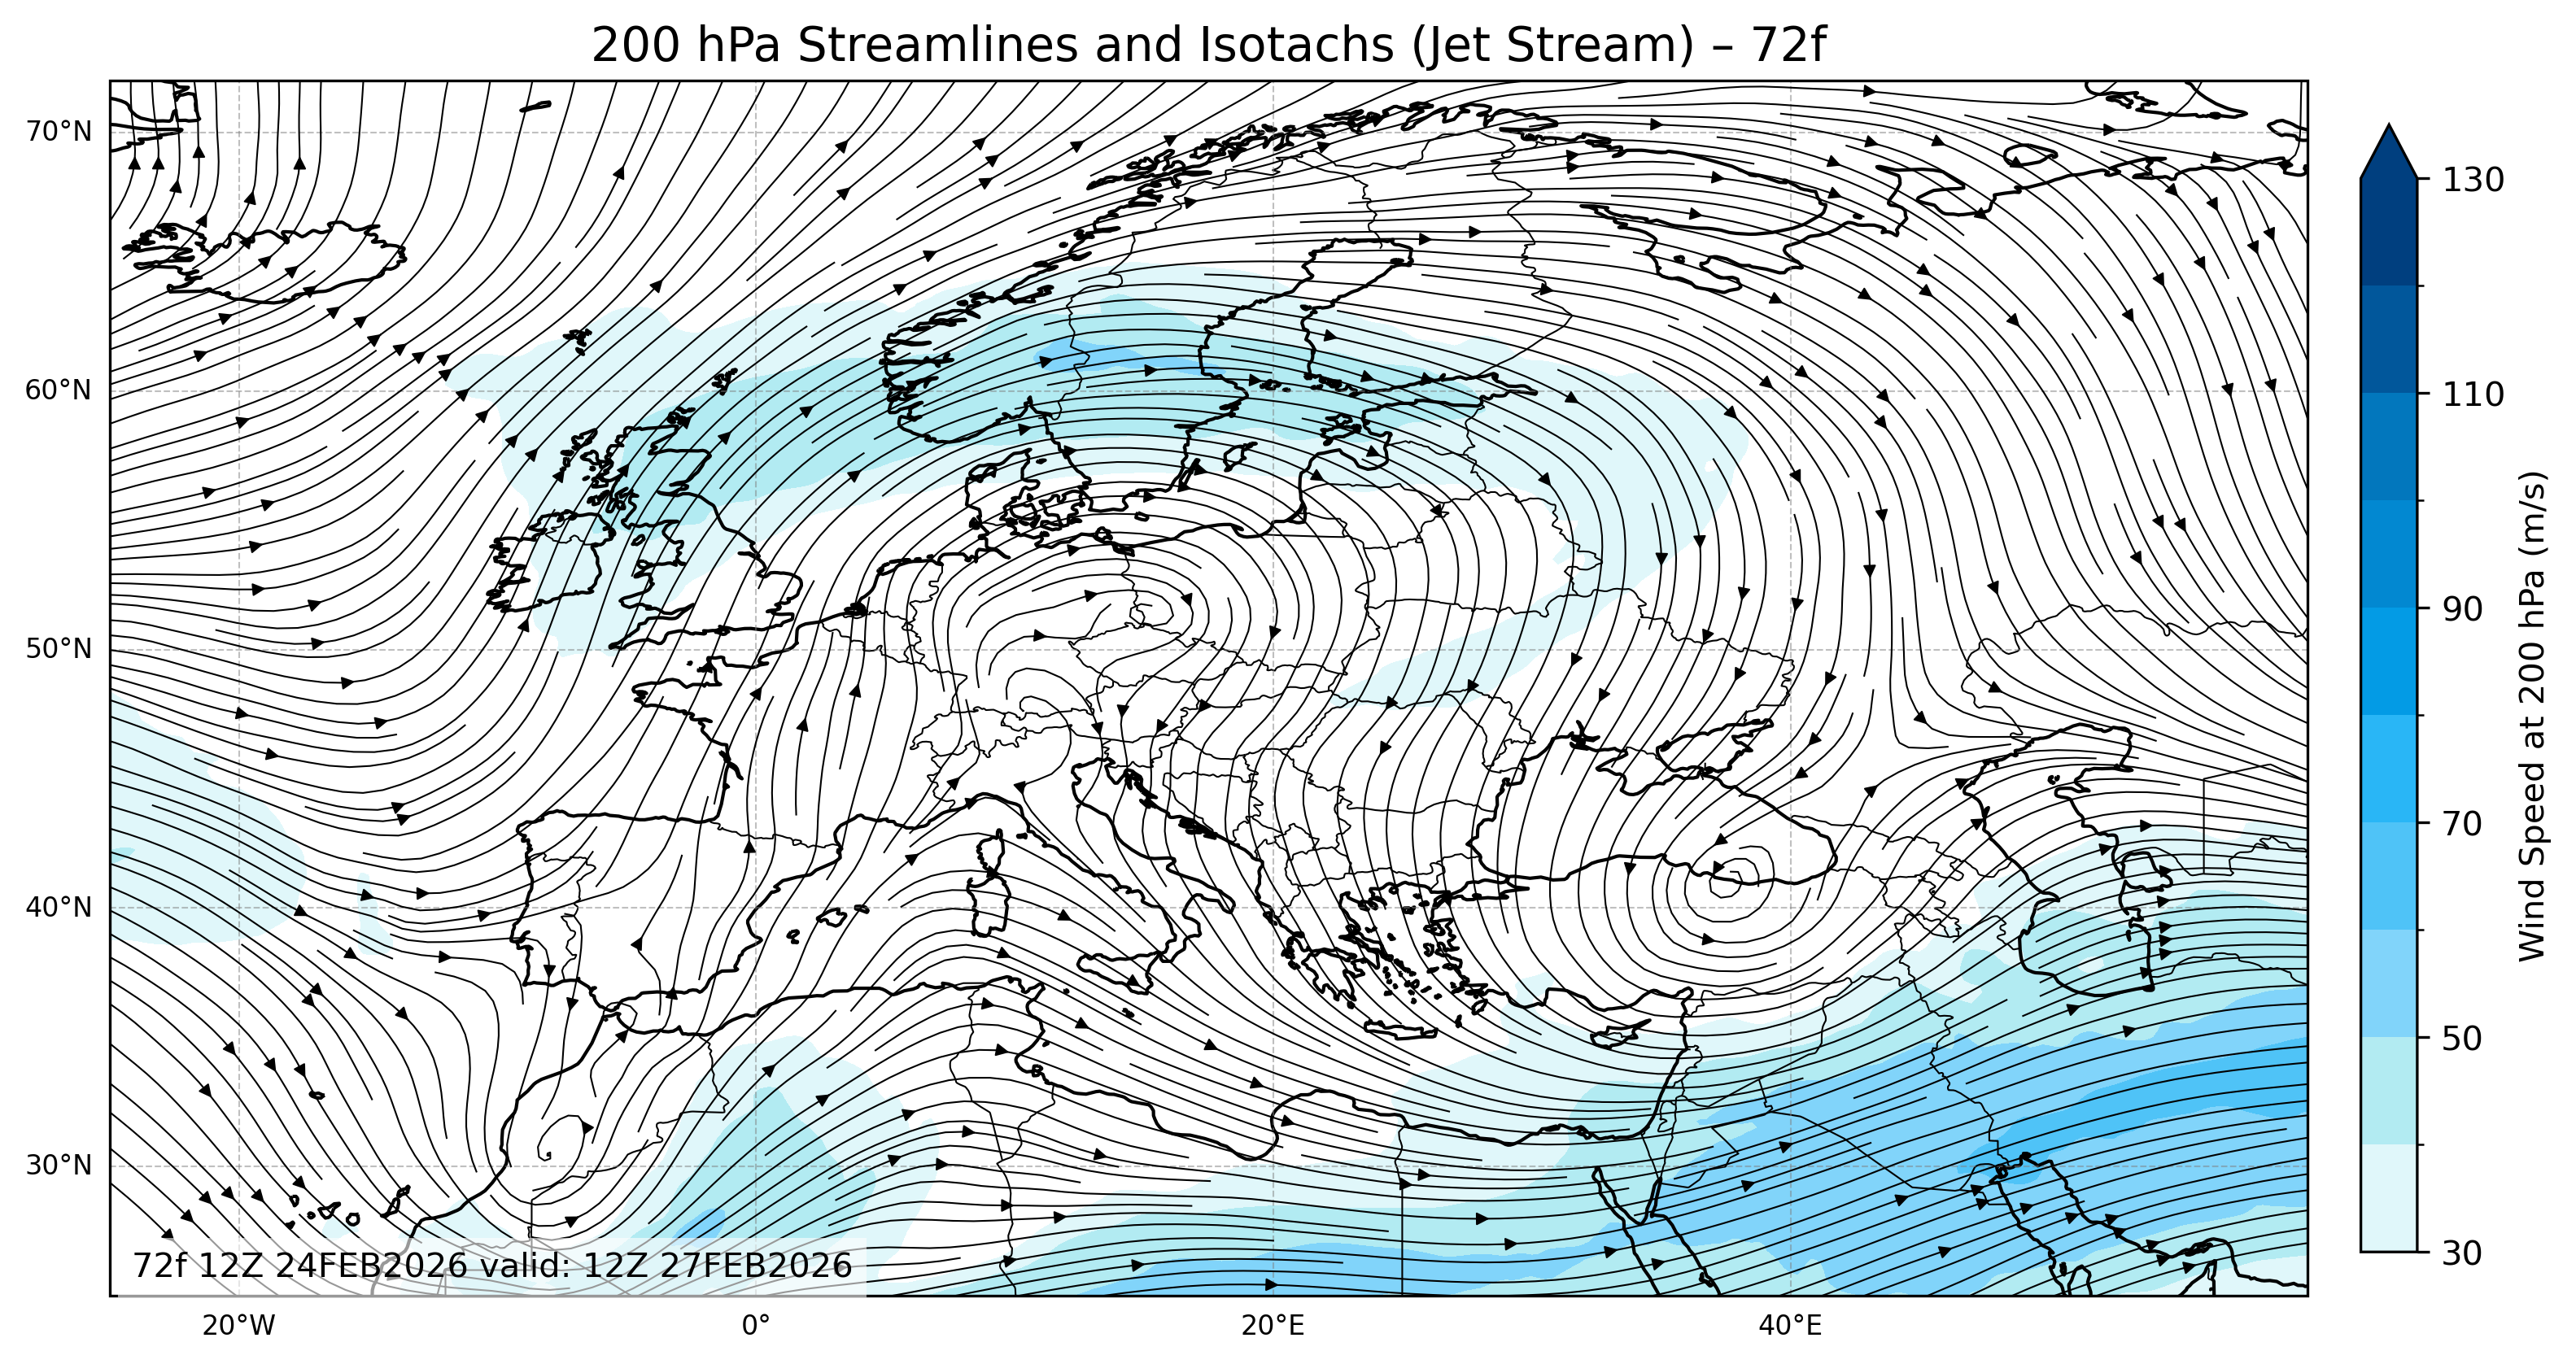
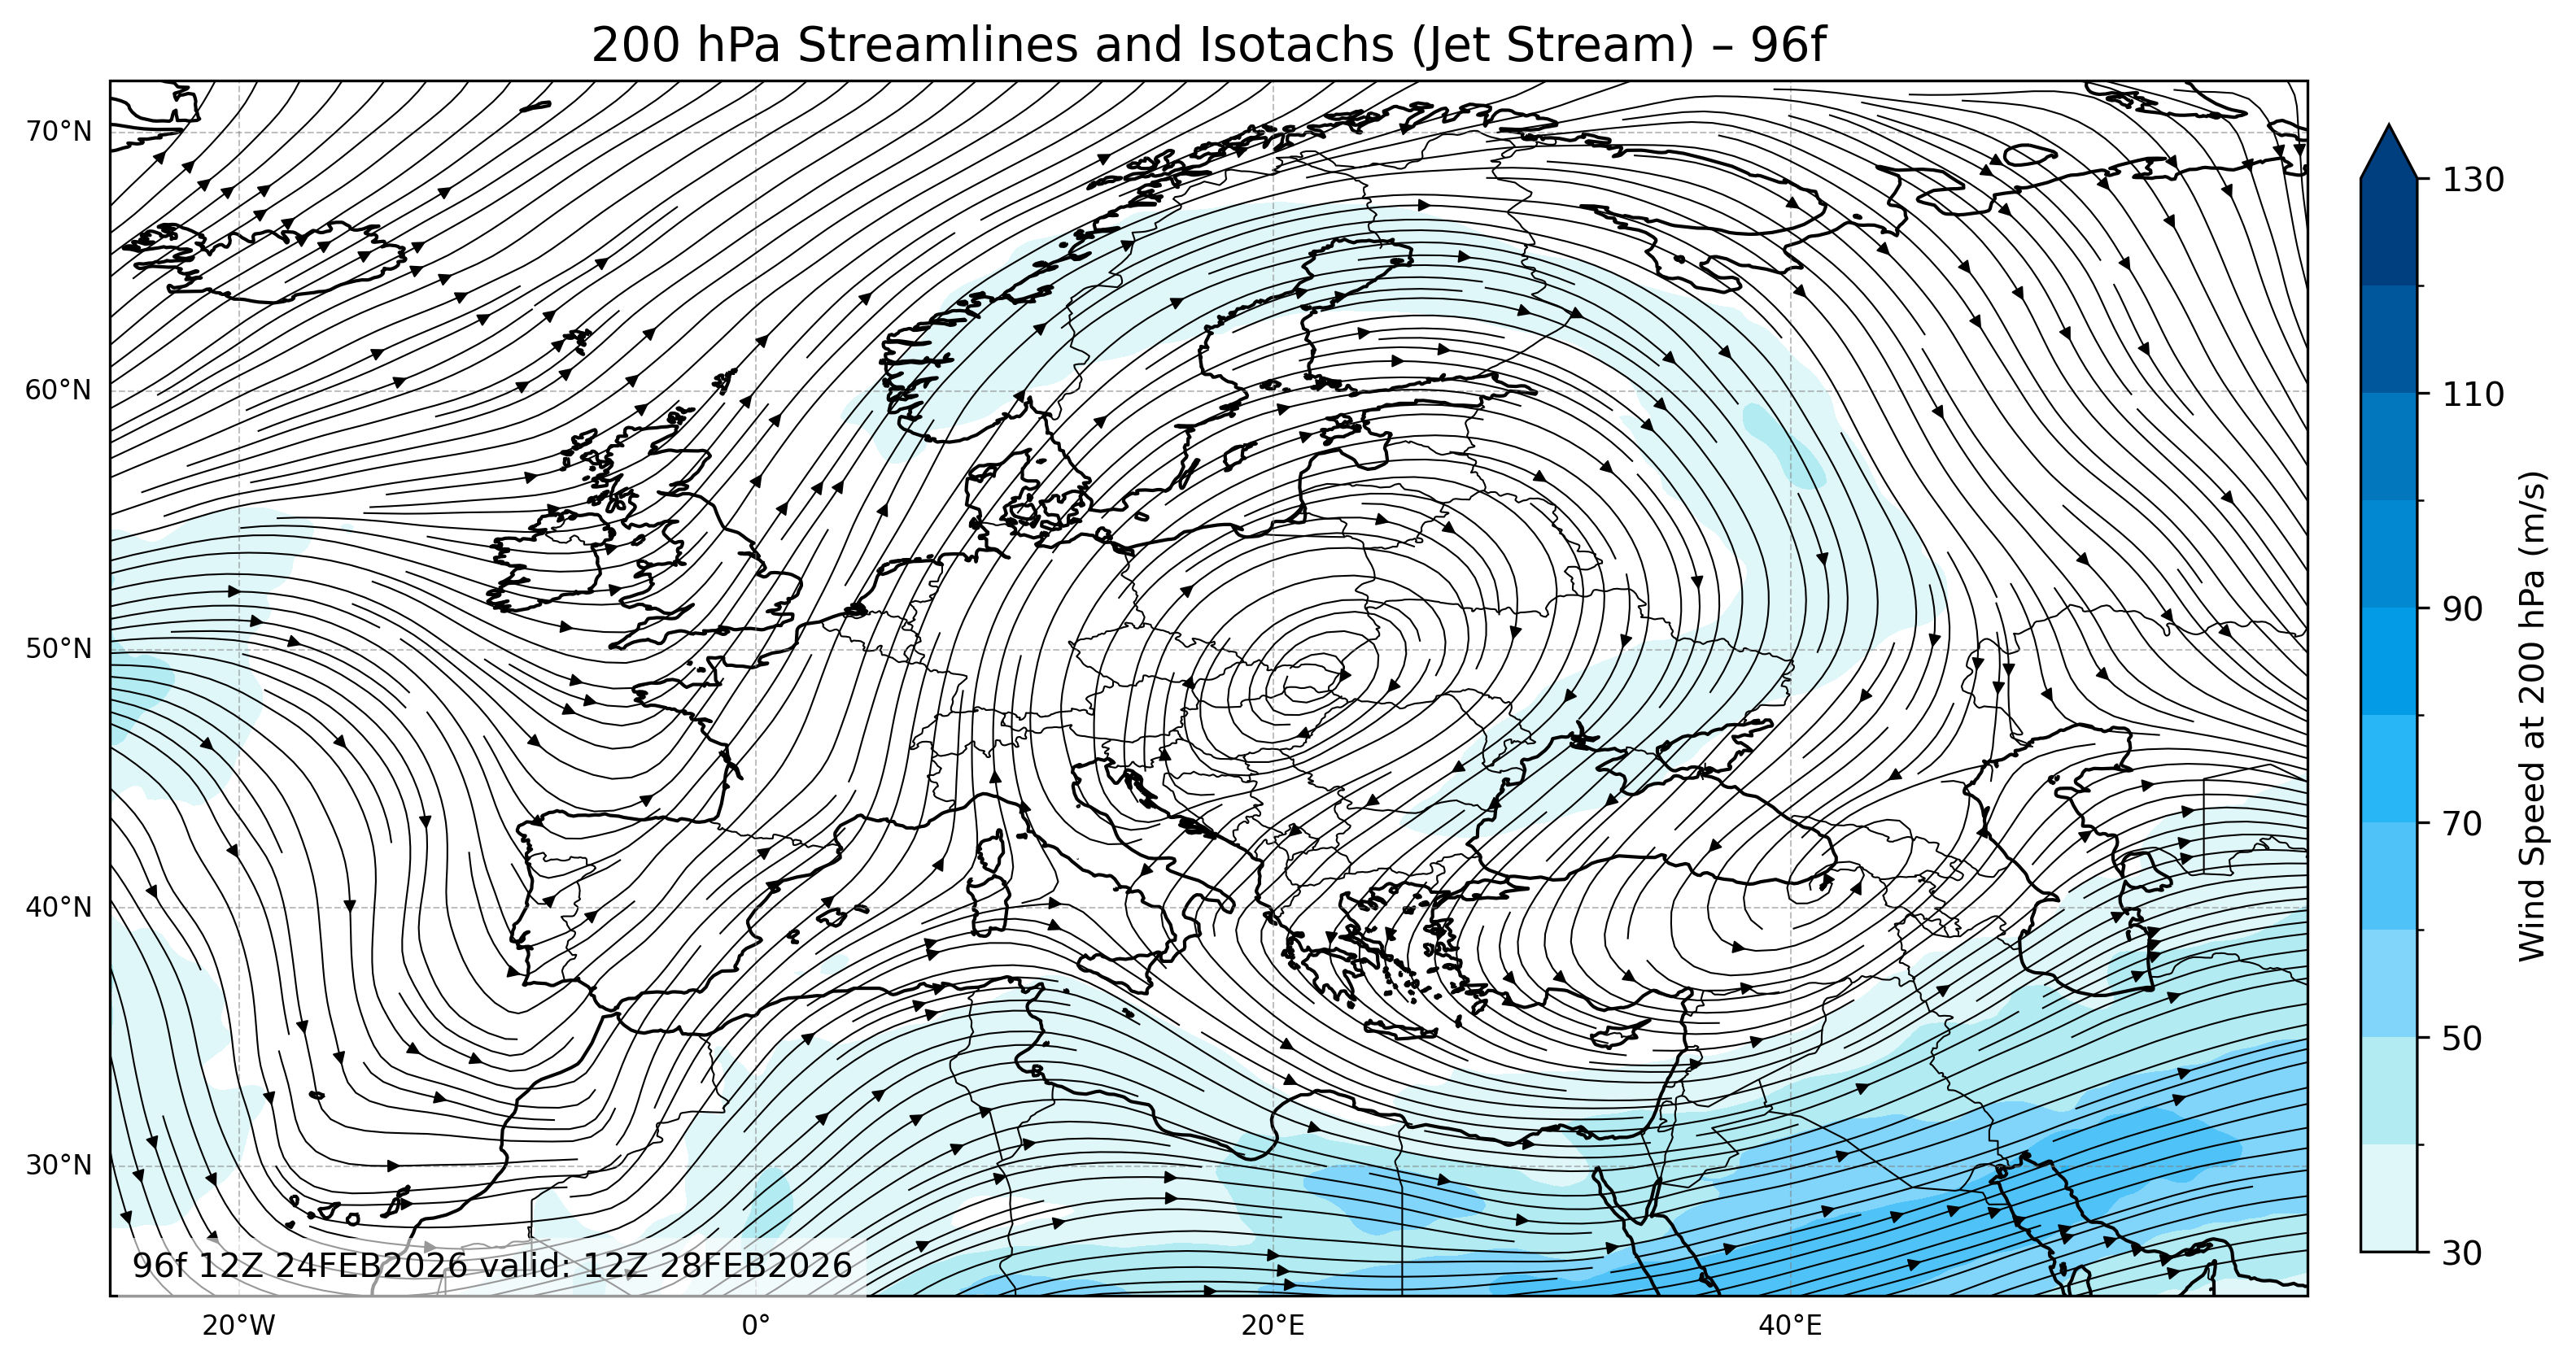
Understanding atmospheric motion at high altitudes is essential for forecasting weather systems, studying climate dynamics, and analyzing jet stream patterns. The Euro 200mb Streamlines Isotachs charts offer one of the most detailed perspectives of the upper troposphere over Europe, allowing meteorologists, aviation experts, and researchers to visualize how strong upper-level winds evolve across time.
These maps display the 200 millibar (mb) pressure surface, located roughly 11–12 kilometers above sea level. At this altitude, commercial jets typically cruise, and it is also where jet streams, tropical–extratropical interactions, and upper-level divergence occur — all of which strongly influence surface weather conditions.
What Are Euro 200mb Streamlines Isotachs?
The Euro 200mb Streamlines Isotachs maps combine two types of upper-air meteorological data:
- Streamlines: These lines illustrate the direction of wind flow at the 200mb level. Each streamline represents the instantaneous flow of air, showing how winds move around high-pressure ridges and low-pressure troughs in the upper atmosphere.
- Isotachs: These are contours connecting points of equal wind speed. They help identify the intensity of winds and the exact position of jet cores — areas where wind speeds are at their maximum, often exceeding 60–80 meters per second.
Together, streamlines and isotachs provide a powerful visualization of upper-level circulation, highlighting regions of convergence and divergence that play key roles in storm development, cyclone intensification, and large-scale weather movement across Europe.
Importance of the 200mb Level in Meteorology
The 200mb level lies near the top of the troposphere, where air pressure is approximately one-fifth of that at the surface. This layer is crucial for:
- Jet Stream Analysis: The strongest jet streams typically occur between 250mb and 150mb levels. The 200mb layer captures these fast-moving wind corridors with excellent clarity.
- Weather Prediction: Divergence at the 200mb level often indicates rising motion below, leading to surface low-pressure development.
- Aviation Forecasting: Pilots rely on 200mb wind data to optimize flight routes, reduce fuel consumption, and avoid turbulence zones.
- Climate Research: Long-term 200mb wind changes reveal shifts in global circulation, including the North Atlantic Oscillation and Arctic jet.
Thus, the Euro 200mb Streamlines Isotachs data provide a bridge between theoretical meteorology and real-time operational forecasting.
Time Steps: 00, 24, 48, and 72-Hour Forecasts
The charts on this website display 00, 24, 48, and 72-hour forecast intervals, allowing users to observe the dynamic evolution of the upper-level flow pattern over Europe.
- 00-Hour (Analysis Map): Represents current atmospheric conditions derived from global model assimilation. It serves as the starting point for all forecast projections.
- 24-Hour Forecast: Shows how the jet stream and isotach patterns are expected to shift within the next day, providing short-range forecast insight.
- 48-Hour Forecast: Useful for identifying the medium-term development of troughs, ridges, and upper-level divergence zones.
- 72-Hour Forecast: Offers a broader look at potential weather trends, helping forecasters anticipate significant jet stream changes and storm tracks across Europe.
By comparing these maps, meteorologists can pinpoint how the 200mb wind field evolves, where jet streaks strengthen or weaken, and how upper-level support for cyclogenesis changes over time.
How to Interpret Euro 200mb Streamlines Isotachs Maps
- Identify Jet Stream Cores:
Look for tightly packed isotachs with high wind speeds (often color-shaded). These indicate jet maxima — the “engines” driving large-scale weather systems. - Analyze Wind Direction:
Streamlines show the path of air flow. A west-to-east flow shows a strong zonal pattern. Wave-like patterns indicate ridges and troughs with unstable weather. - Spot Divergence and Convergence Zones:
Where streamlines spread apart, upper-level divergence promotes upward motion and storm development below. Where they converge, subsidence and stable conditions prevail. - Link with Surface Systems:
Comparing 200mb maps with surface pressure charts shows how jet streams guide cyclones and anticyclones over Europe.
Meteorological Applications
The Euro 200mb Streamlines Isotachs maps are invaluable tools for multiple meteorological purposes:
- Forecasting Cyclogenesis:
Areas of strong divergence aloft often correspond to deepening surface lows, especially when coupled with positive vorticity advection. - Aviation Meteorology:
Pilots and route planners use these charts to avoid turbulence near jet streaks and to optimize flight efficiency using tailwinds. - Severe Weather Assessment:
Enhanced upper-level winds can intensify thunderstorms by providing ventilation and promoting updraft organization. - Climate and Synoptic Studies:
Long-term 200mb analyses track jet stream shifts, stratospheric intrusions, and blocking patterns that shape Europe’s climate.
Jet Stream Dynamics Over Europe
At the 200mb level, the Polar Jet Stream and occasionally the Subtropical Jet Stream dominate the European weather regime.
- In winter, the polar jet strengthens and shifts southward, enhancing storm activity over Western and Central Europe.
- During summer, the subtropical jet often becomes more prominent, affecting the Mediterranean and southeastern regions.
The Euro 200mb Streamlines Isotachs charts clearly capture these seasonal variations, allowing forecasters to analyze transitions in atmospheric energy and identify potential regions of dynamic instability.
Technical Background: Data Sources and Modeling
The data used for the Euro 200mb Streamlines Isotachs visualizations typically originate from numerical weather prediction (NWP) models such as the GFS (Global Forecast System) or ECMWF.
Each dataset includes three-dimensional wind fields (u and v components), which are interpolated onto the 200mb surface and processed to compute isotachs and streamline patterns.
This scientific approach ensures the most accurate representation of upper-level wind fields, combining physics-based modeling with real-time atmospheric observations from radiosondes, satellites, and aircraft.
Why Euro 200mb Streamlines Isotachs Matter for Forecasting
Analyzing the Euro 200mb Streamlines Isotachs provides crucial insight into how the atmosphere behaves above the weather systems we observe on the ground. These charts help to:
- Predict storm intensification and jet streak interactions
- Understand synoptic-scale flow evolution
- Detect potential turbulence zones for aviation safety
- Support long-range forecasts and climate diagnostics
Operational forecasters, research centers, and universities in Europe use these charts to study upper-air dynamics.
Summary
The Euro 200mb Streamlines Isotachs charts show Europe’s upper-level wind environment. They display both wind direction and intensity using streamlines and isotachs. By studying 00, 24, 48, and 72-hour forecasts, users can track jet stream changes clearly. These charts also help reveal atmospheric divergence and upper-level dynamics that affect surface weather systems.
They are highly useful for meteorological research, flight planning, and general atmospheric analysis. The charts remain one of the most valuable tools for understanding Europe’s dynamic atmosphere.