For professional forecasting, looking at surface pressure is not enough. You must understand the dynamics of the upper atmosphere. The Euro 500 hPa Geopotential Height and Relative Vorticity 00 chart is one of the most sophisticated tools available for analyzing the current state of the atmosphere across Europe.
This guide will explain how to read this geopotential height map, interpret the colors representing relative vorticity, and understand the physics behind the weather.
What is Geopotential Height Meteorology?
Before analyzing the chart, we must answer a common question: what is geopotential height?
In simple terms, geopotential height represents the actual height of a pressure surface above mean sea level. On this specific map, we are looking at the 500 hPa geopotential height map. This pressure level typically sits around 5,500 meters (18,000 feet).
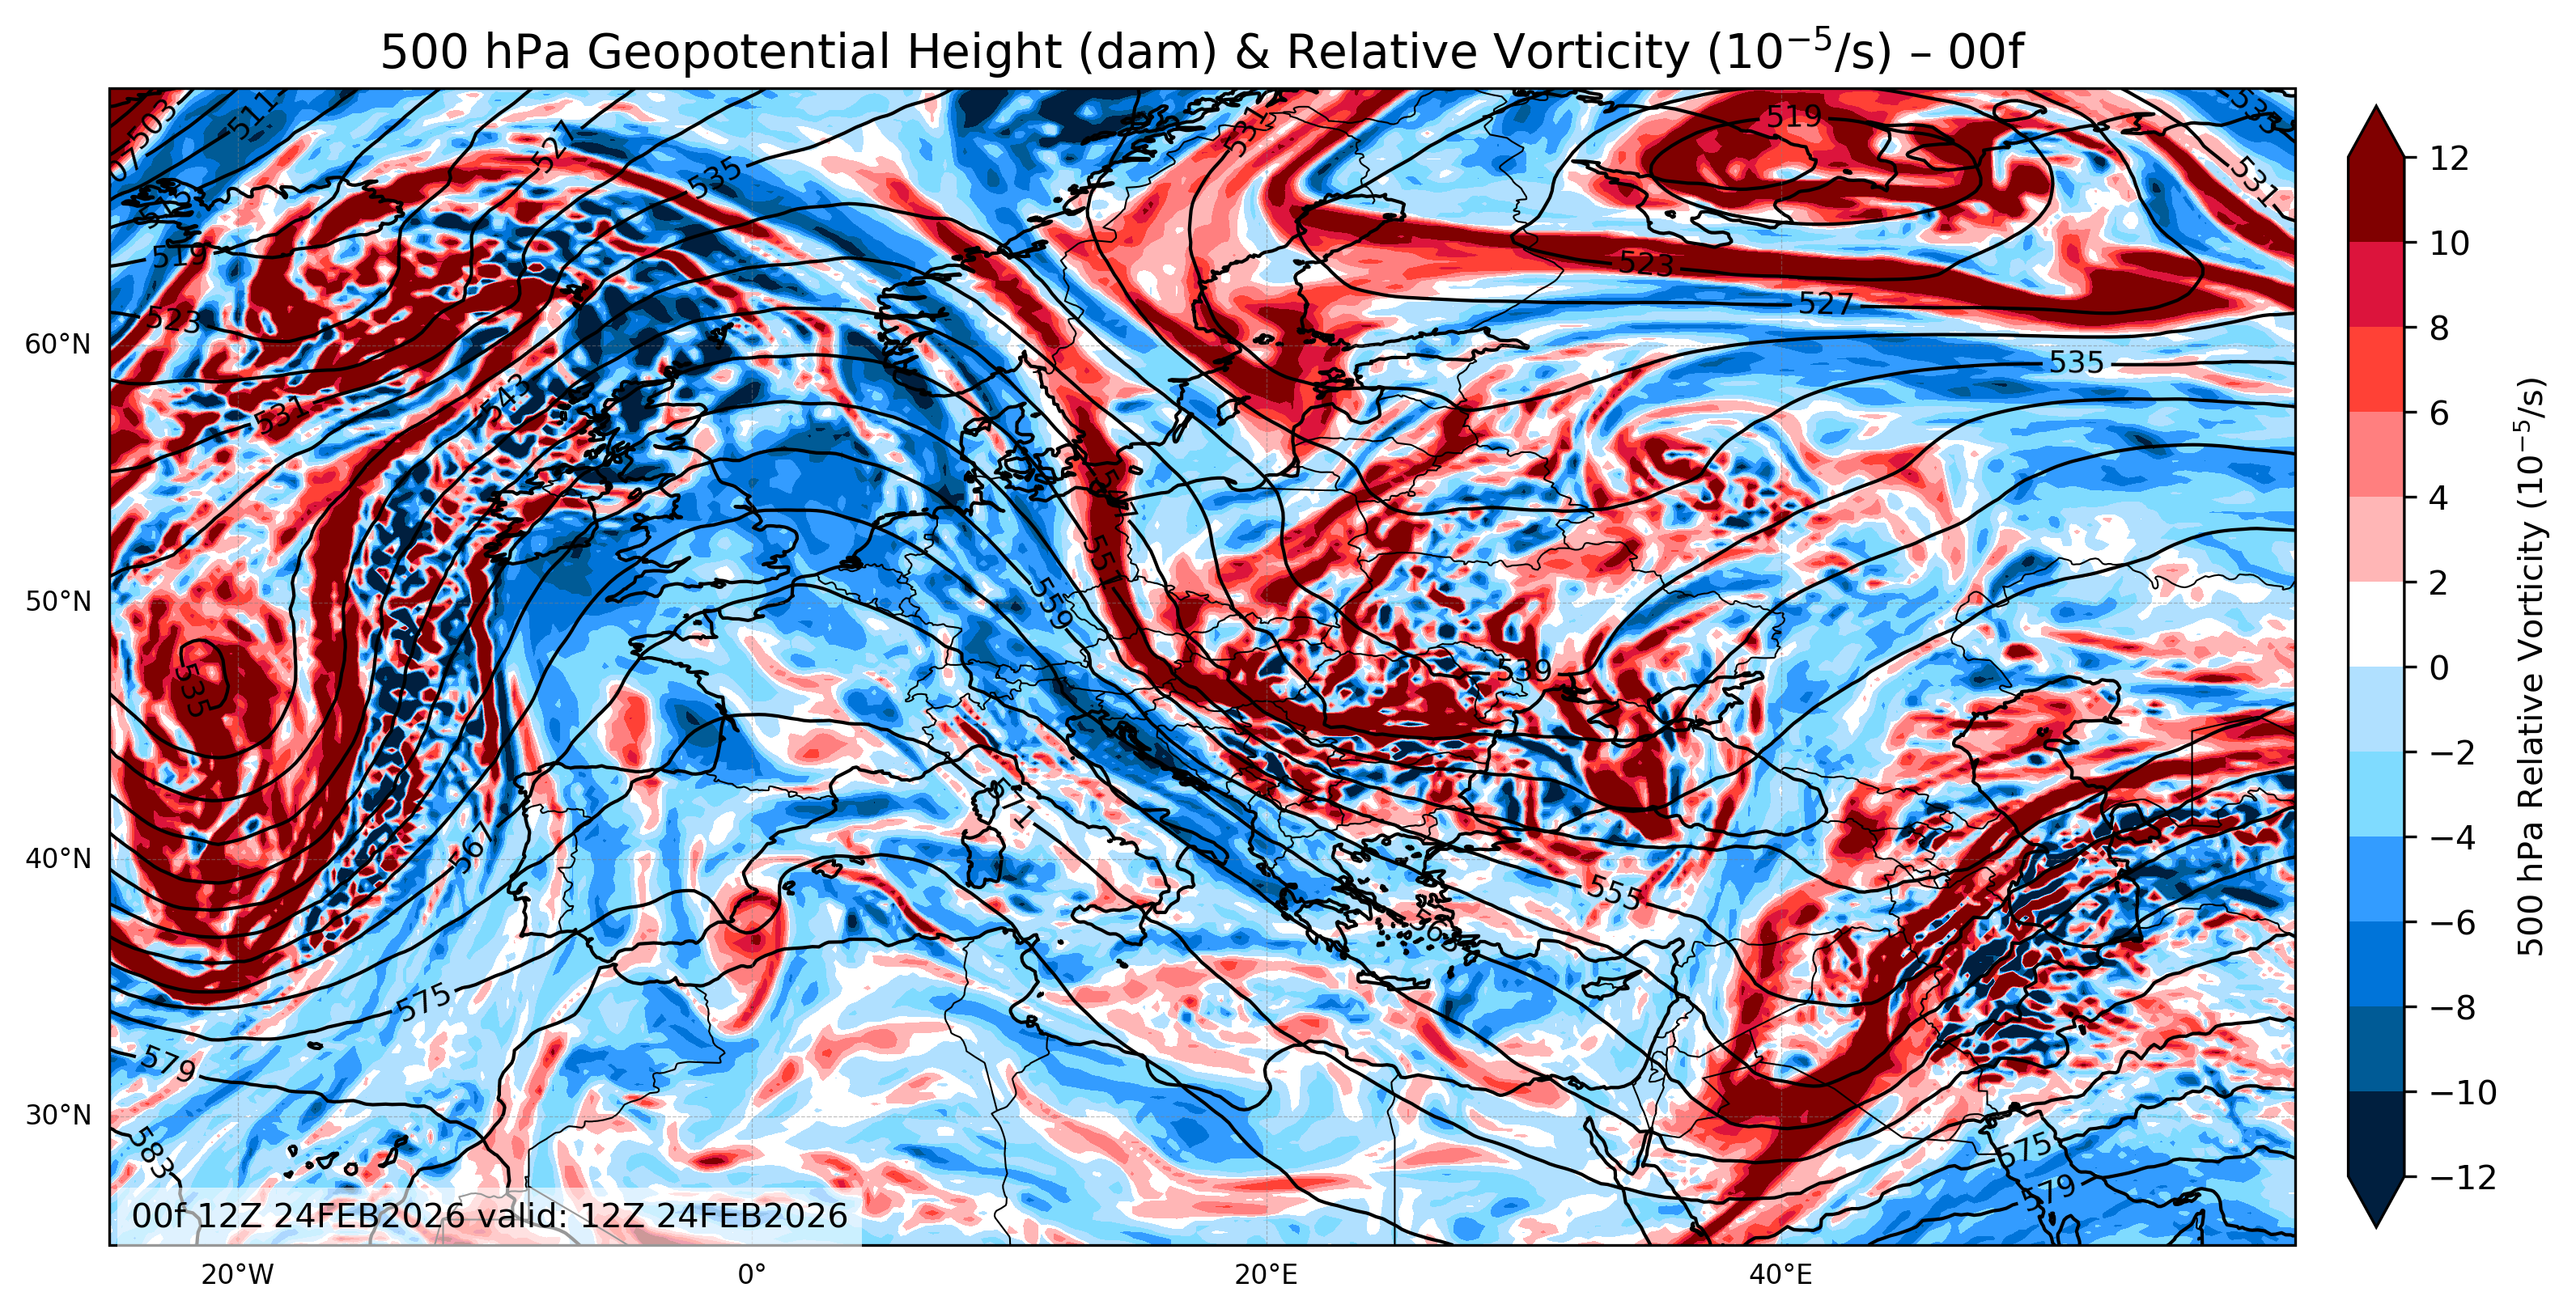
- The Black Lines (Isohypses): These lines connect points of equal height.
- Low Heights (Troughs): Where the lines dip south, it indicates colder air and lower pressure. This is often a “trough.”
- High Heights (Ridges): Where the lines curve north, it indicates warmer air and higher pressure. This is a “ridge.”
Interpreting the Euro 500 hPa Geopotential Height and Relative Vorticity 00 Analysis
This specific map combines the height contours with relative vorticity colors. The “00” indicates this is the analysis (initialization) time, showing the current reality rather than a forecast.
To forecast storms using data like the GFS 500mb geopotential height model, you must understand the relationship between the colors and the spin of the air.
1. Red Areas (Positive Relative Vorticity)
The red and dark brown zones on the map represent positive relative vorticity.
- The Physics: Positive vorticity indicates cyclonic rotation (counter-clockwise in the Northern Hemisphere).
- Weather Impact: Areas of high positive vorticity (Red) are associated with troughs and atmospheric lifting. Consequently, this “spin” forces air upward, creating clouds, rain, and storm systems.
- Key Takeaway: If you see deep reds inside a trough on the Geopotential Height and Relative Vorticity map, that is where the active weather is located.
2. Blue Areas (Negative Relative Vorticity)
The blue zones represent negative relative vorticity.
- The Physics: Negative vorticity indicates anticyclonic rotation (clockwise).
- Weather Impact: This is associated with ridges and sinking air (subsidence).
- Key Takeaway: Blue areas usually act as a stabilizer, suppressing cloud formation and leading to fair weather.
Conclusion: Euro 500 hPa Geopotential Height and Relative Vorticity 00
In summary, the Euro 500 mb Geopotential Height and Relative Vorticity chart is the blueprint of the weather. By analyzing the interaction between the geopotential height contours and the red zones of positive vorticity, you can pinpoint exactly where storms are developing right now.
Click for Euro 500 mb geopotential height and relative vorticity 24