Forecasting weather three days in advance requires looking at the medium-range patterns of the upper atmosphere. The Euro 500 hPa Geopotential Height and Relative Vorticity 72 chart is the essential tool for this task. It projects the state of the atmosphere exactly 72 hours into the future, allowing meteorologists to spot developing storms well before they arrive.
This guide explains how to use this geopotential height map, answers “what is relative vorticity,” and helps you interpret the 3-day outlook.
Understanding Geopotential Height Meteorology
To read the Geopotential Height and Relative Vorticity 72 map, you must understand the structure of the atmosphere.
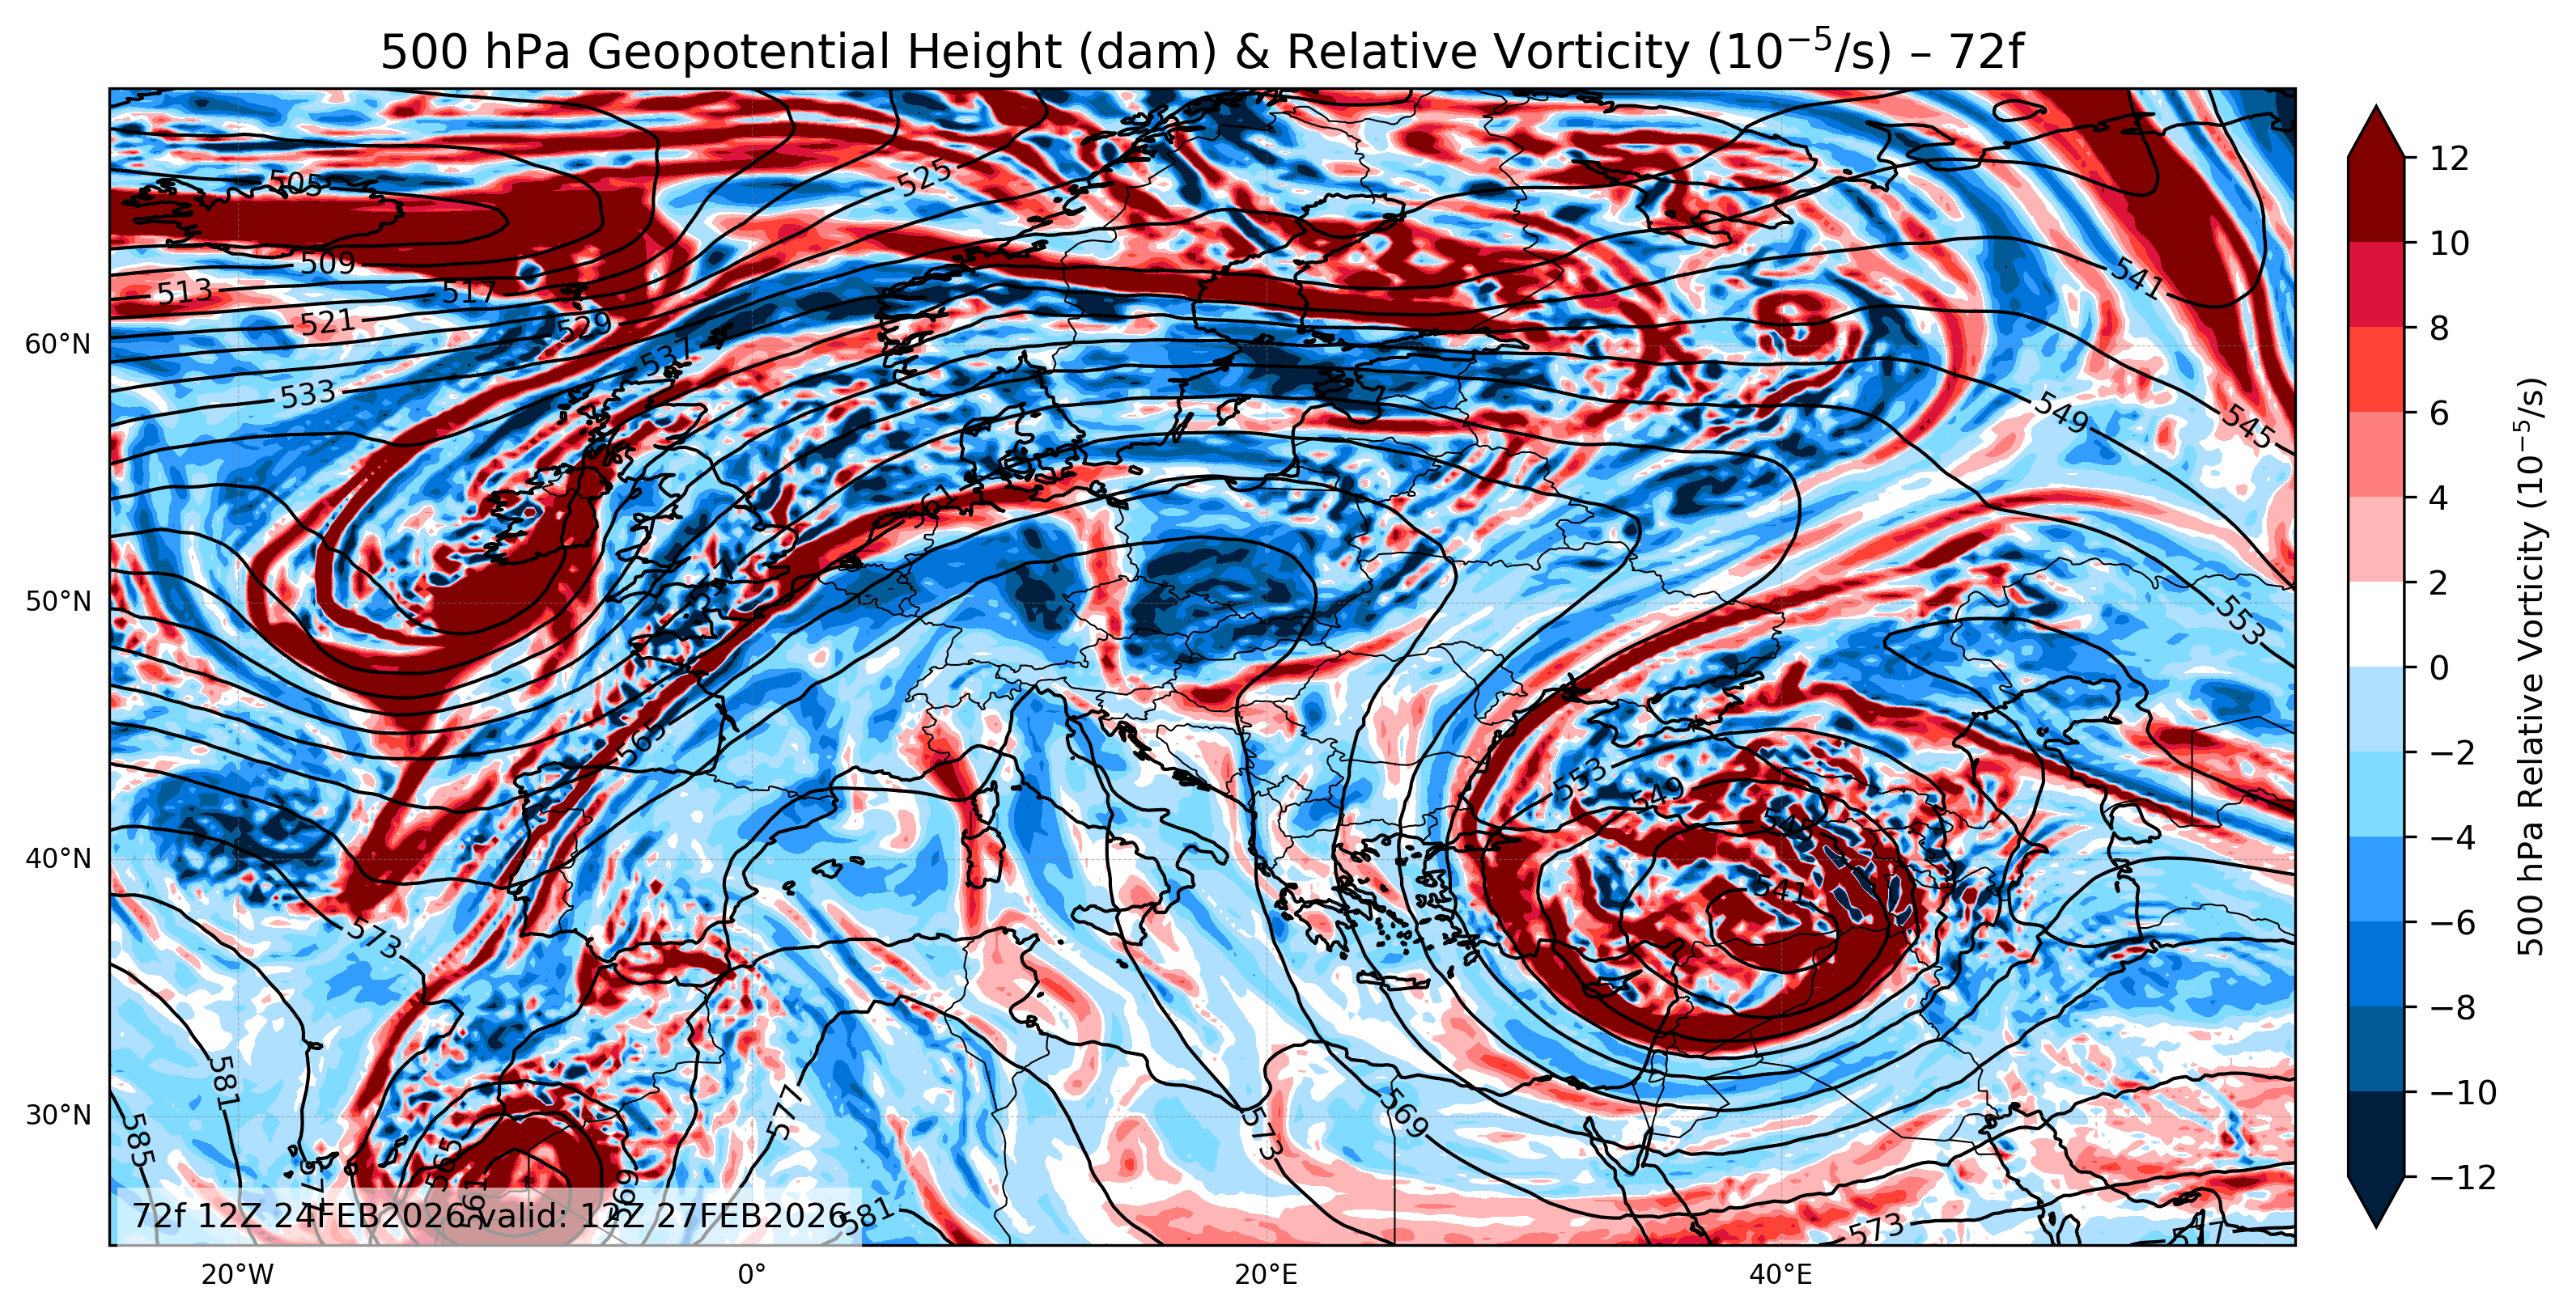
In geopotential height meteorology, we look at the altitude of pressure levels. This 500 hpa geopotential height map shows the “steering flow” of the weather roughly 5.5 km up. Much like standard GFS geopotential height models, the black contour lines on this chart reveal troughs (low pressure/cold air) and ridges (high pressure/warm air).
What is Relative Vorticity?
The colors on this map represent vorticity. But what is relative vorticity? Simply put, it is a measure of the local rotation or “spin” of the air at a specific point.
- Spin matters: This rotation determines whether air will rise (creating storms) or sink (clearing skies).
Interpreting the 72-Hour Forecast
Since this is the “72” output, you are looking at a prediction for three days from now. Here is how to read the colored zones:
1. Red Areas (Positive Relative Vorticity)
The red and brown zones on the Euro 500 mb Geopotential Height and Relative Vorticity 72 map represent predicted positive relative vorticity.
- The Physics: This indicates cyclonic (counter-clockwise) rotation.
- 72-Hour Outlook: Positive vorticity induces lifting air. If you see these red zones moving toward your region on the chart, expect clouds, rain, or storm systems in three days.
2. Blue Areas (Negative Relative Vorticity)
The blue zones represent predicted negative relative vorticity.
- The Physics: This indicates anticyclonic (clockwise) rotation.
- 72-Hour Outlook: Negative relative vorticity causes air to sink (subsidence). Consequently, these areas typically bring stable weather. If the map shows blue over your area in 72 hours, you can predict clear skies and high pressure.
Conclusion: Euro 500 hPa Geopotential Height and Relative Vorticity 72
In summary, the Euro 500 mb Geopotential Height and Relative Vorticity 72 chart is vital for medium-range planning. By tracking the interaction between positive relative vorticity (red/storms) and negative relative vorticity (blue/calm) on this map, you can confidently forecast the weather 72 hours in advance. It is necessary to compare this map with other maps.
Click for Euro 500 hPa geopotential height and relative vorticity 00f