Medium Range Forecasts
| Weather Map Images | Time: | Analysis | Day 1 24 Hours |
Day 2 48 Hours |
Day 3 72 Hours |
Day 4 96 Hours |
| Field: | All Fields |
All Fields |
All Fields |
All Fields |
All Fields |
|
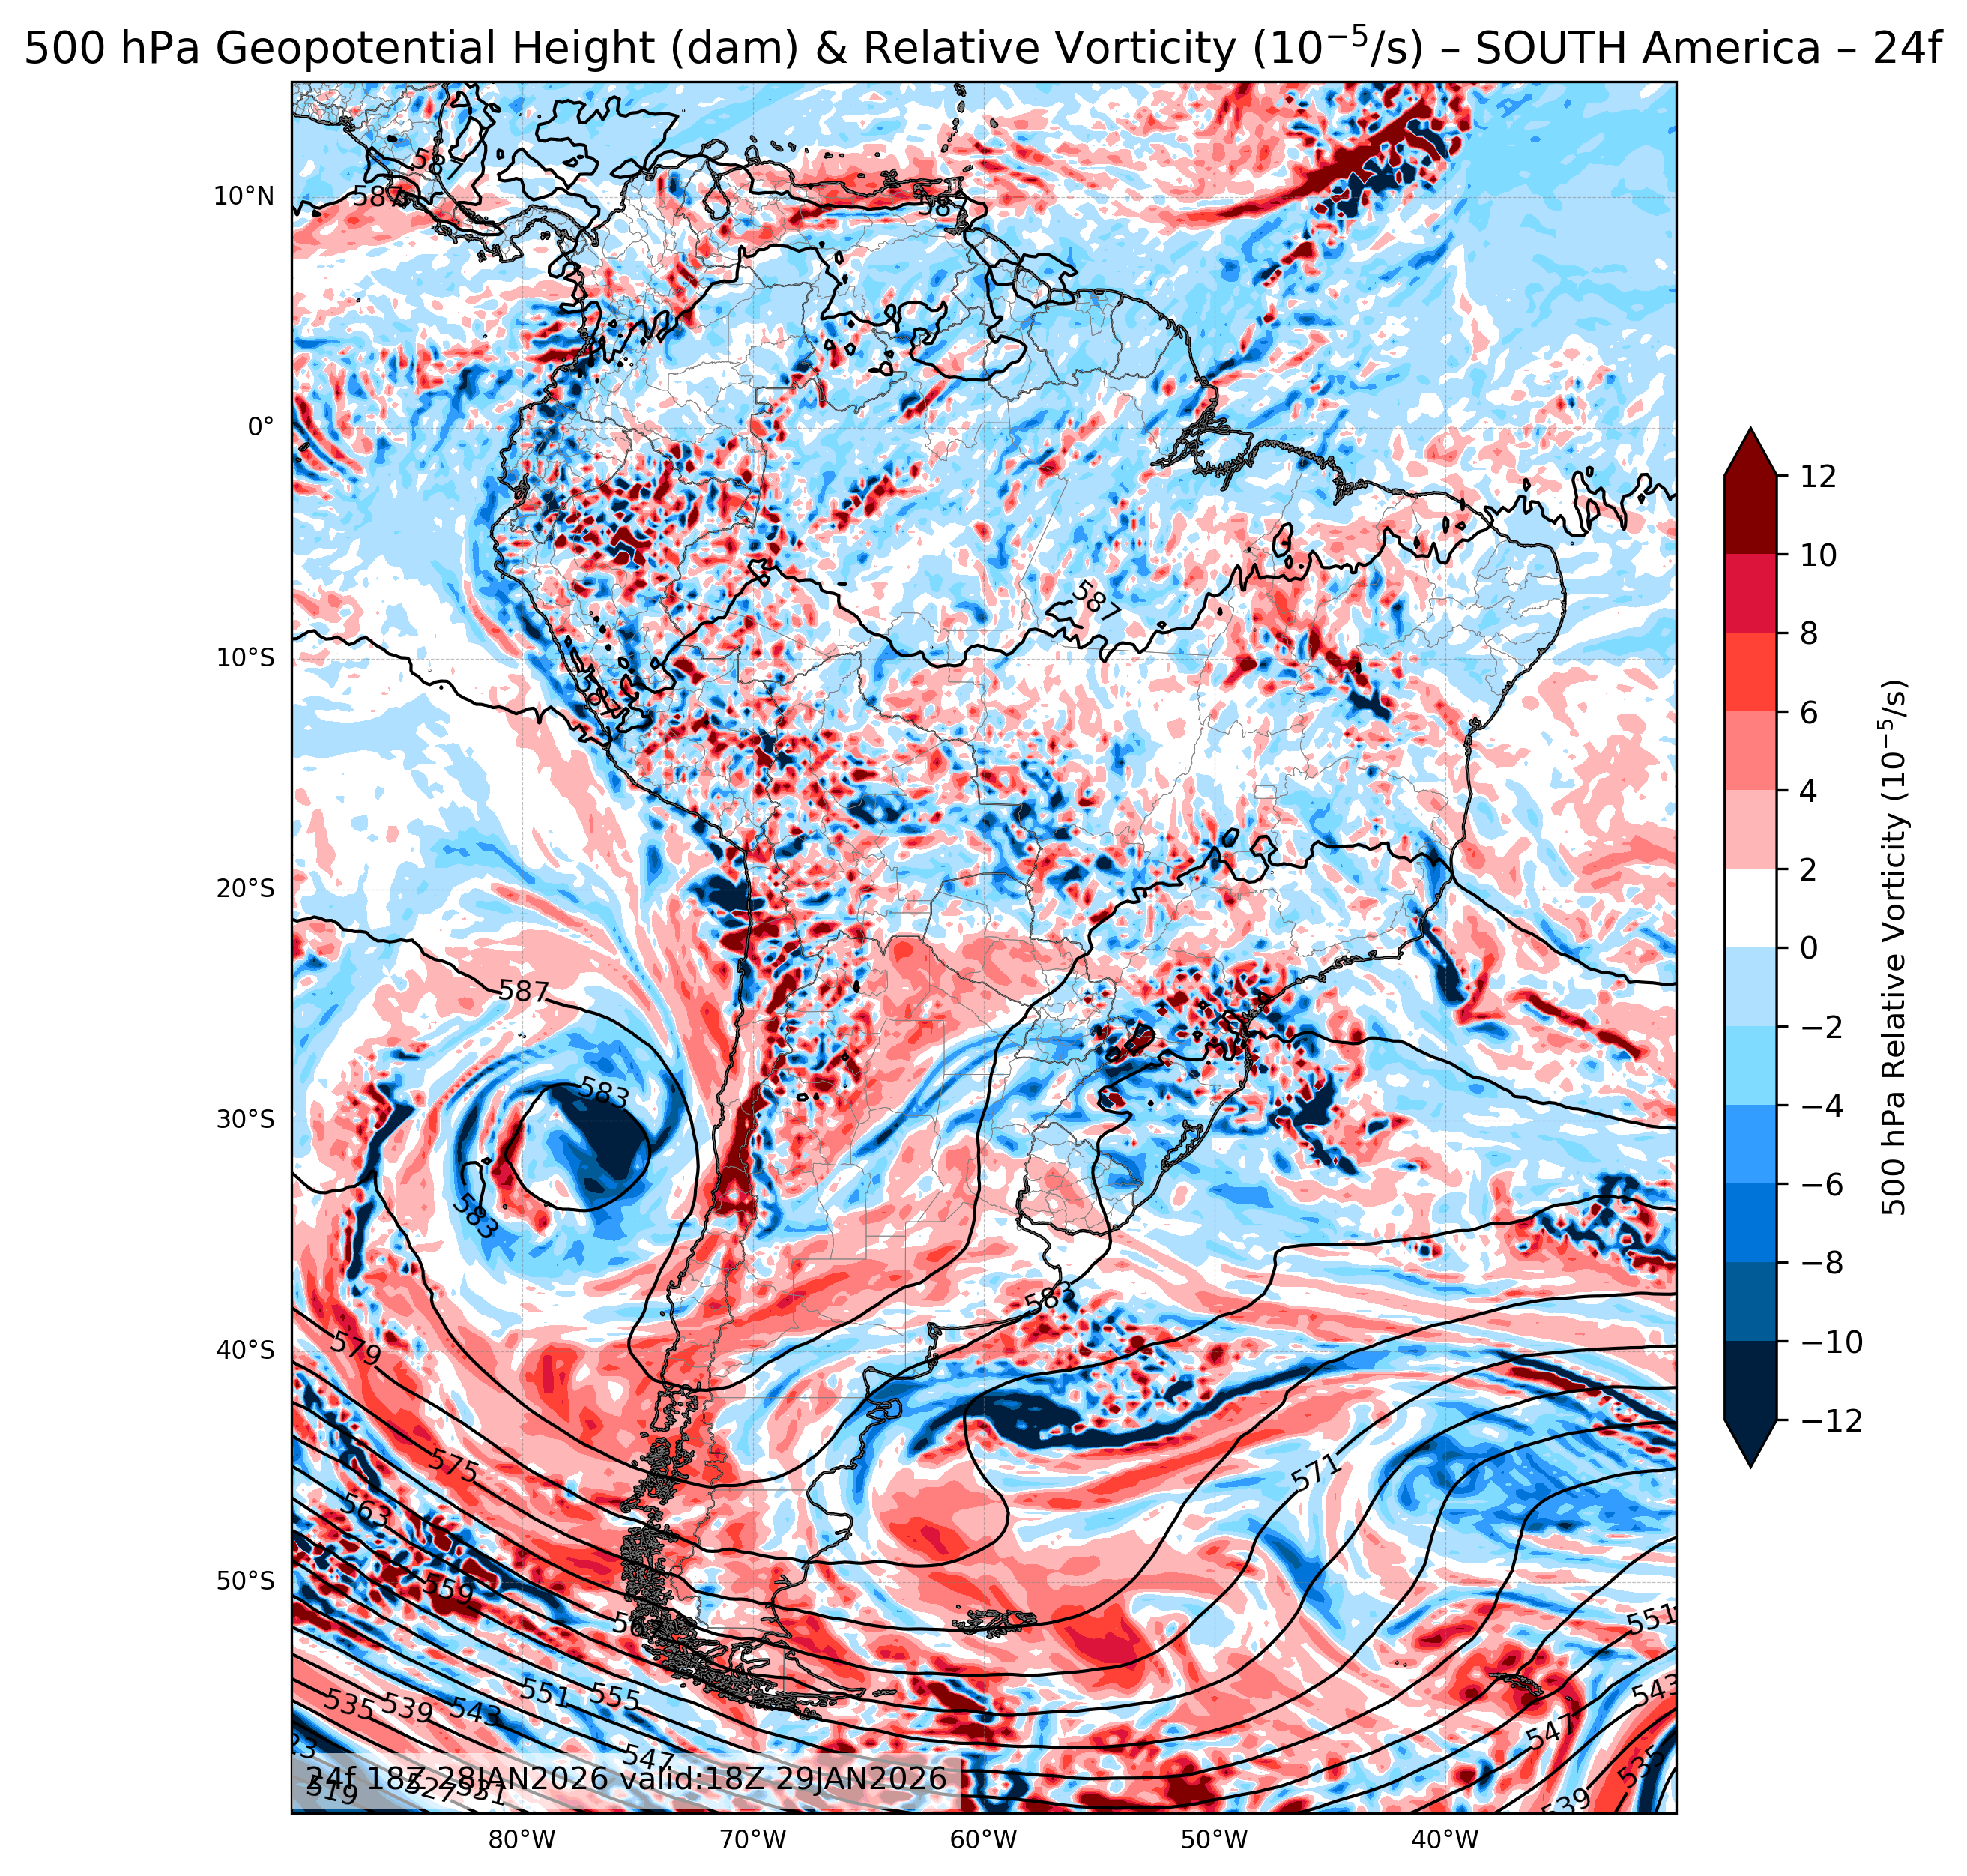
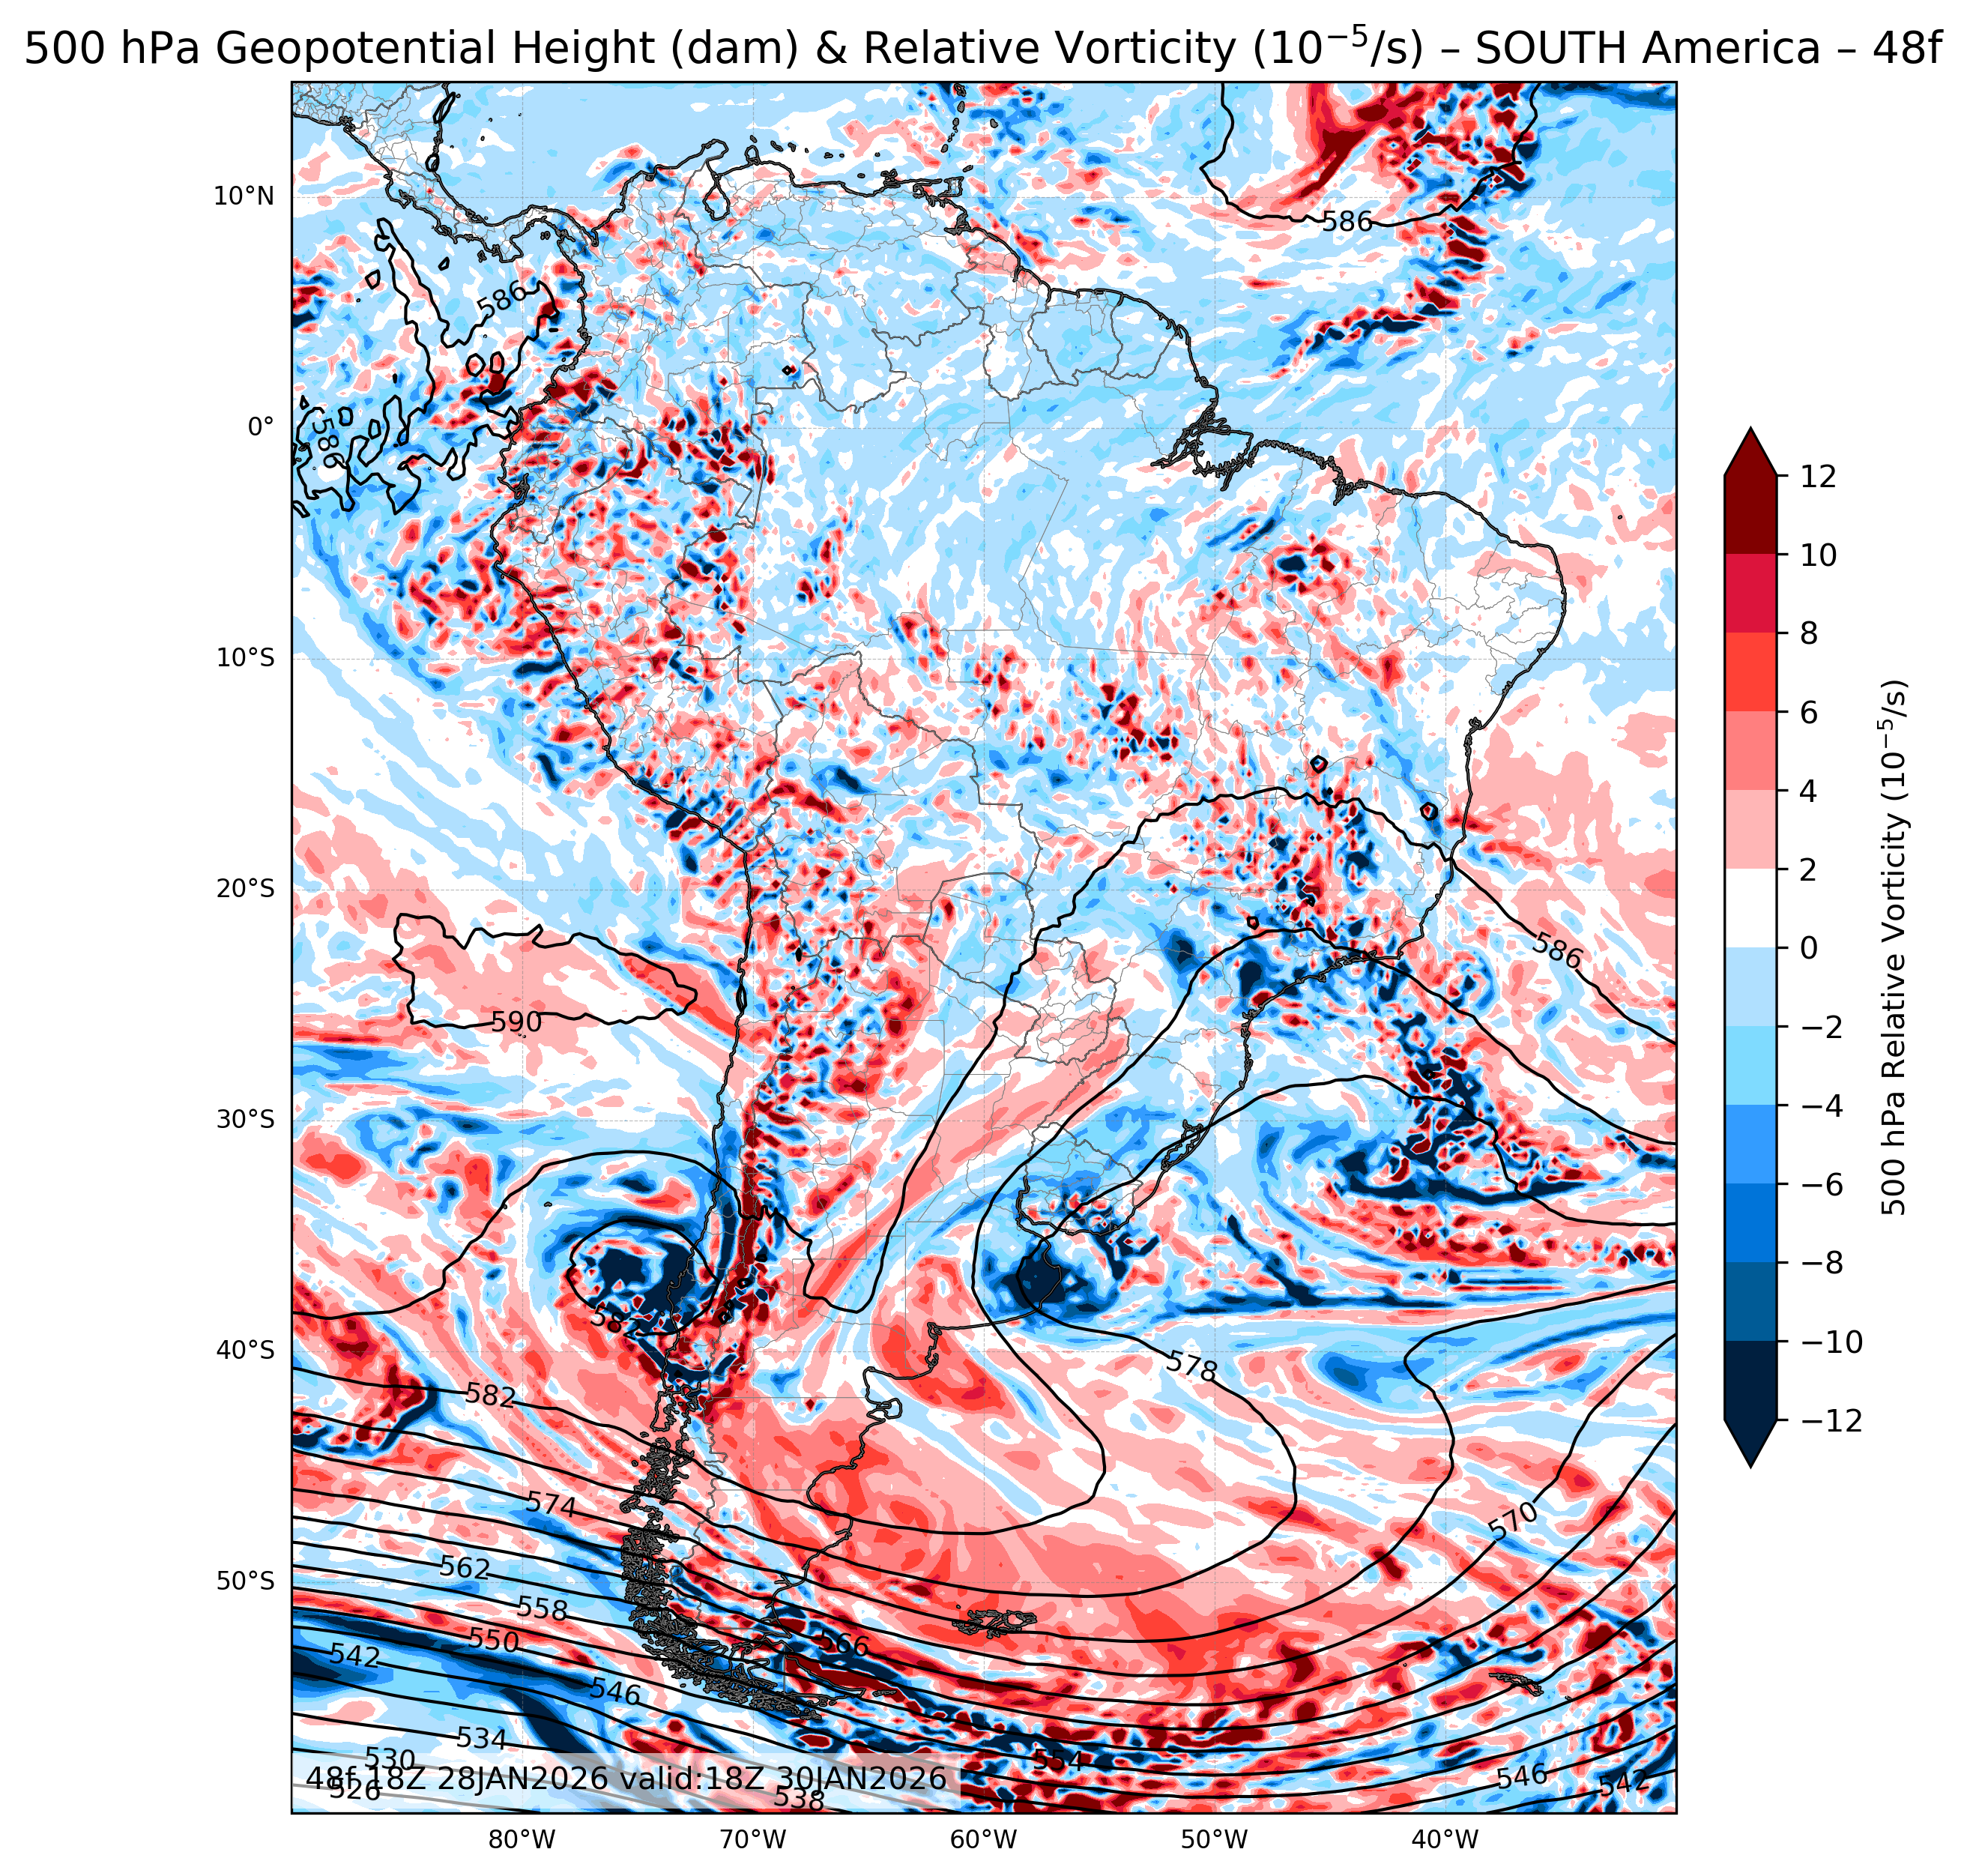
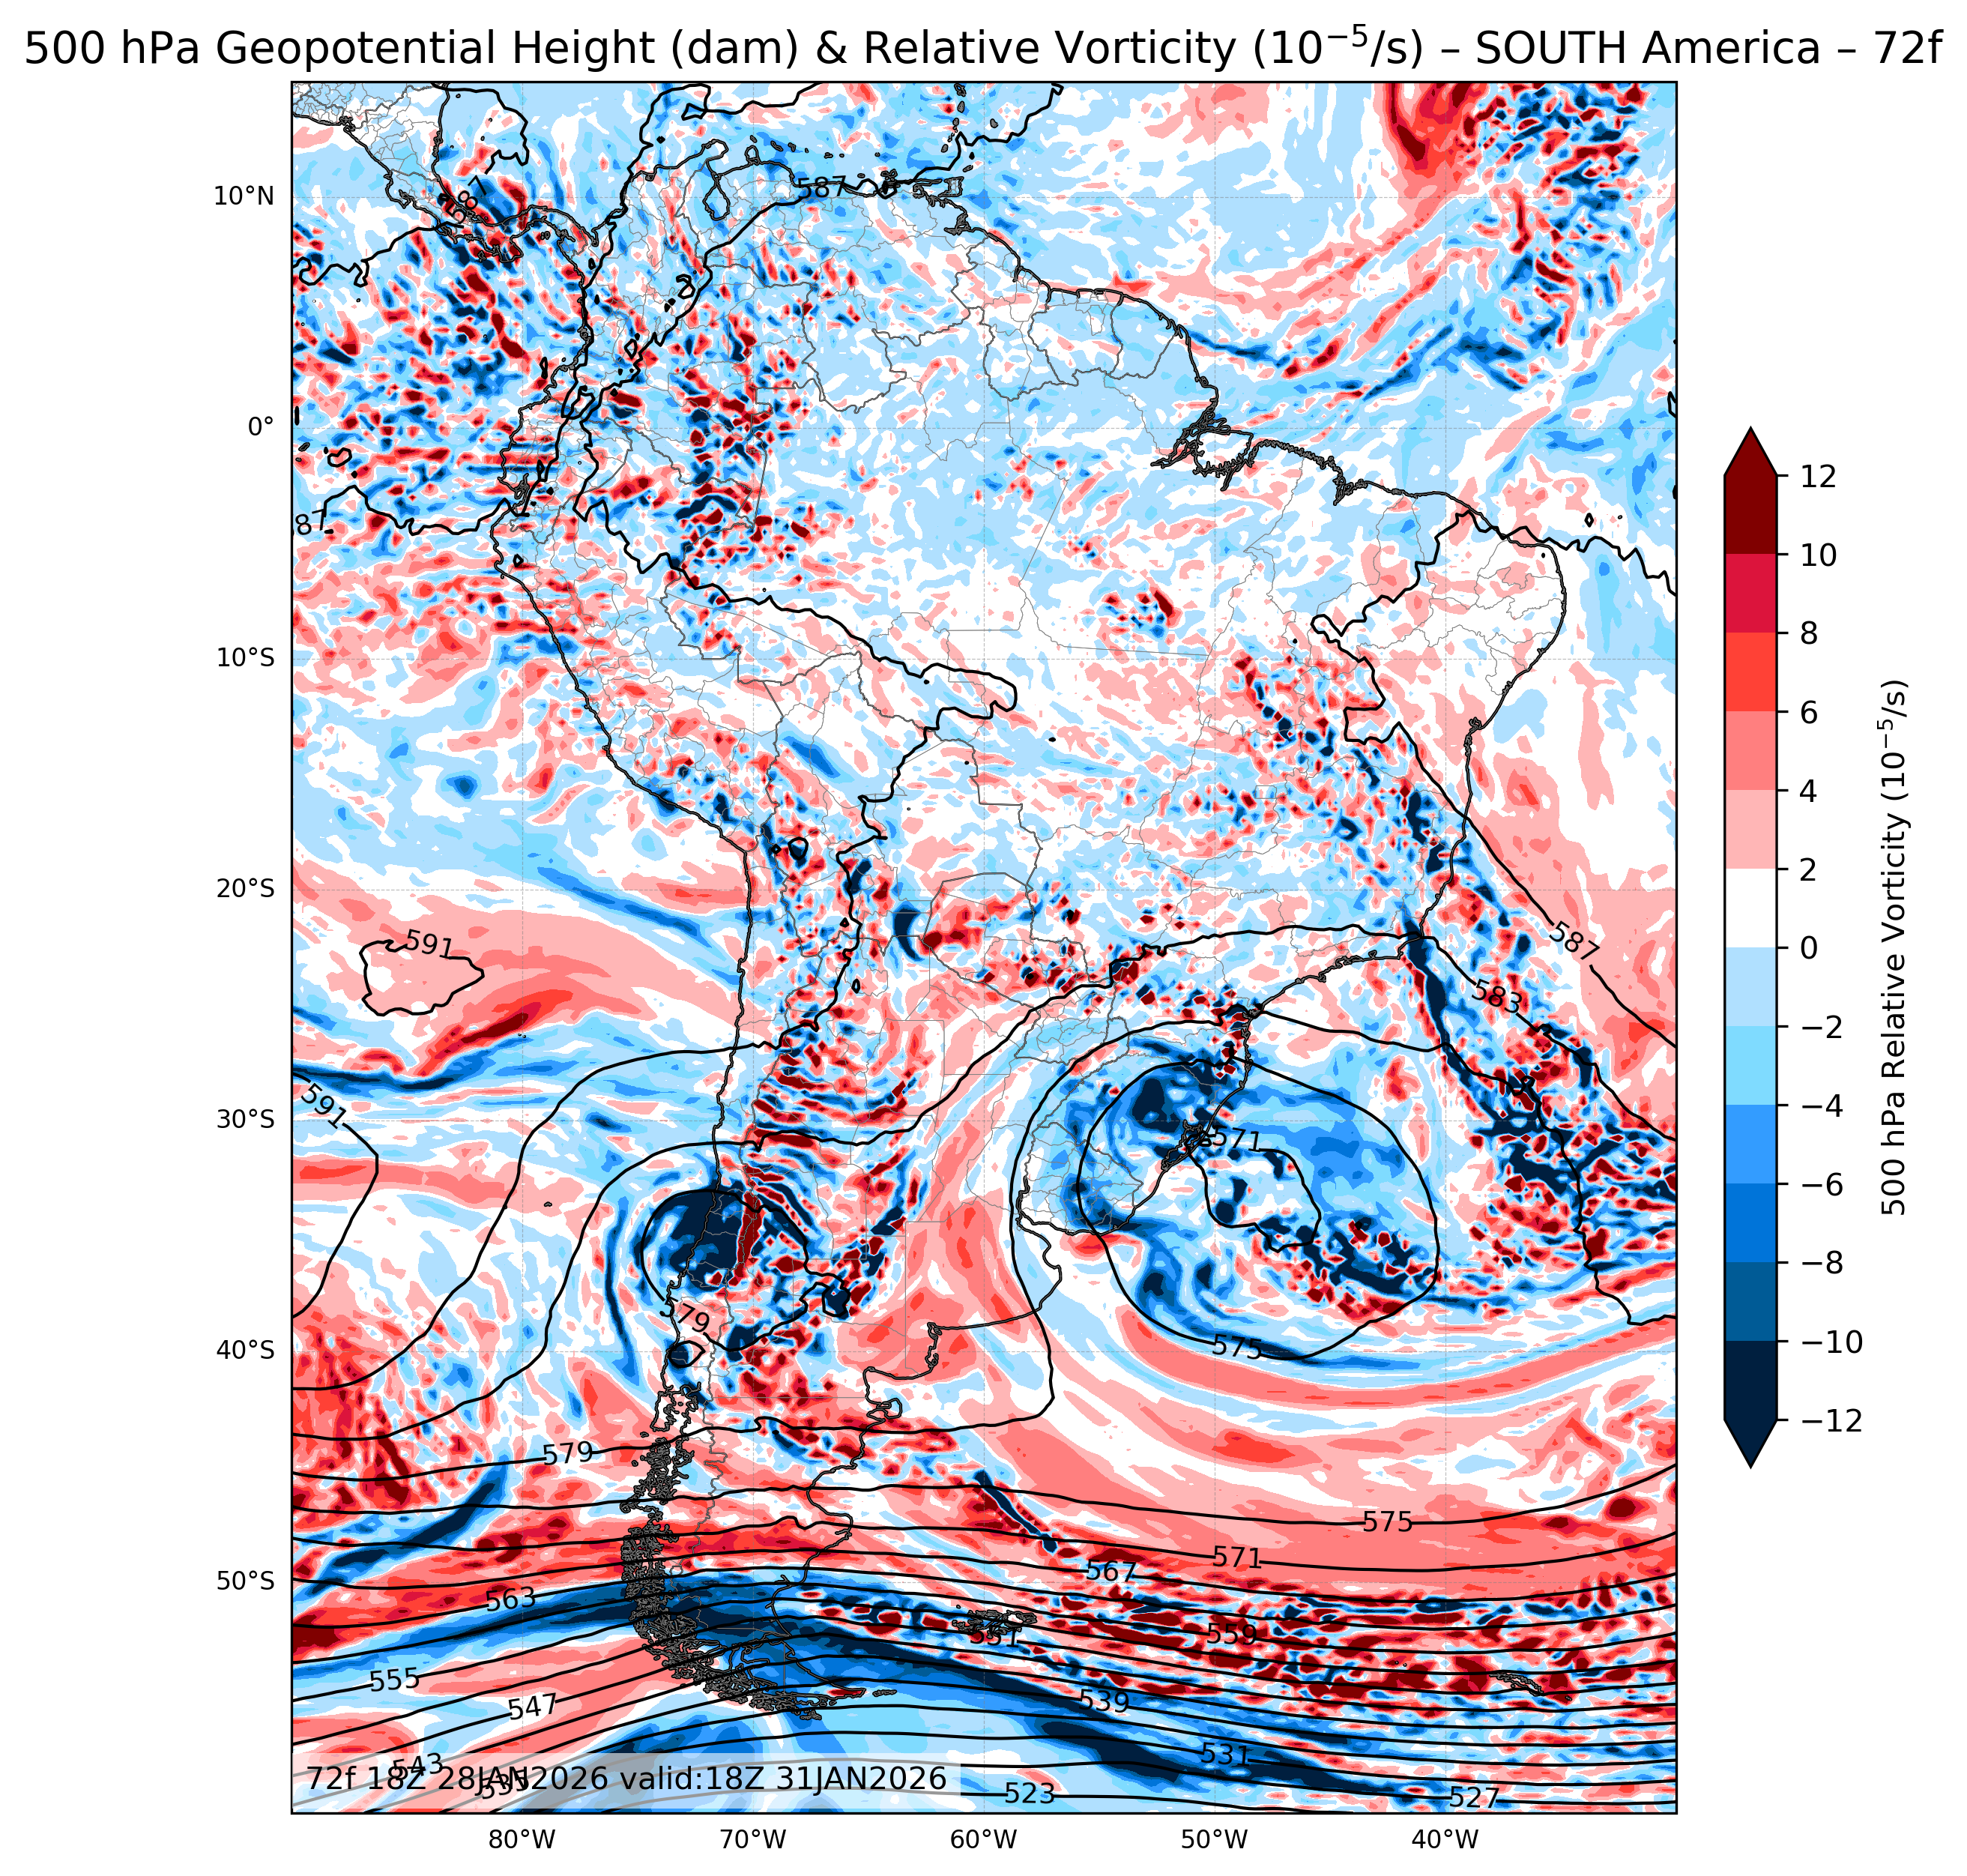
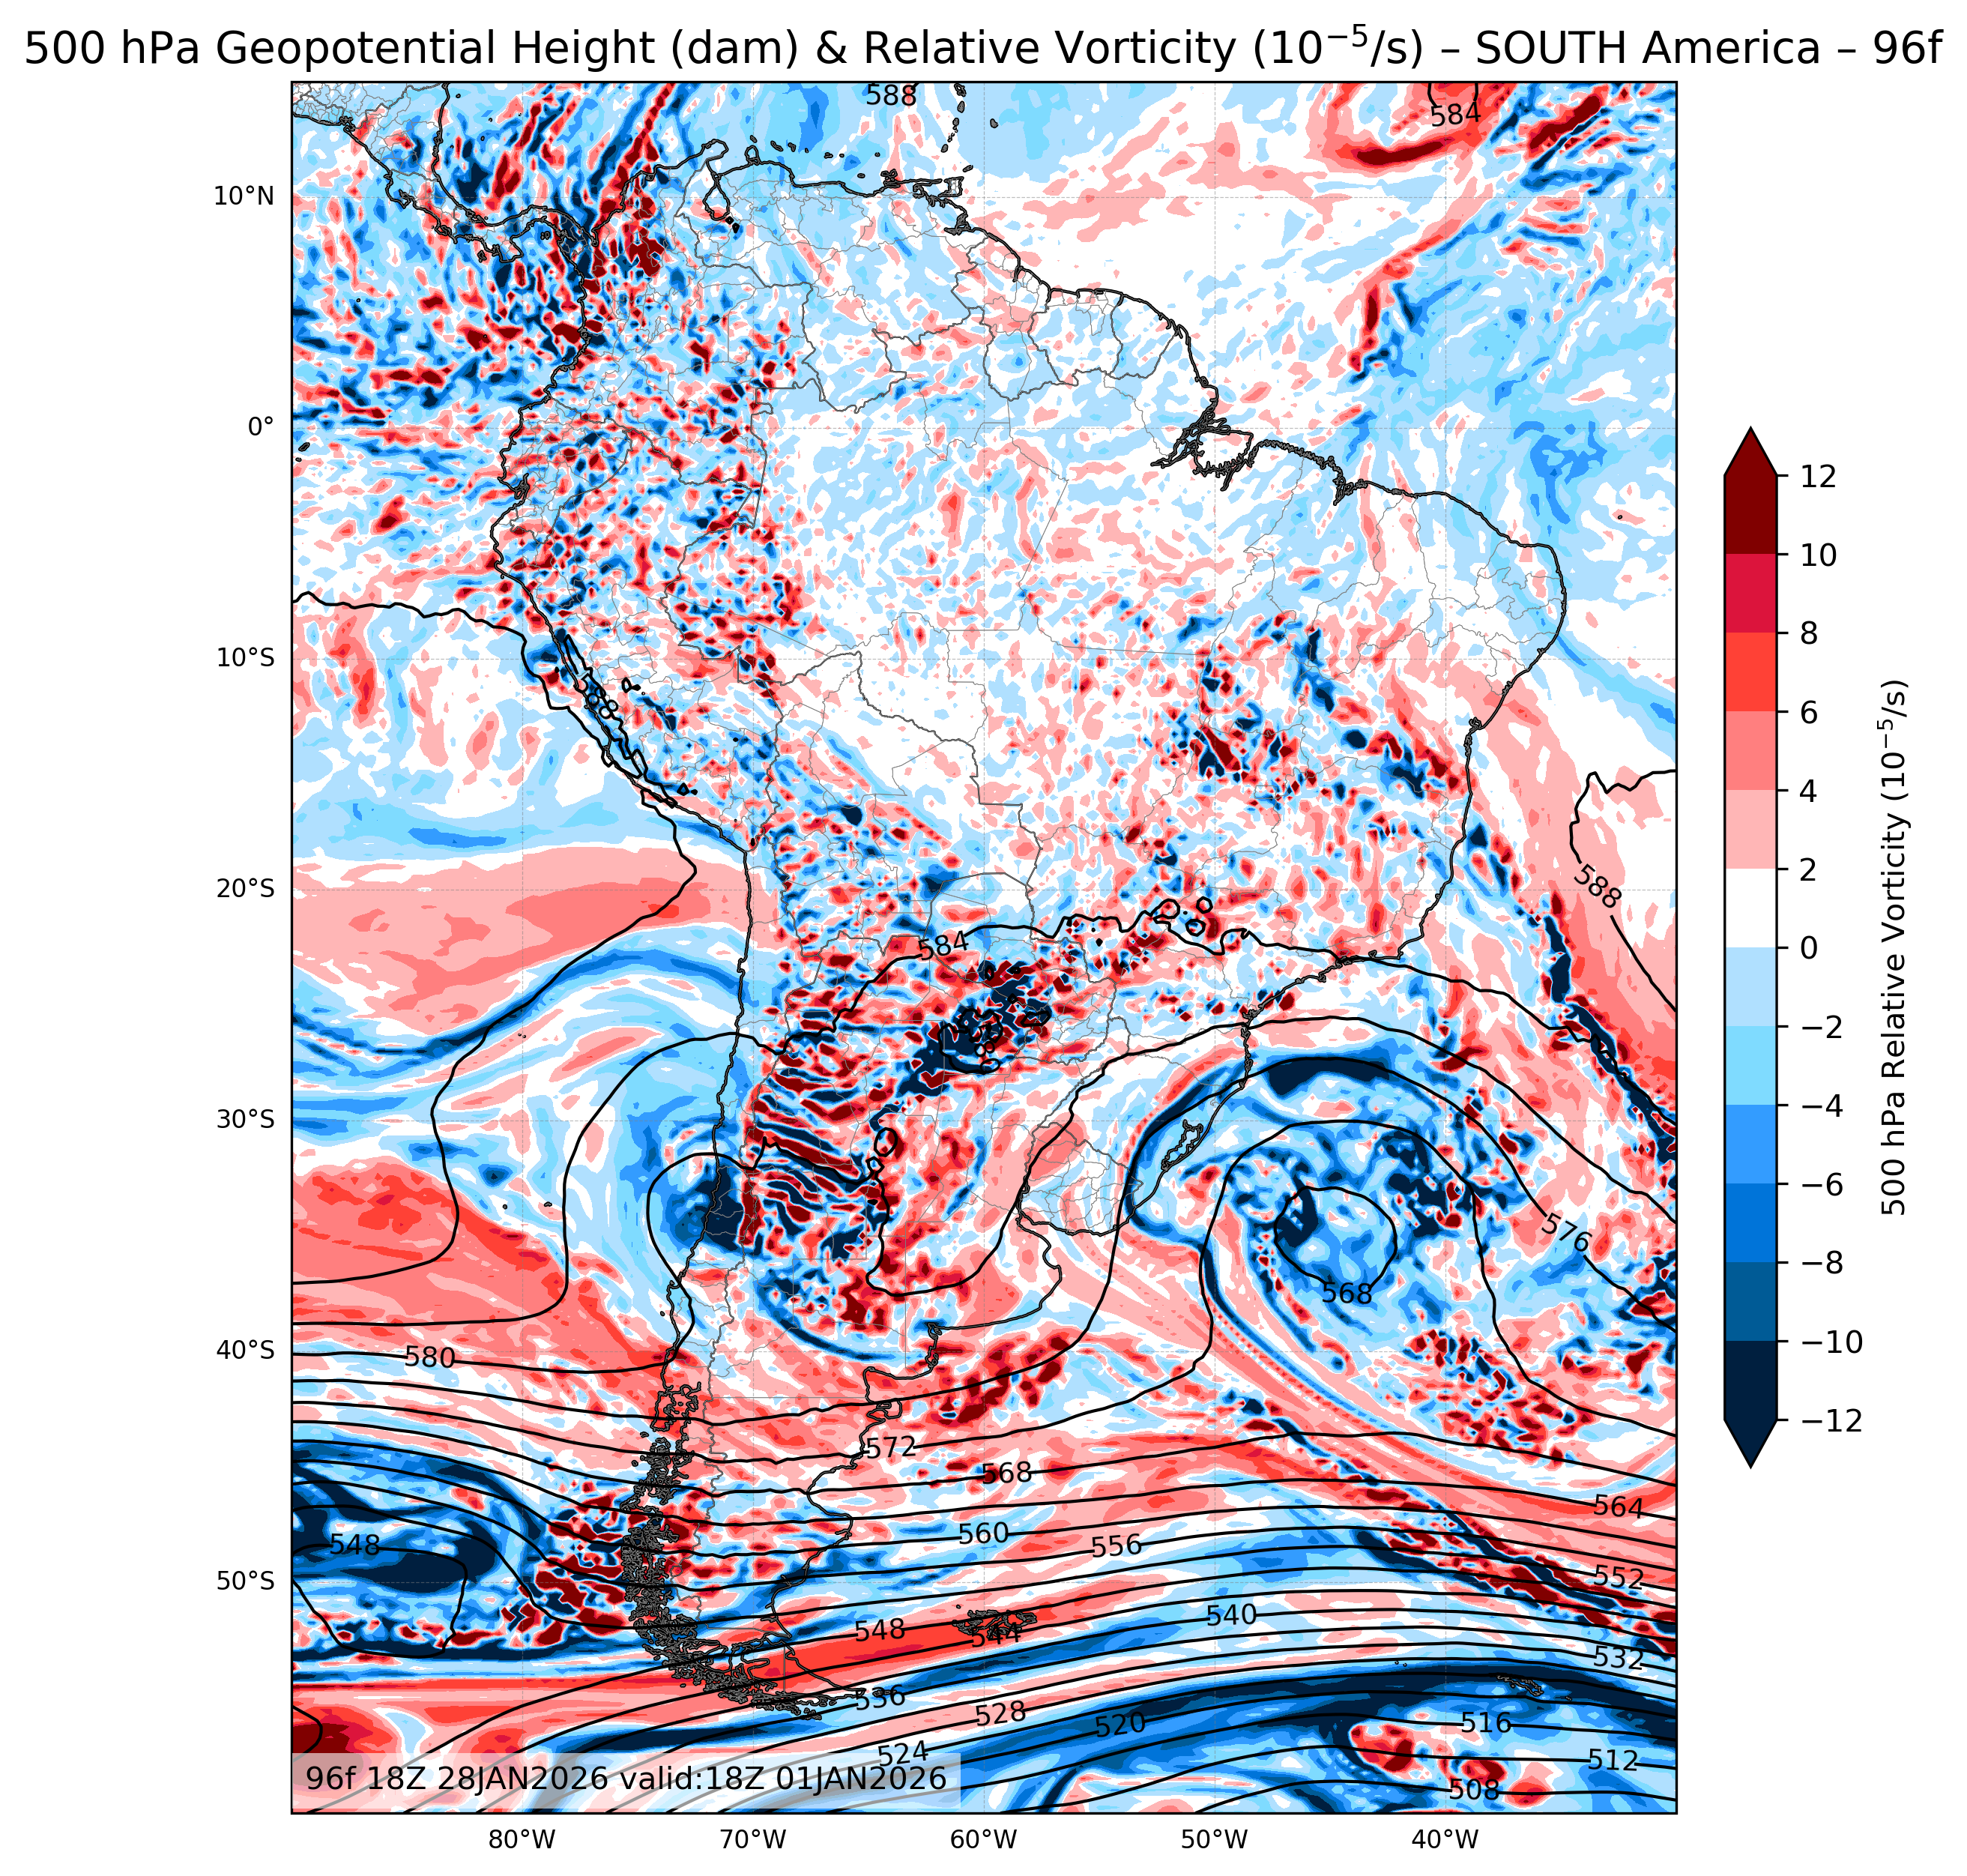
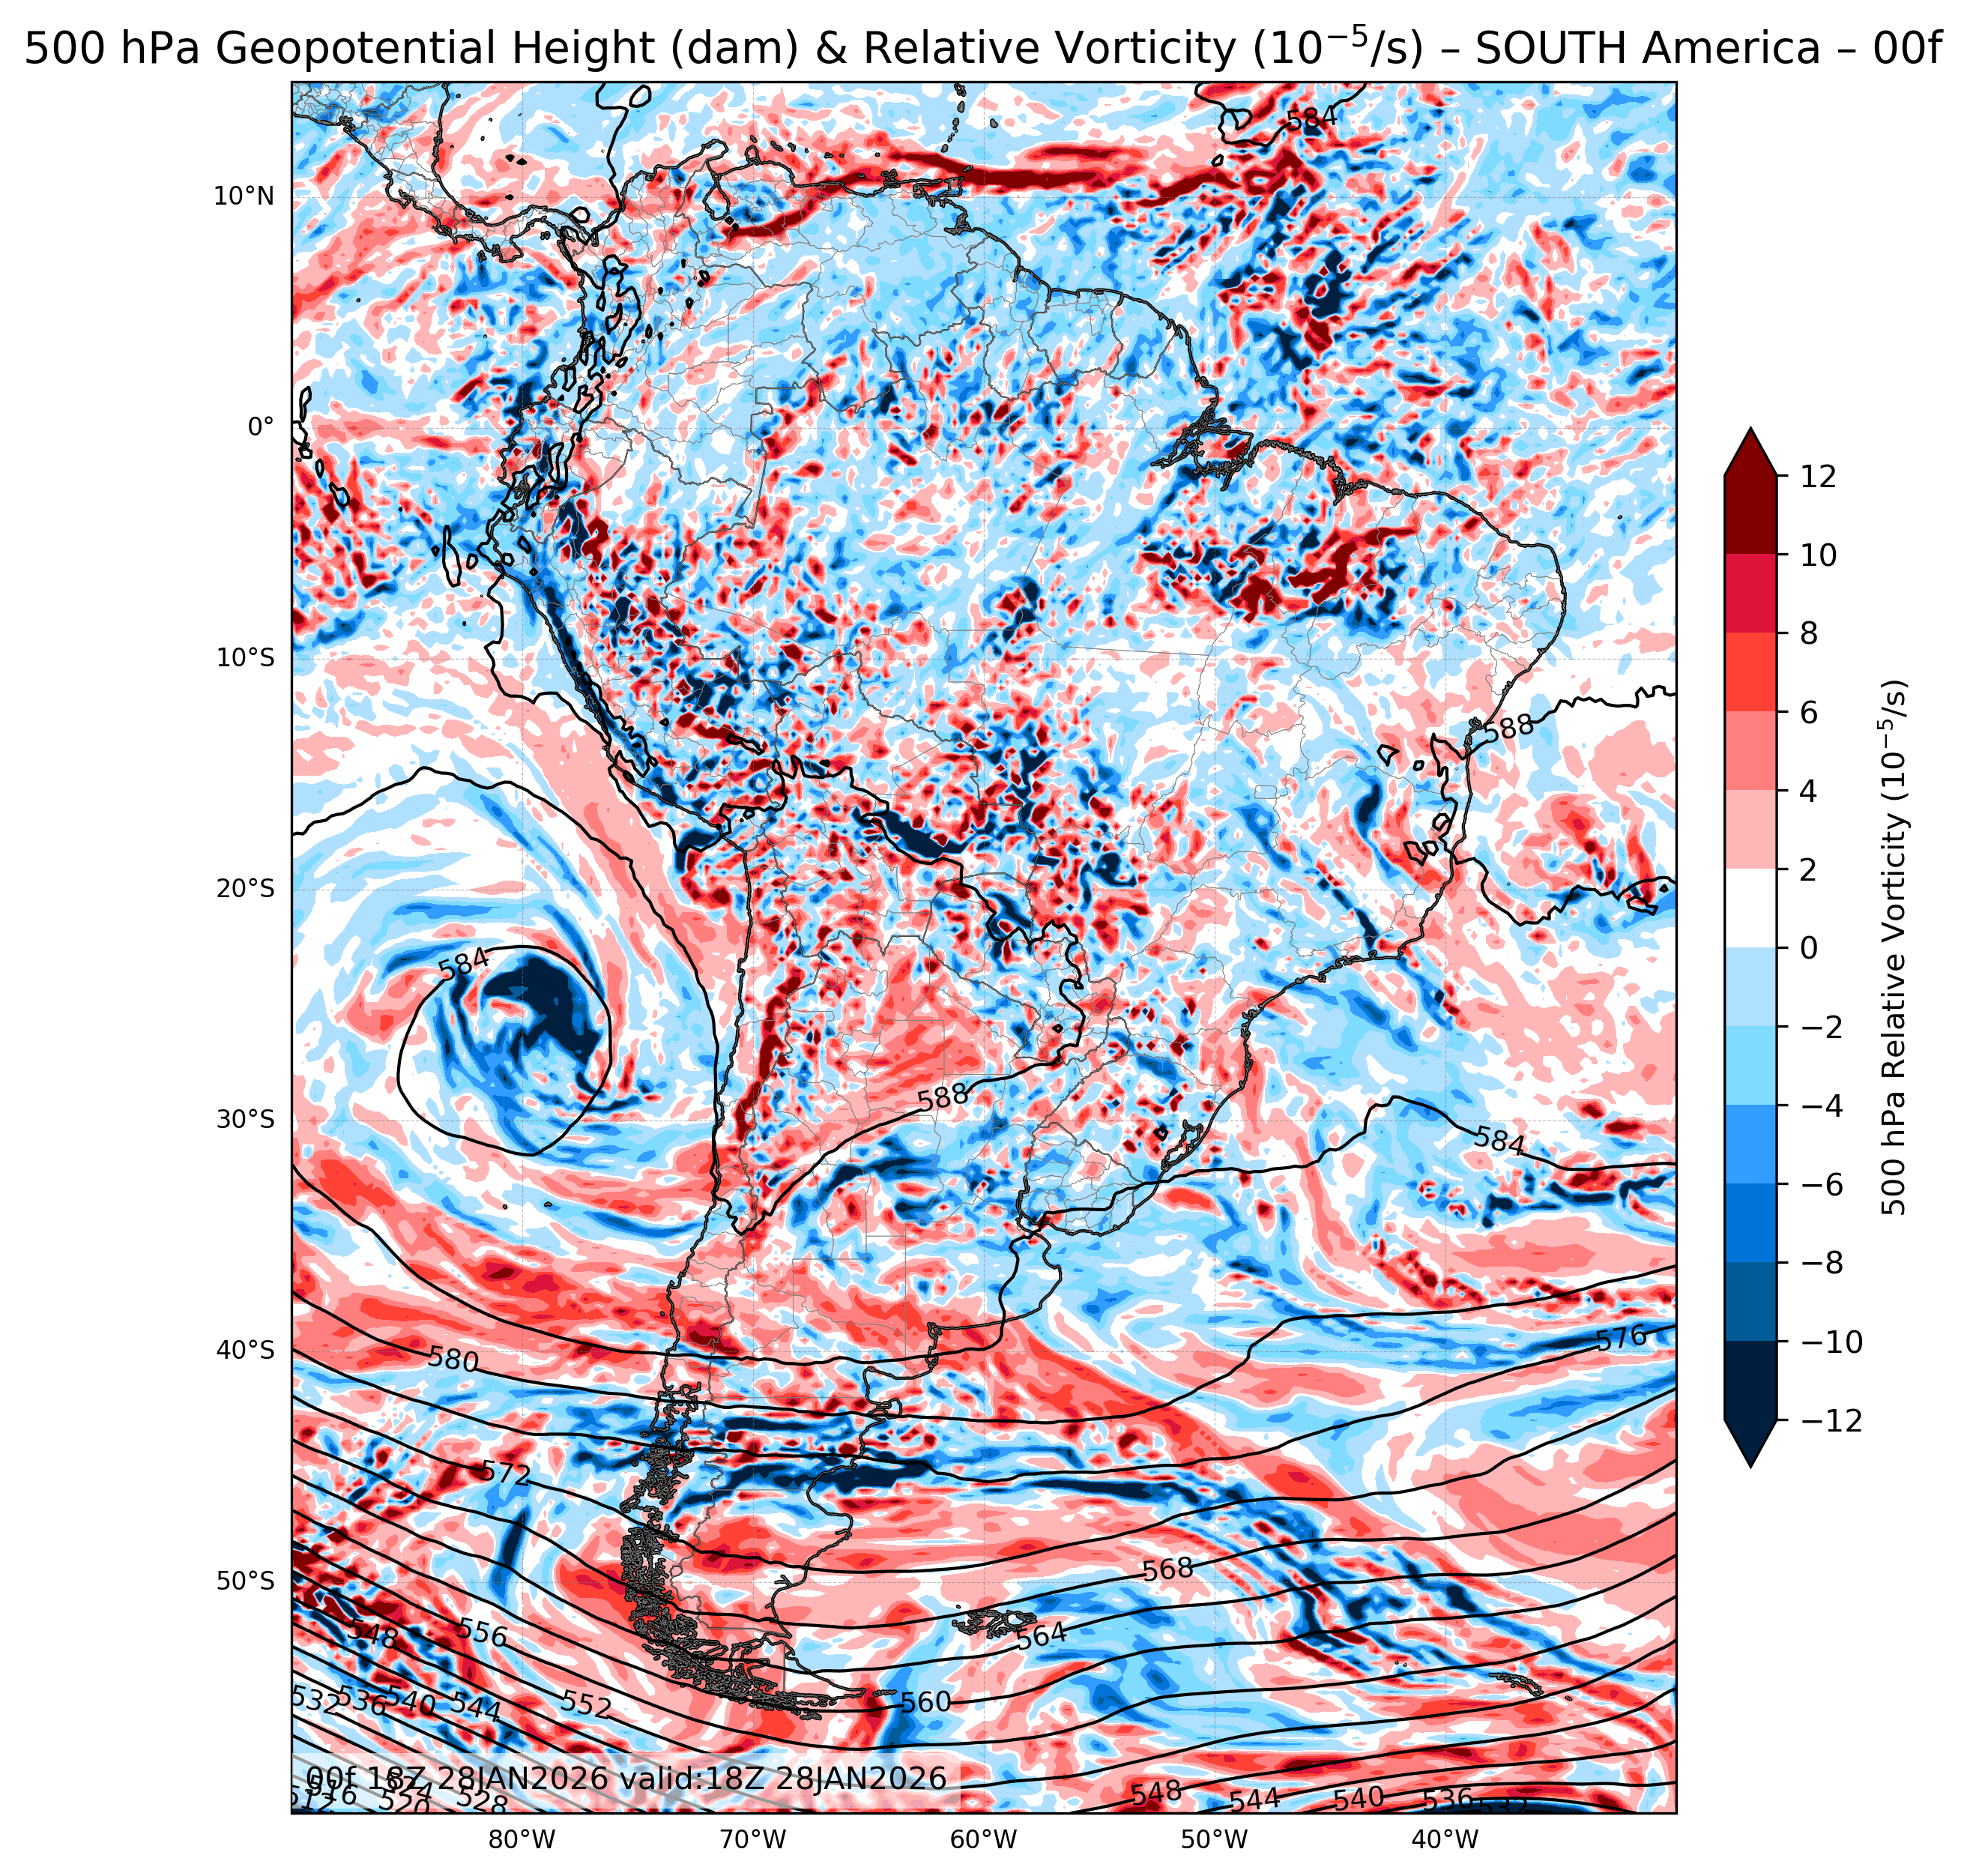
| 500mb Geopotential Height & Vorticity |
All Times |
🔍 | 🔍 | 🔍 | 🔍 | 🔍 |
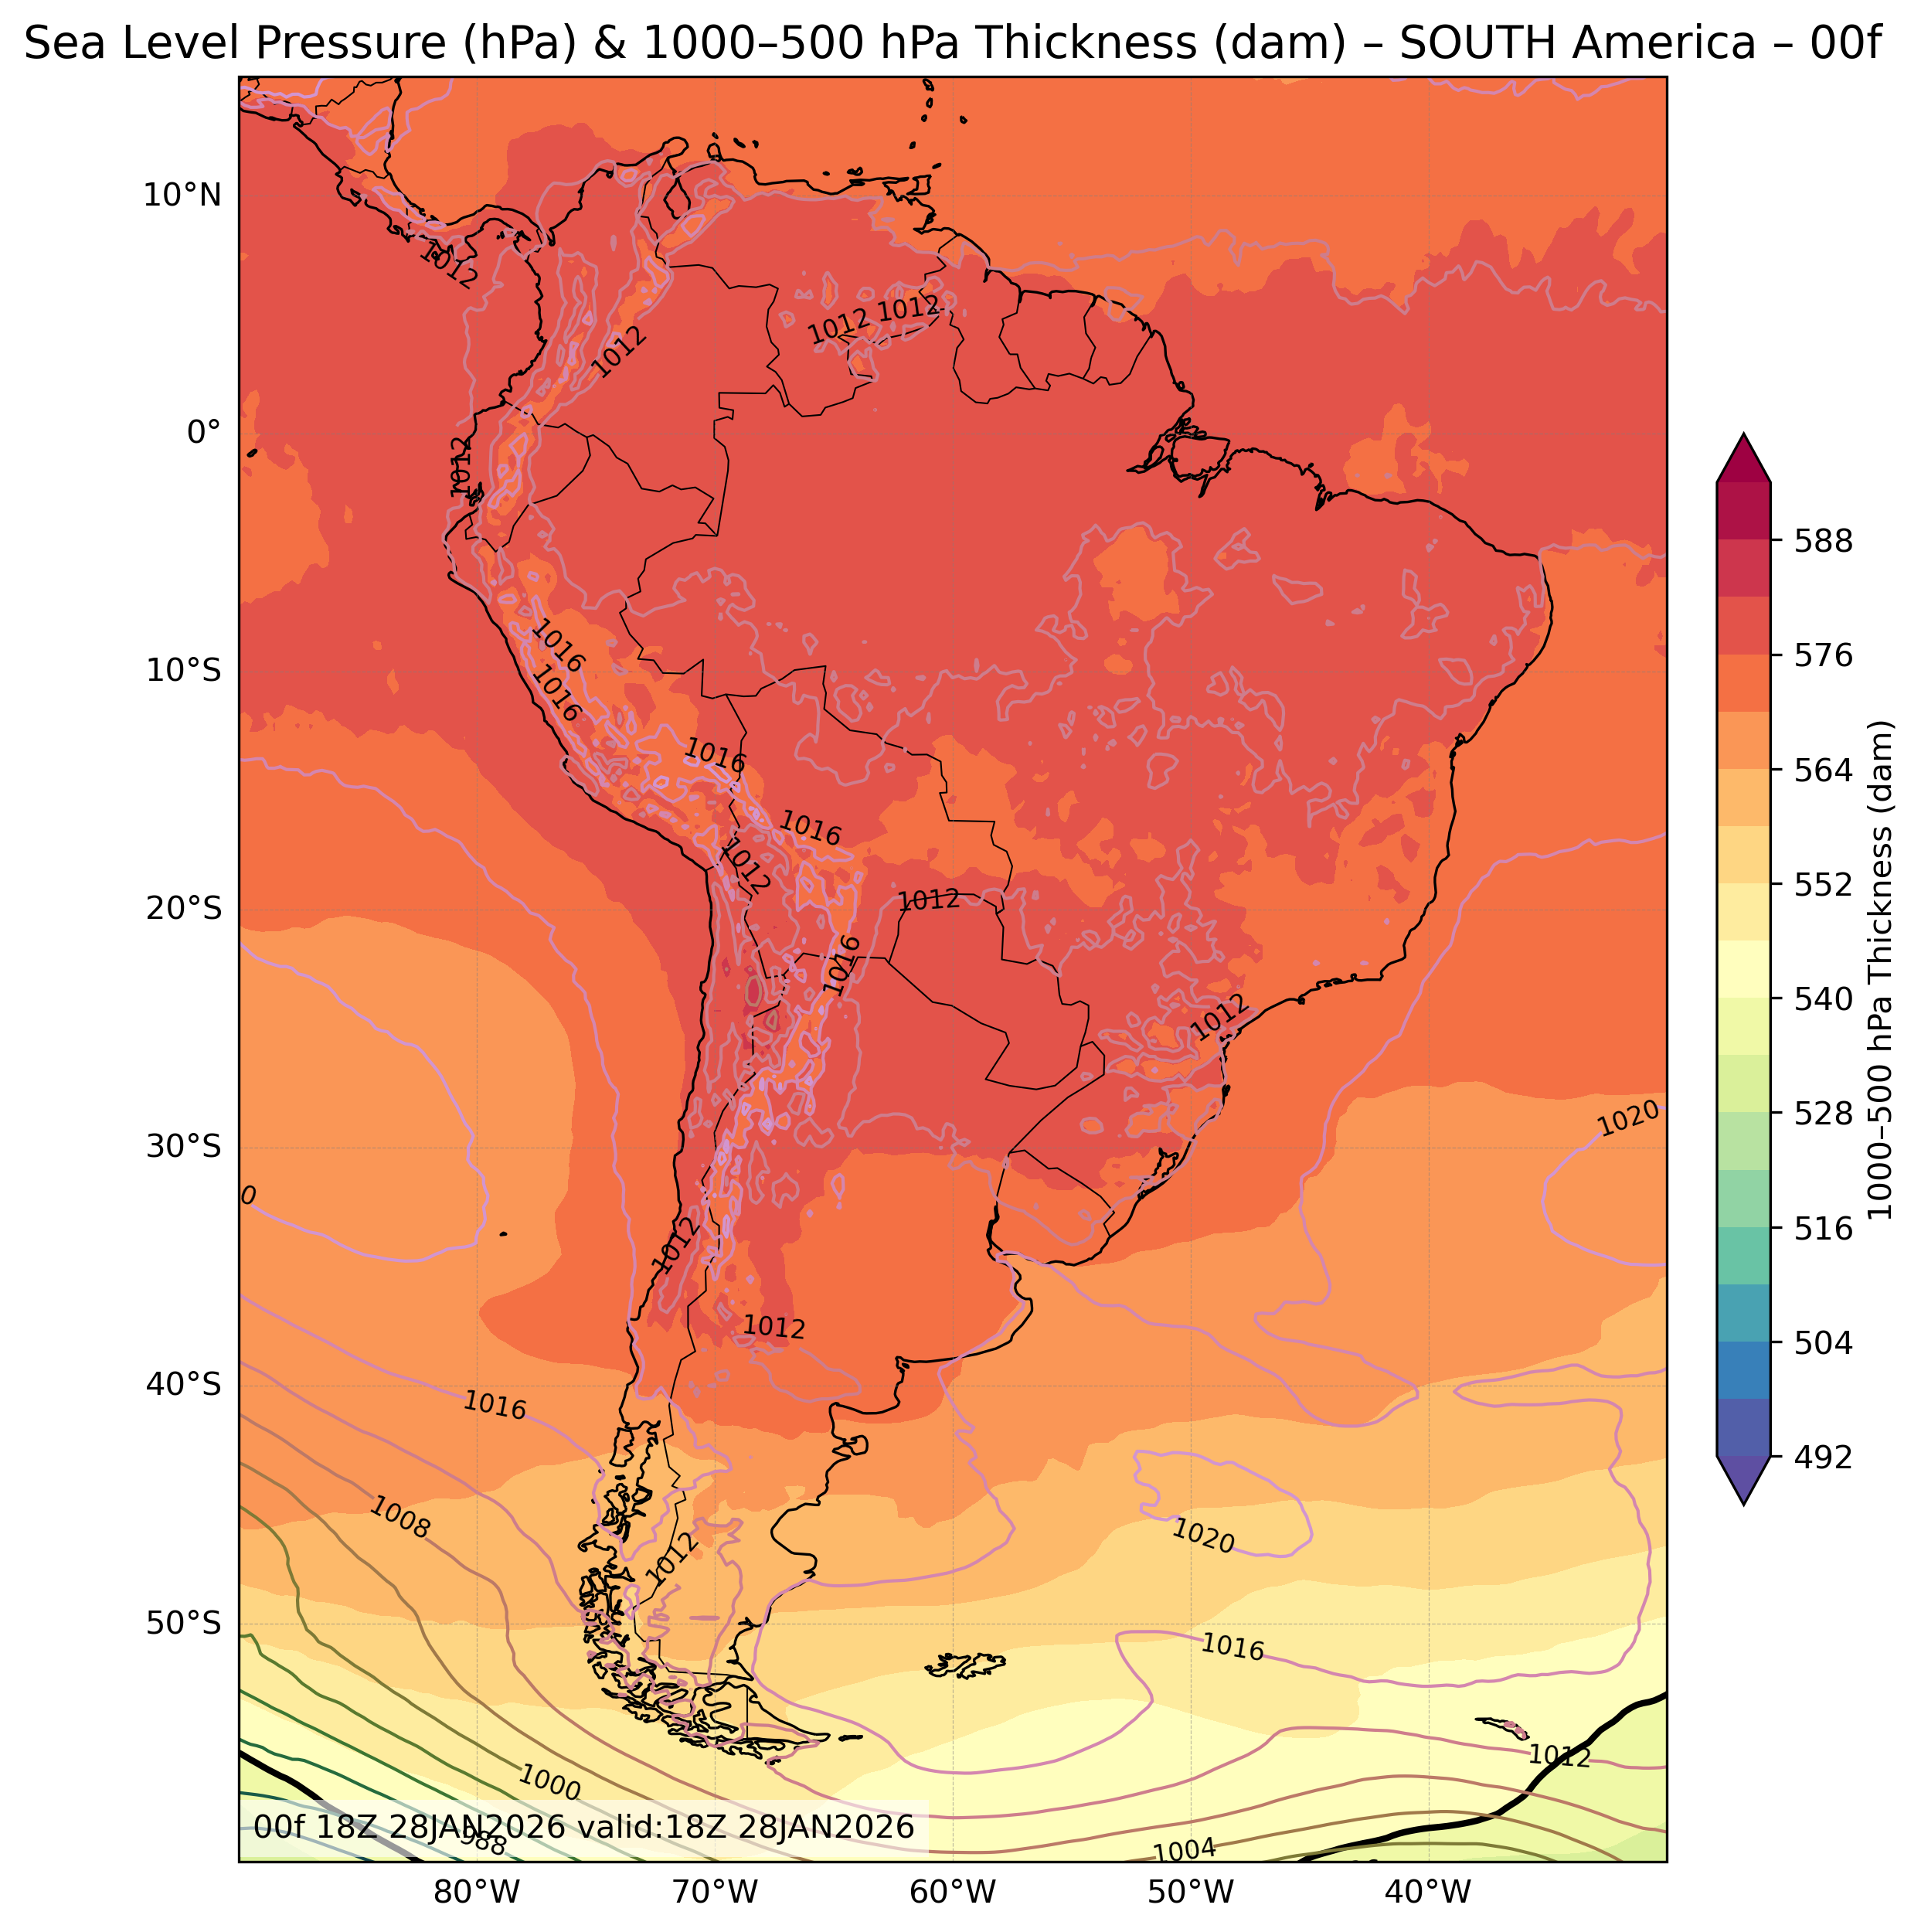
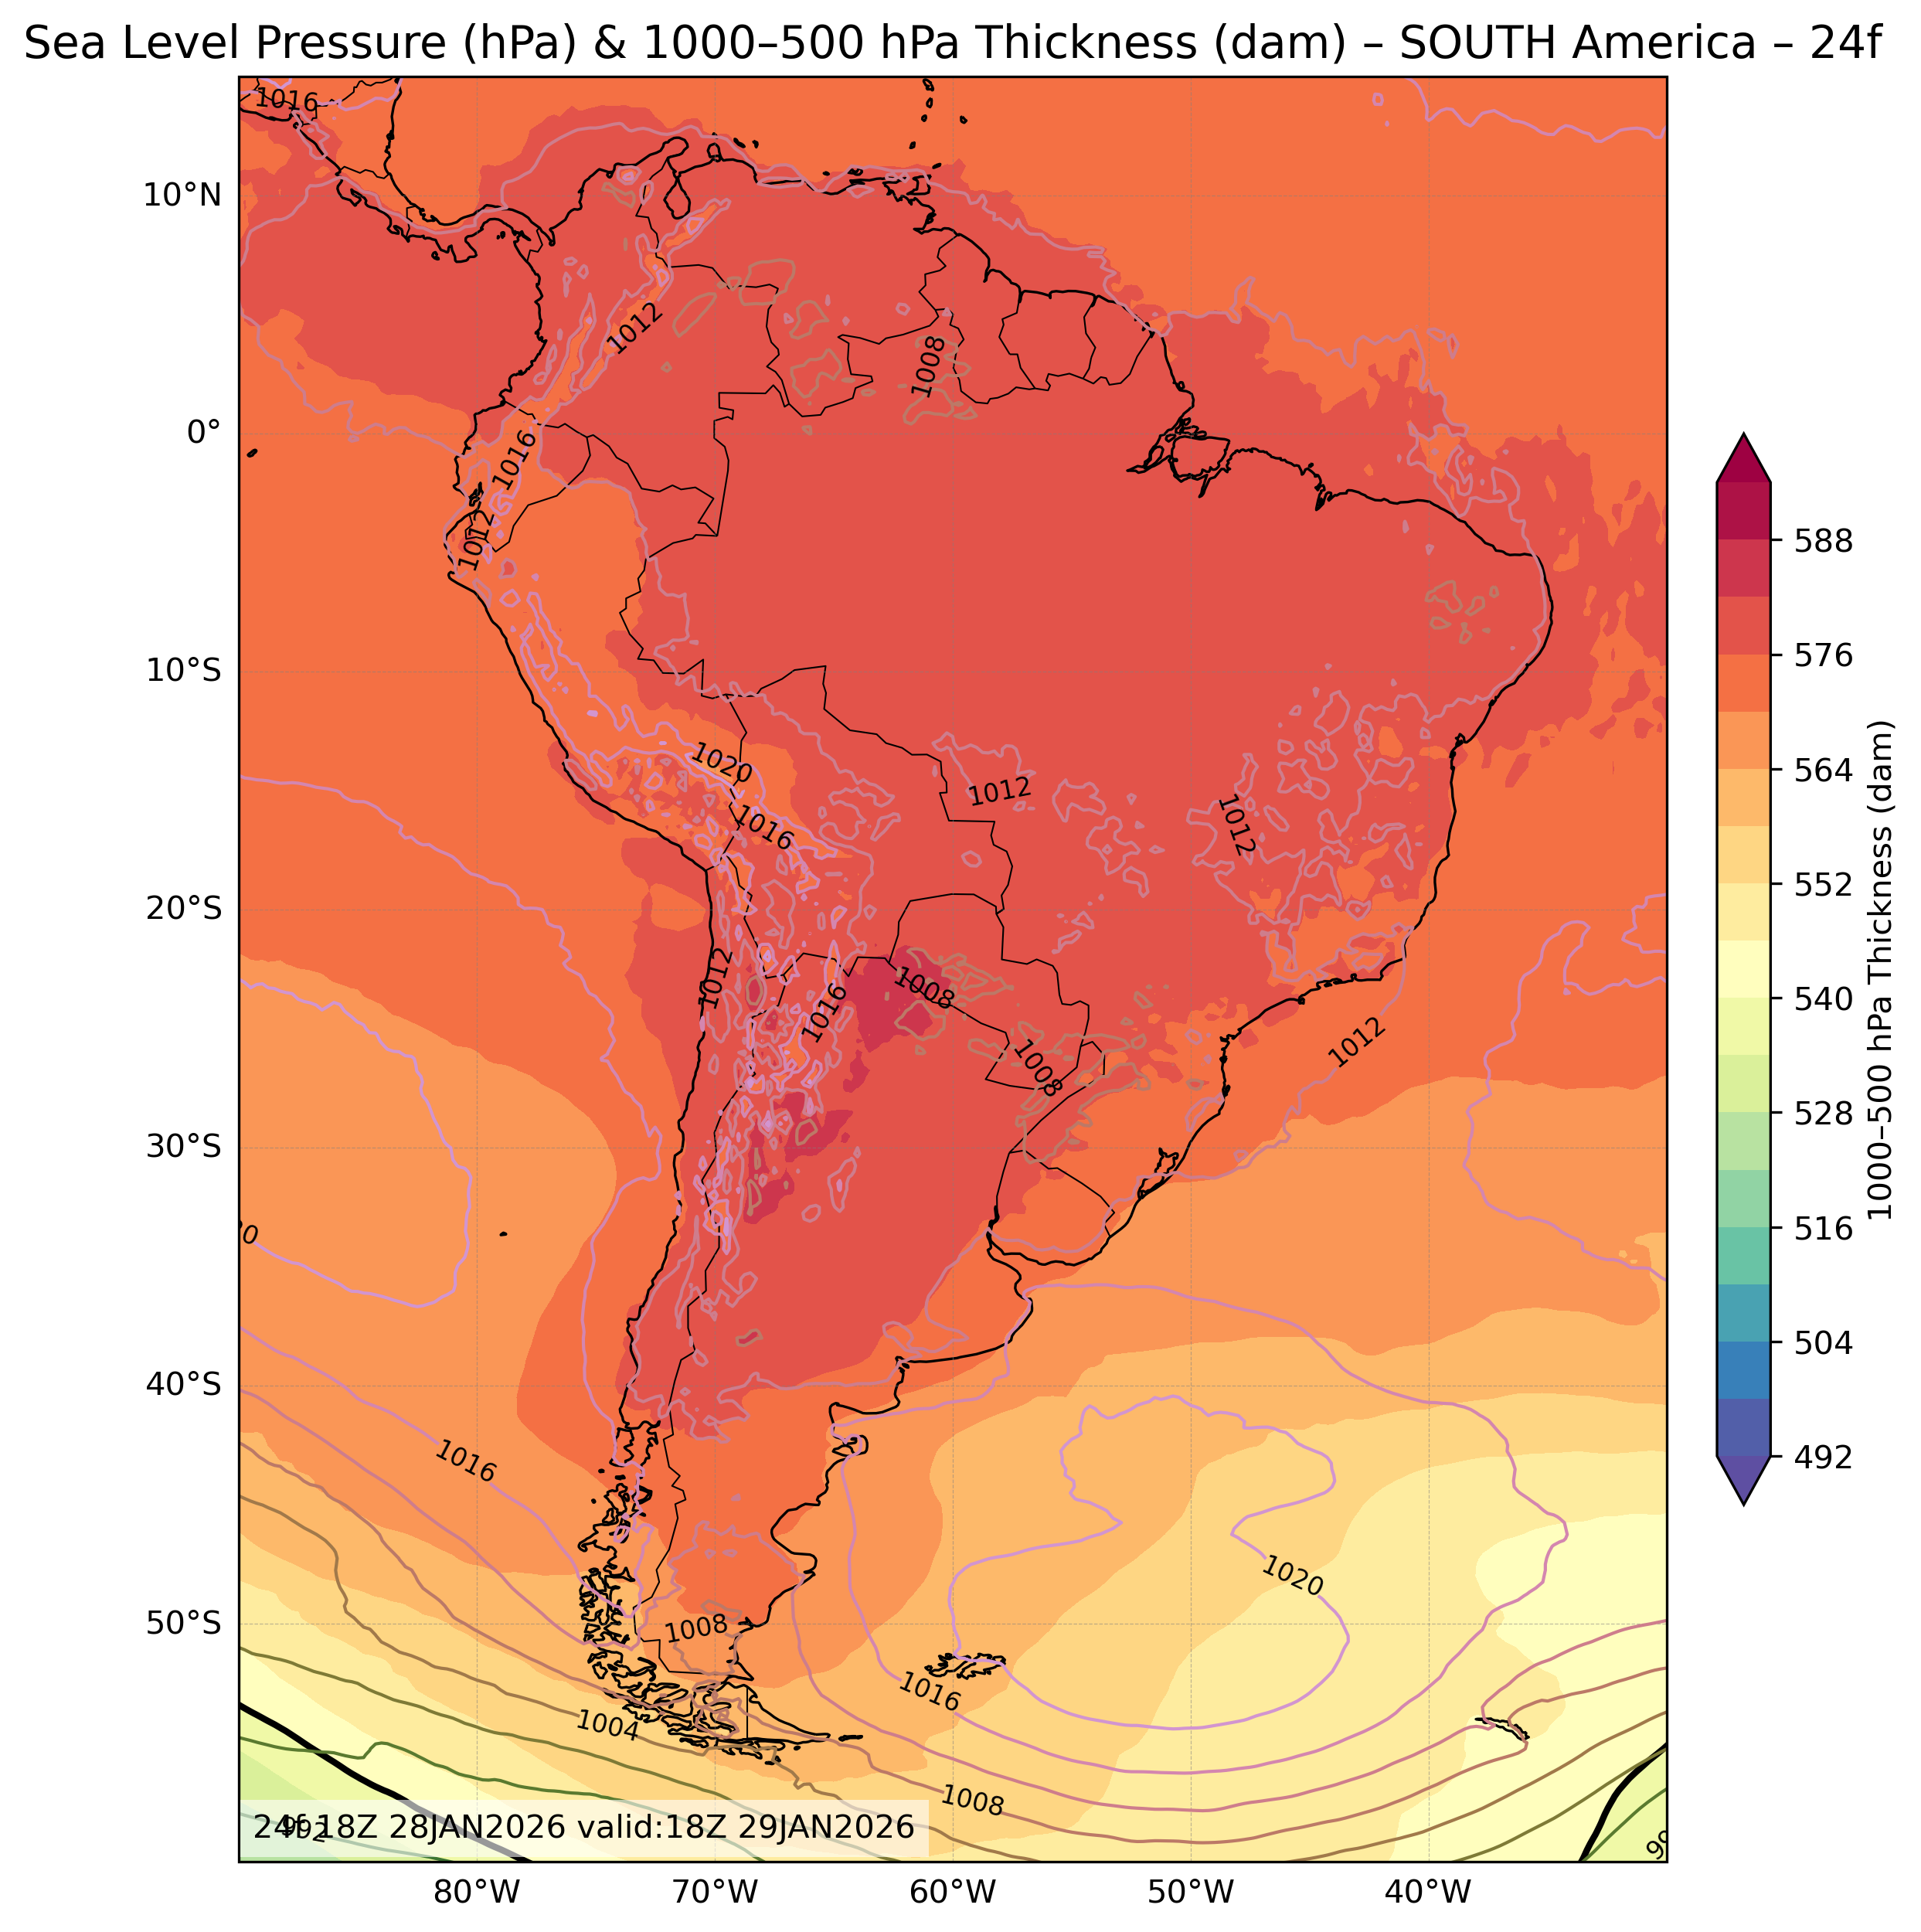
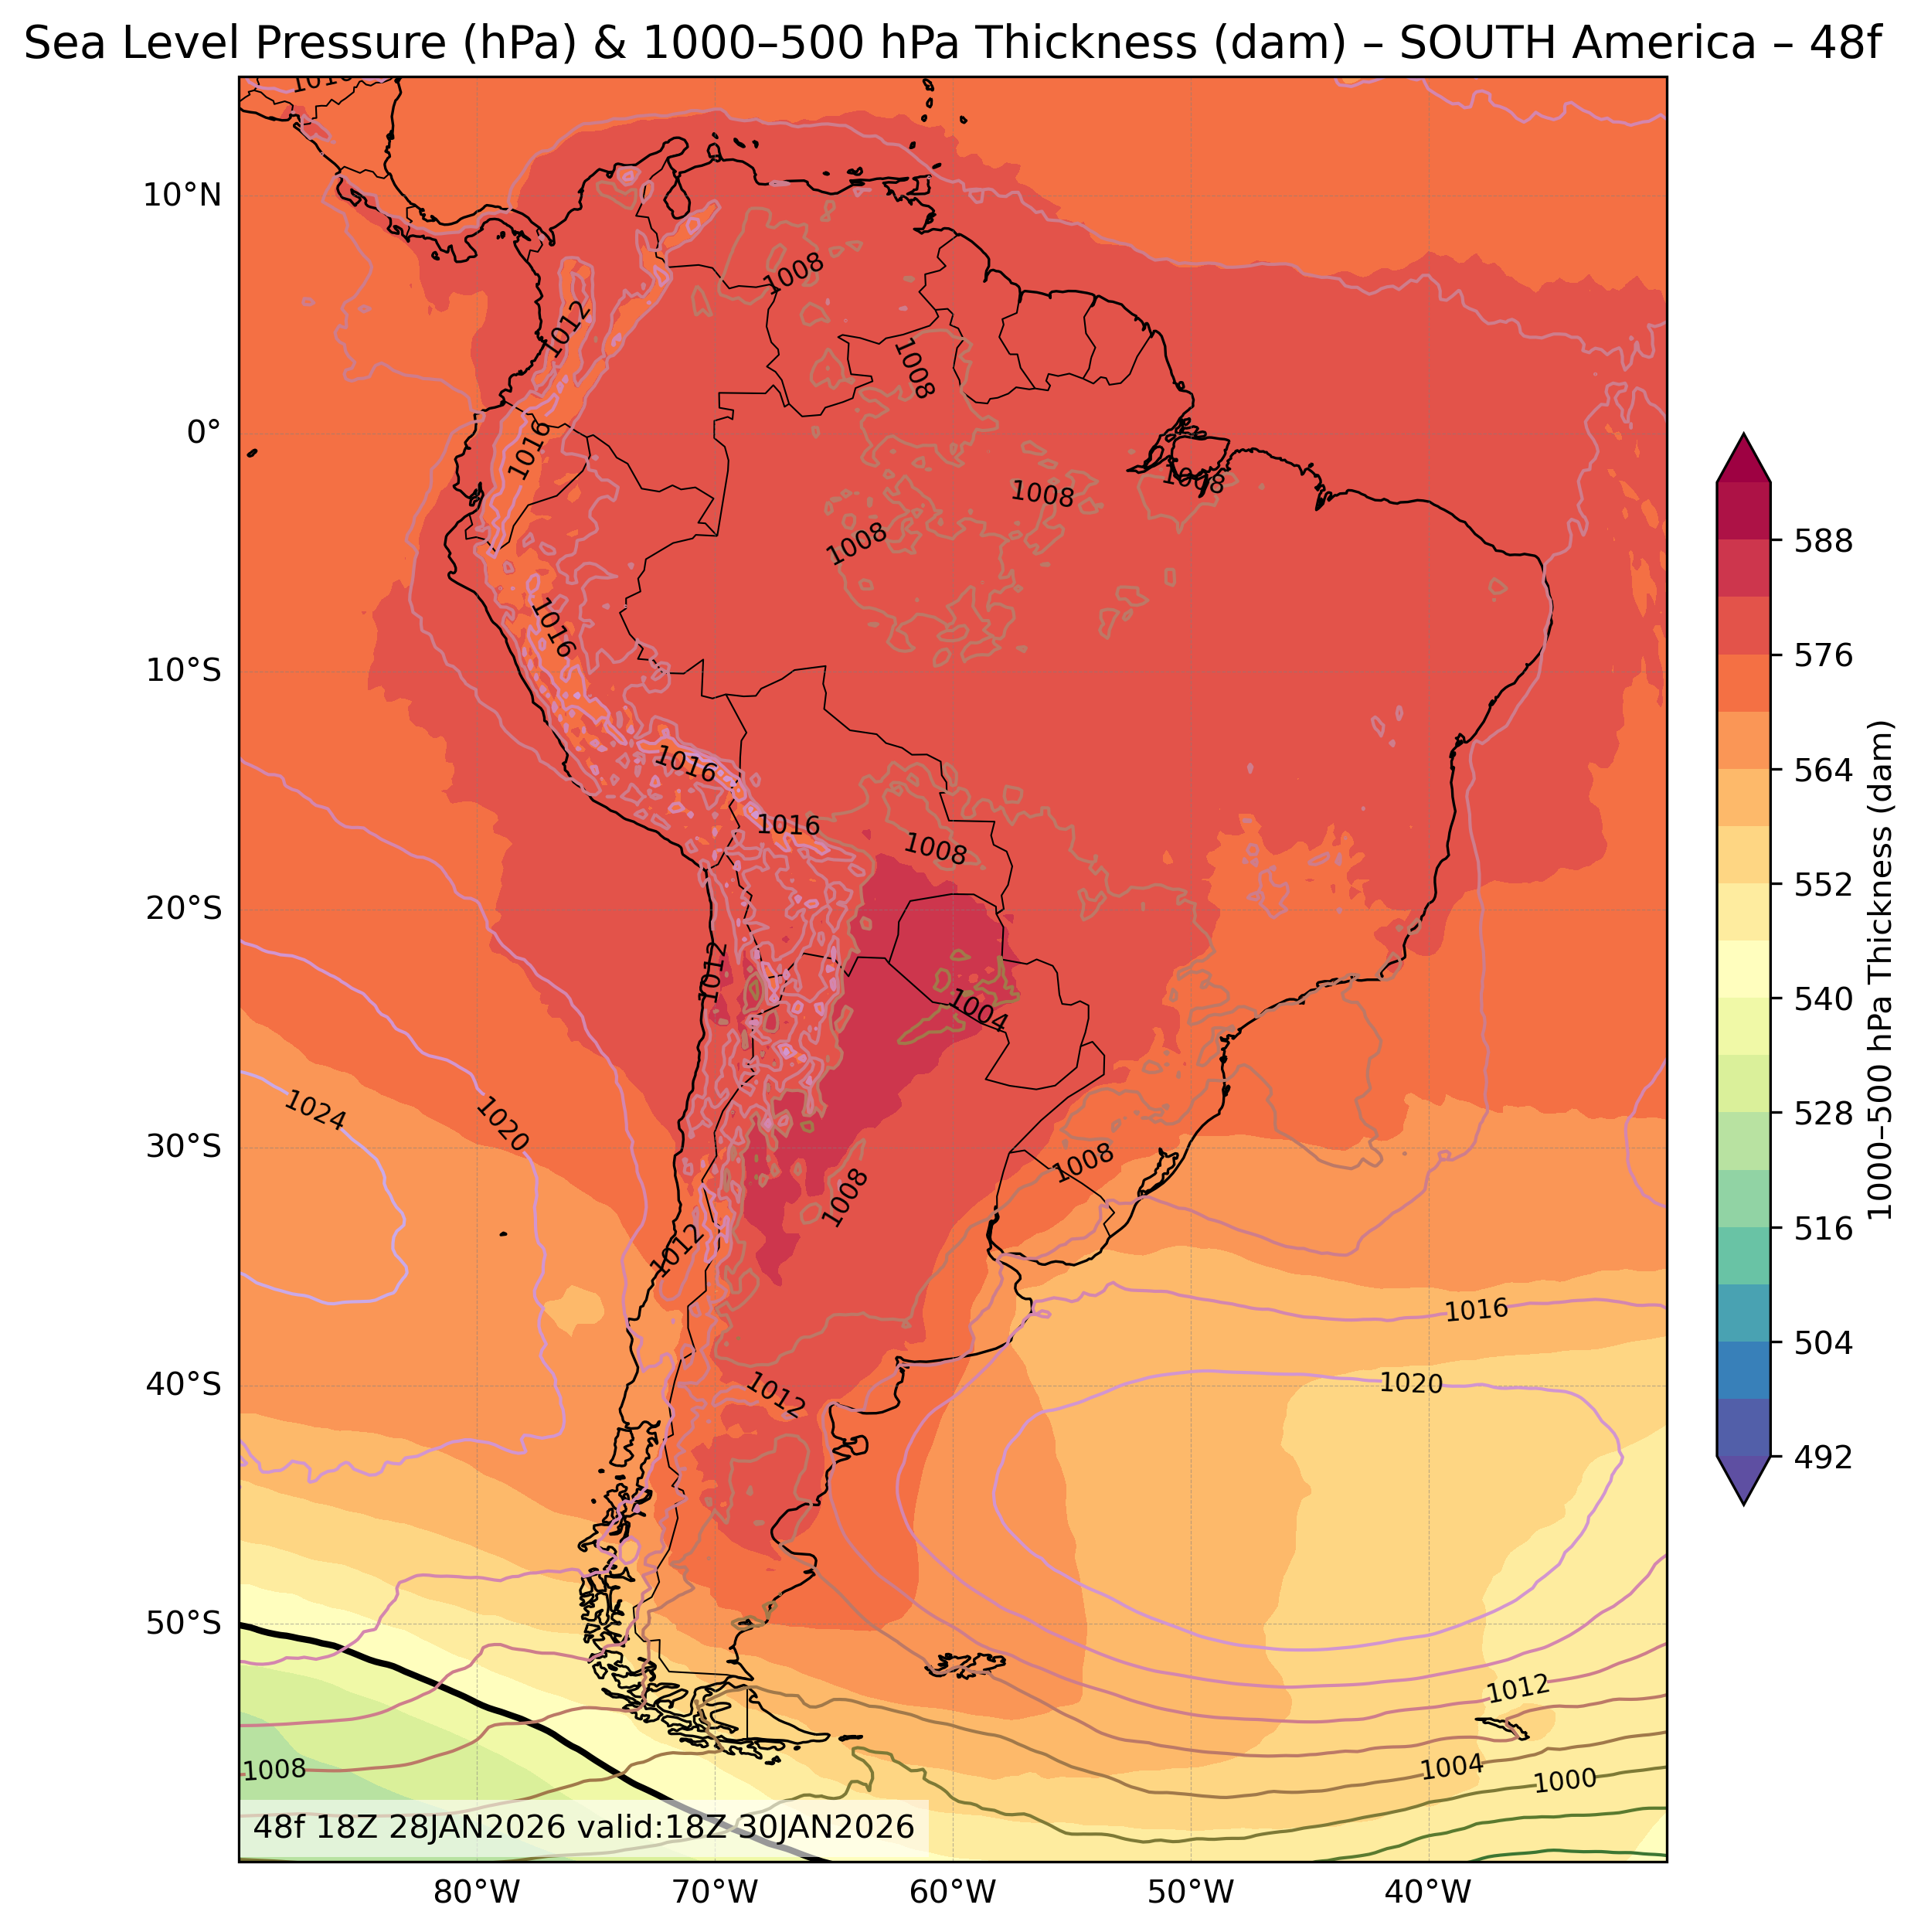
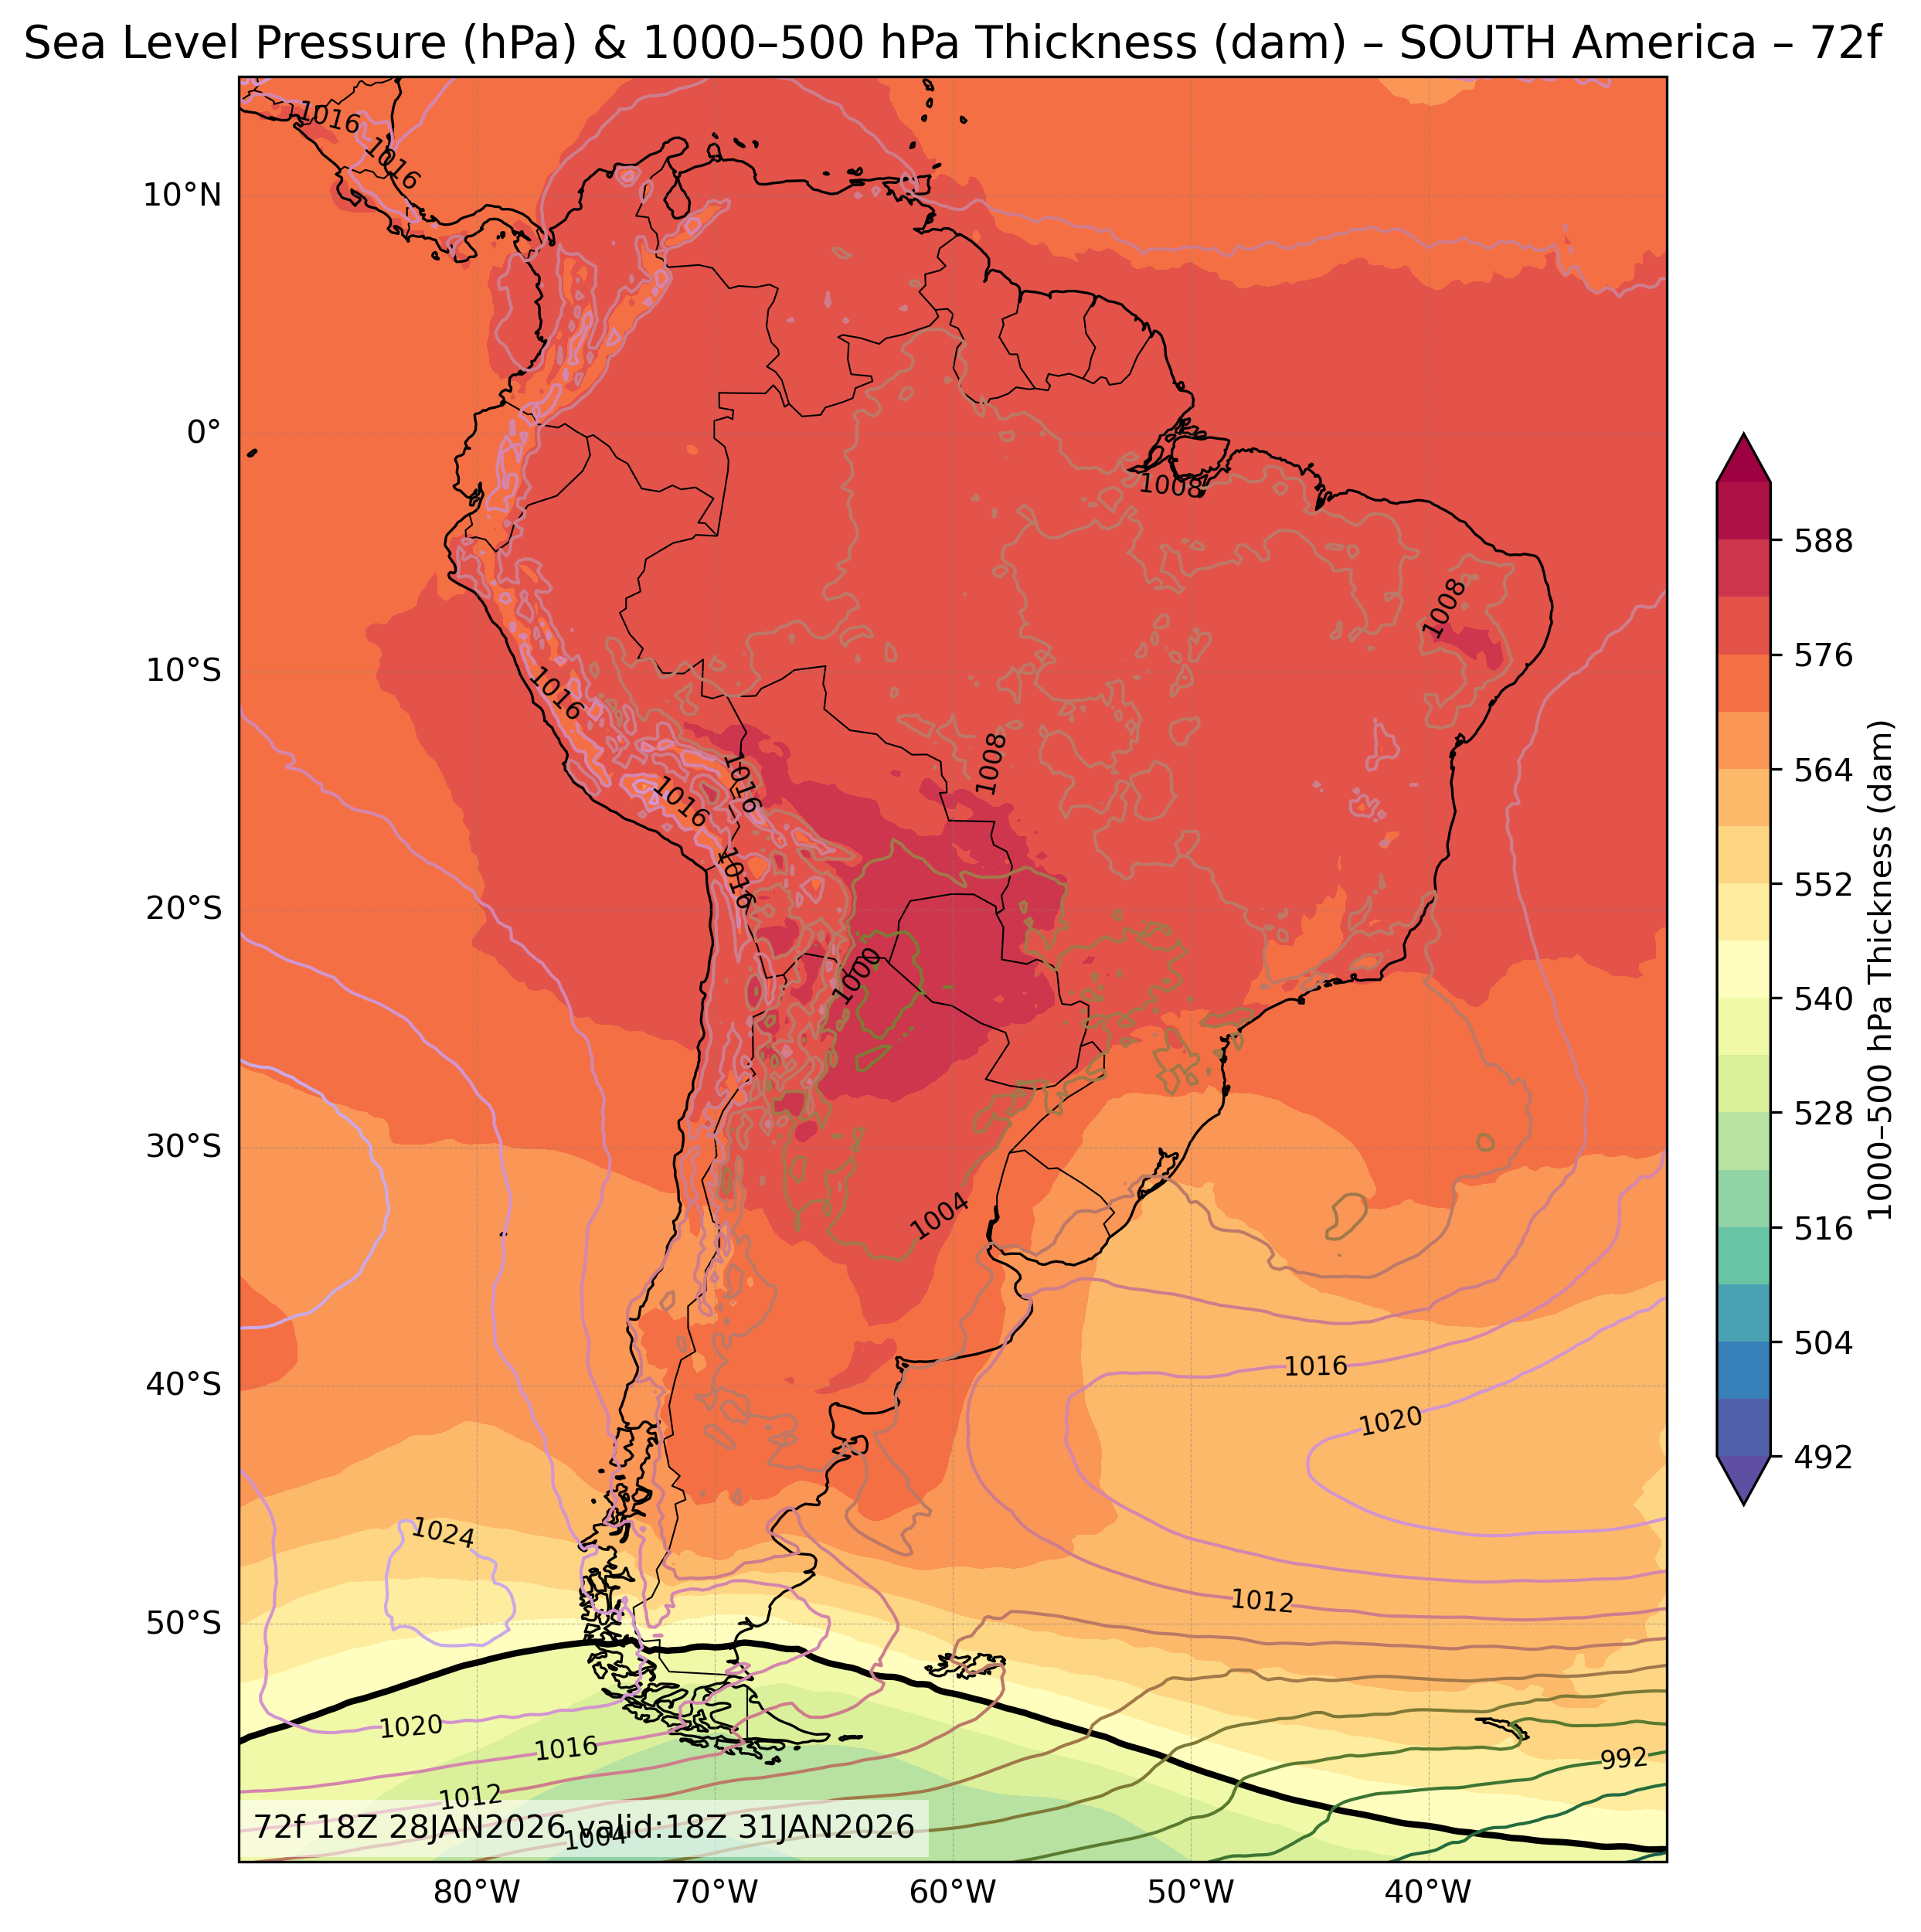
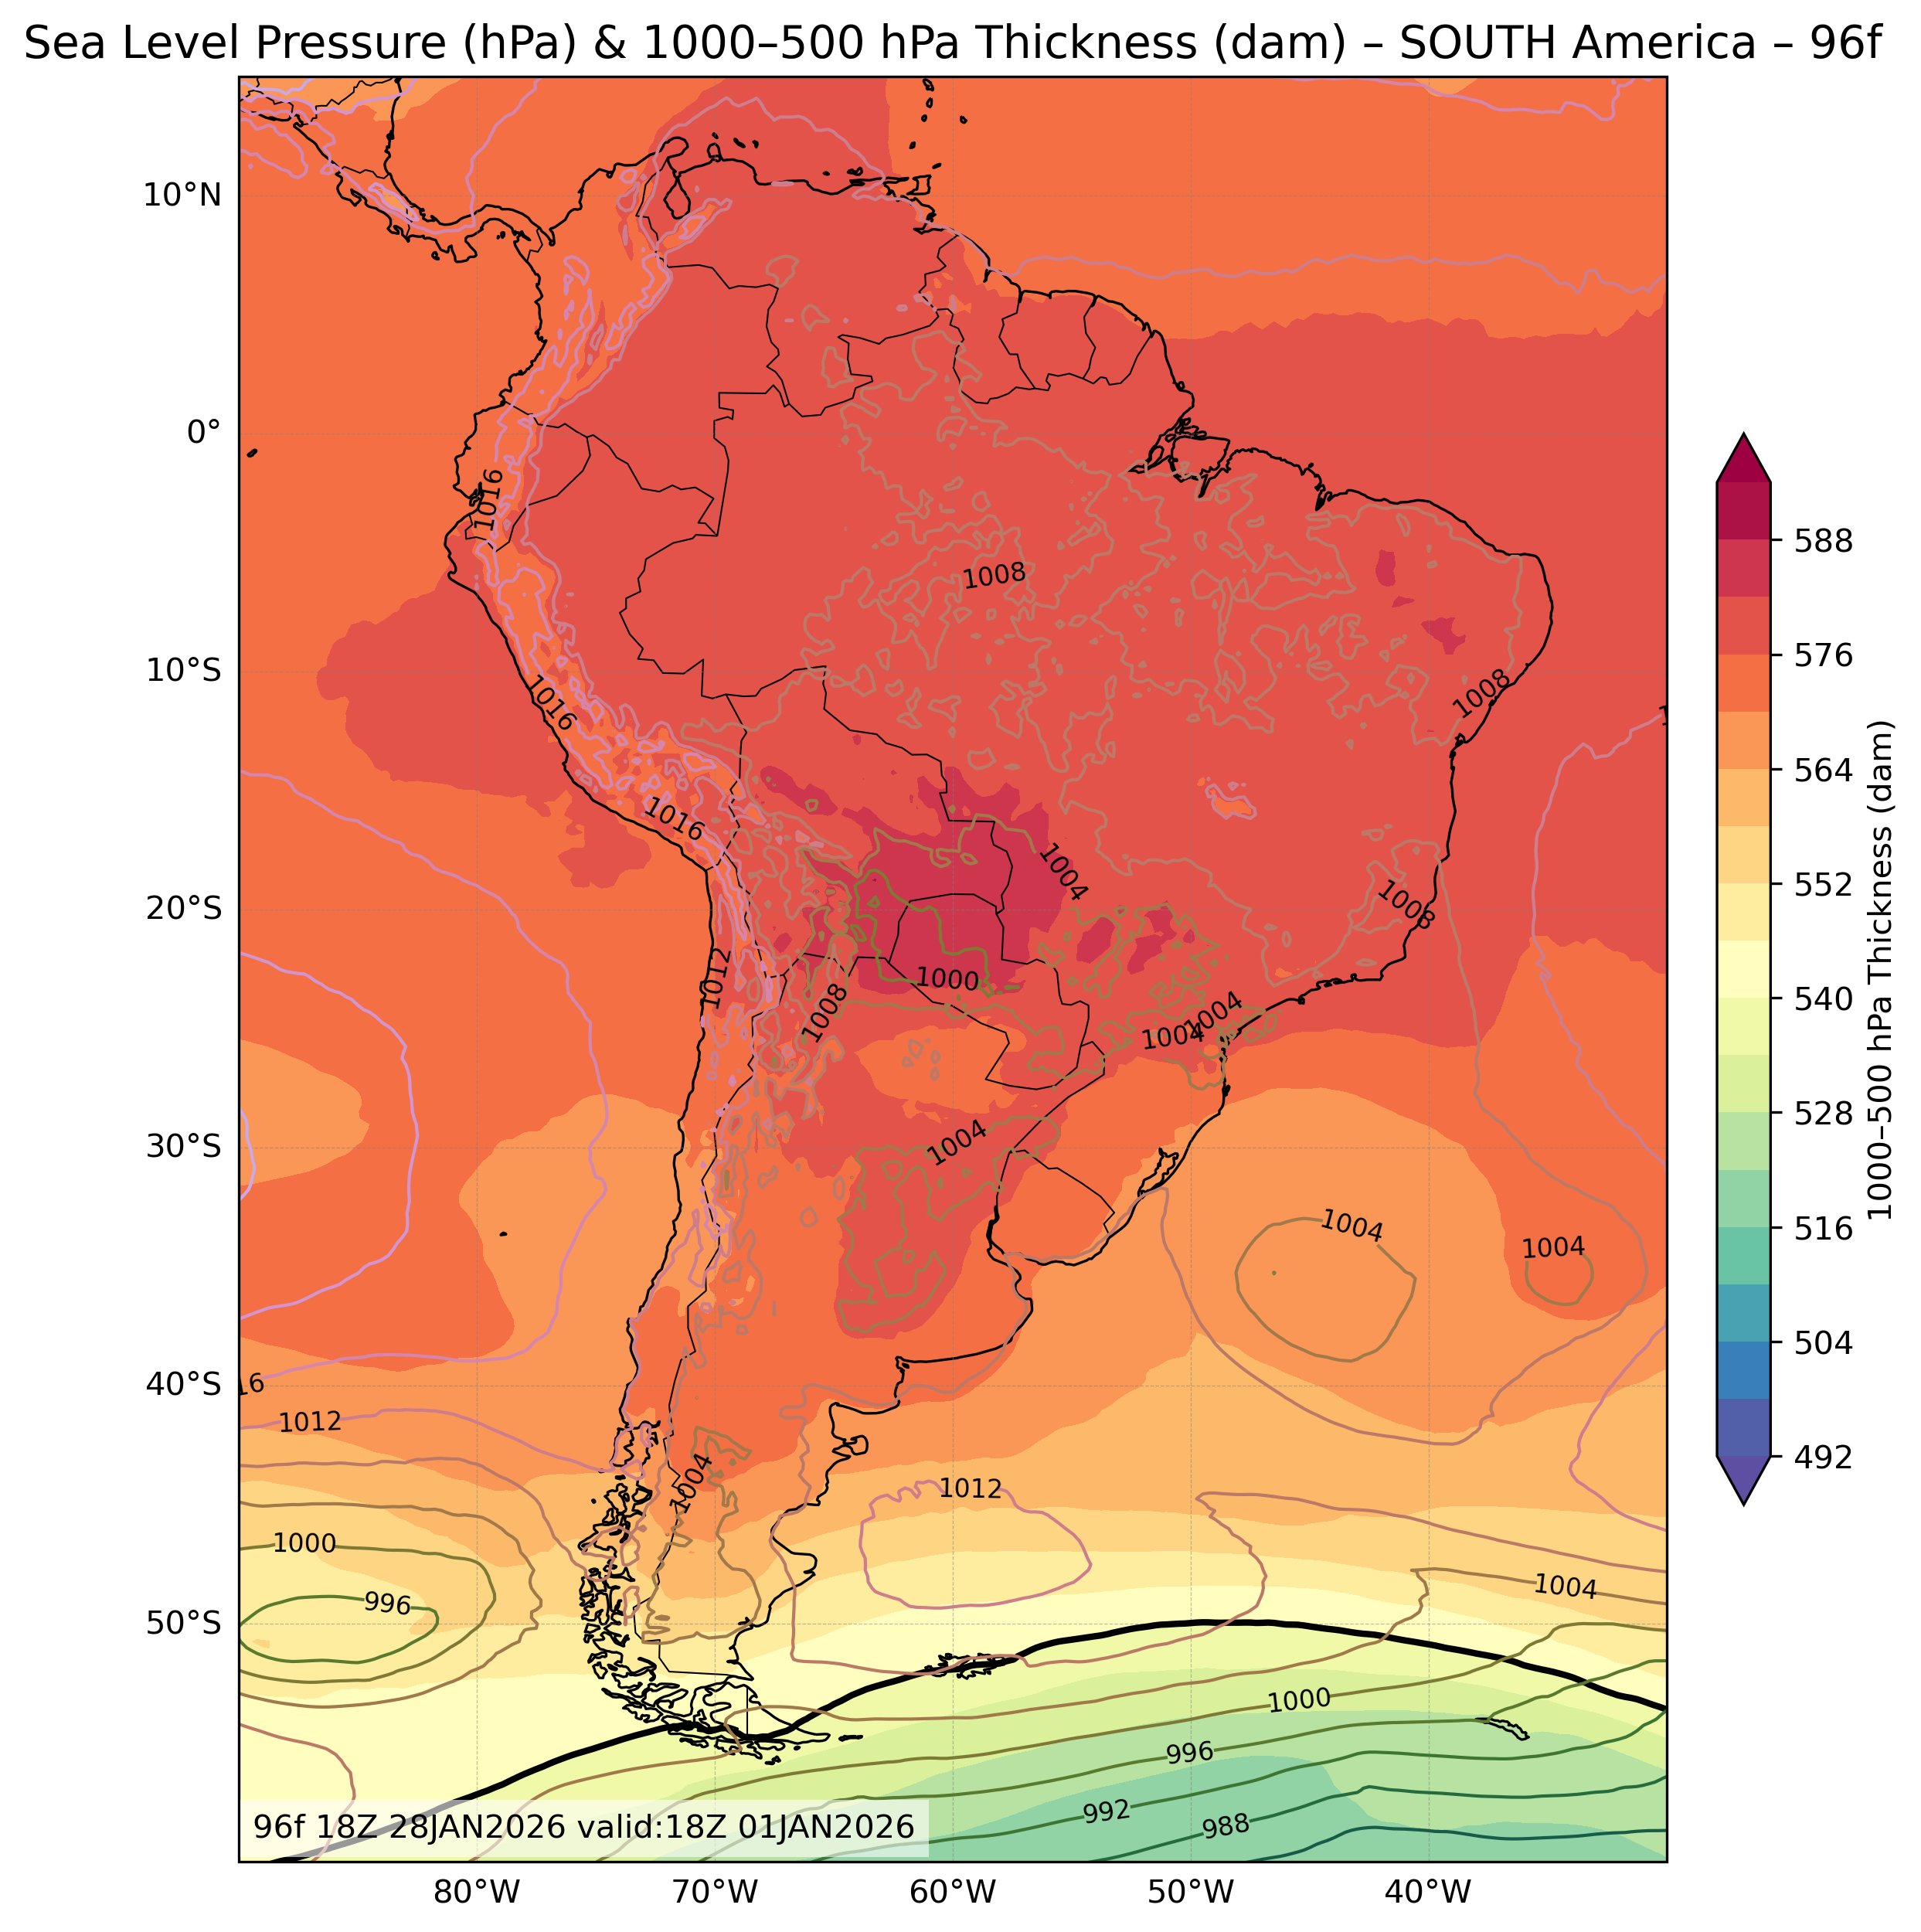
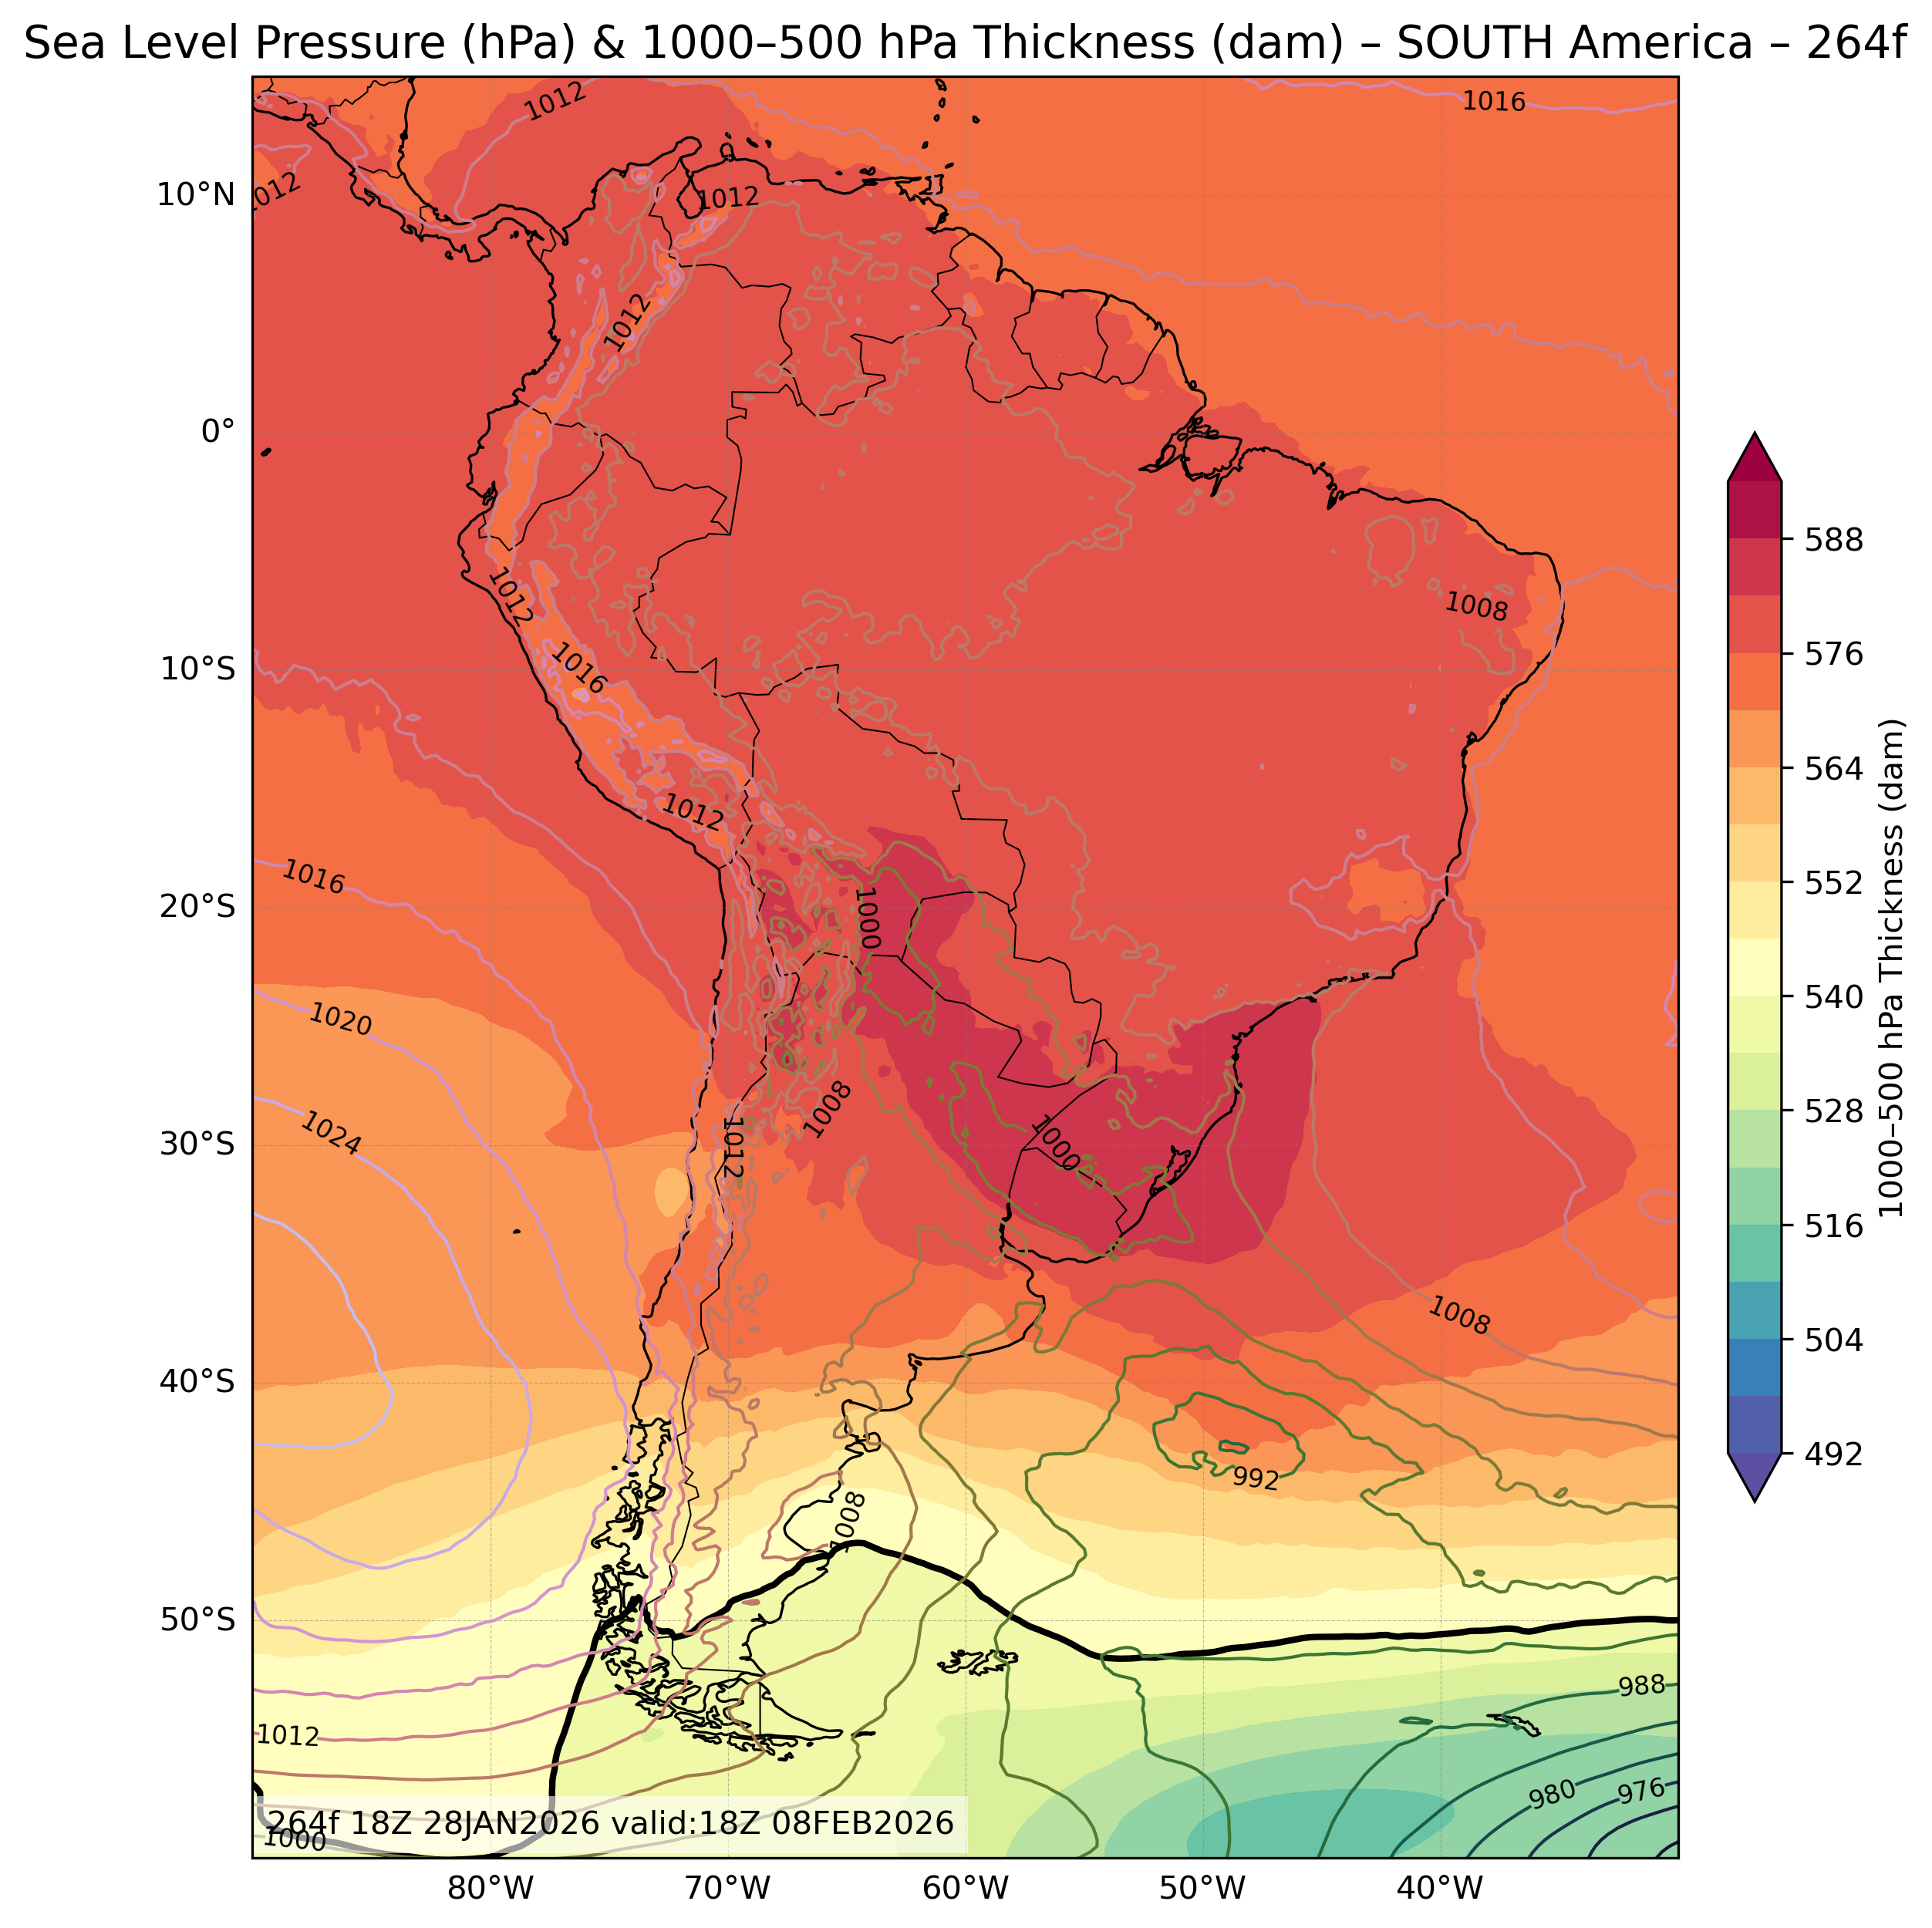
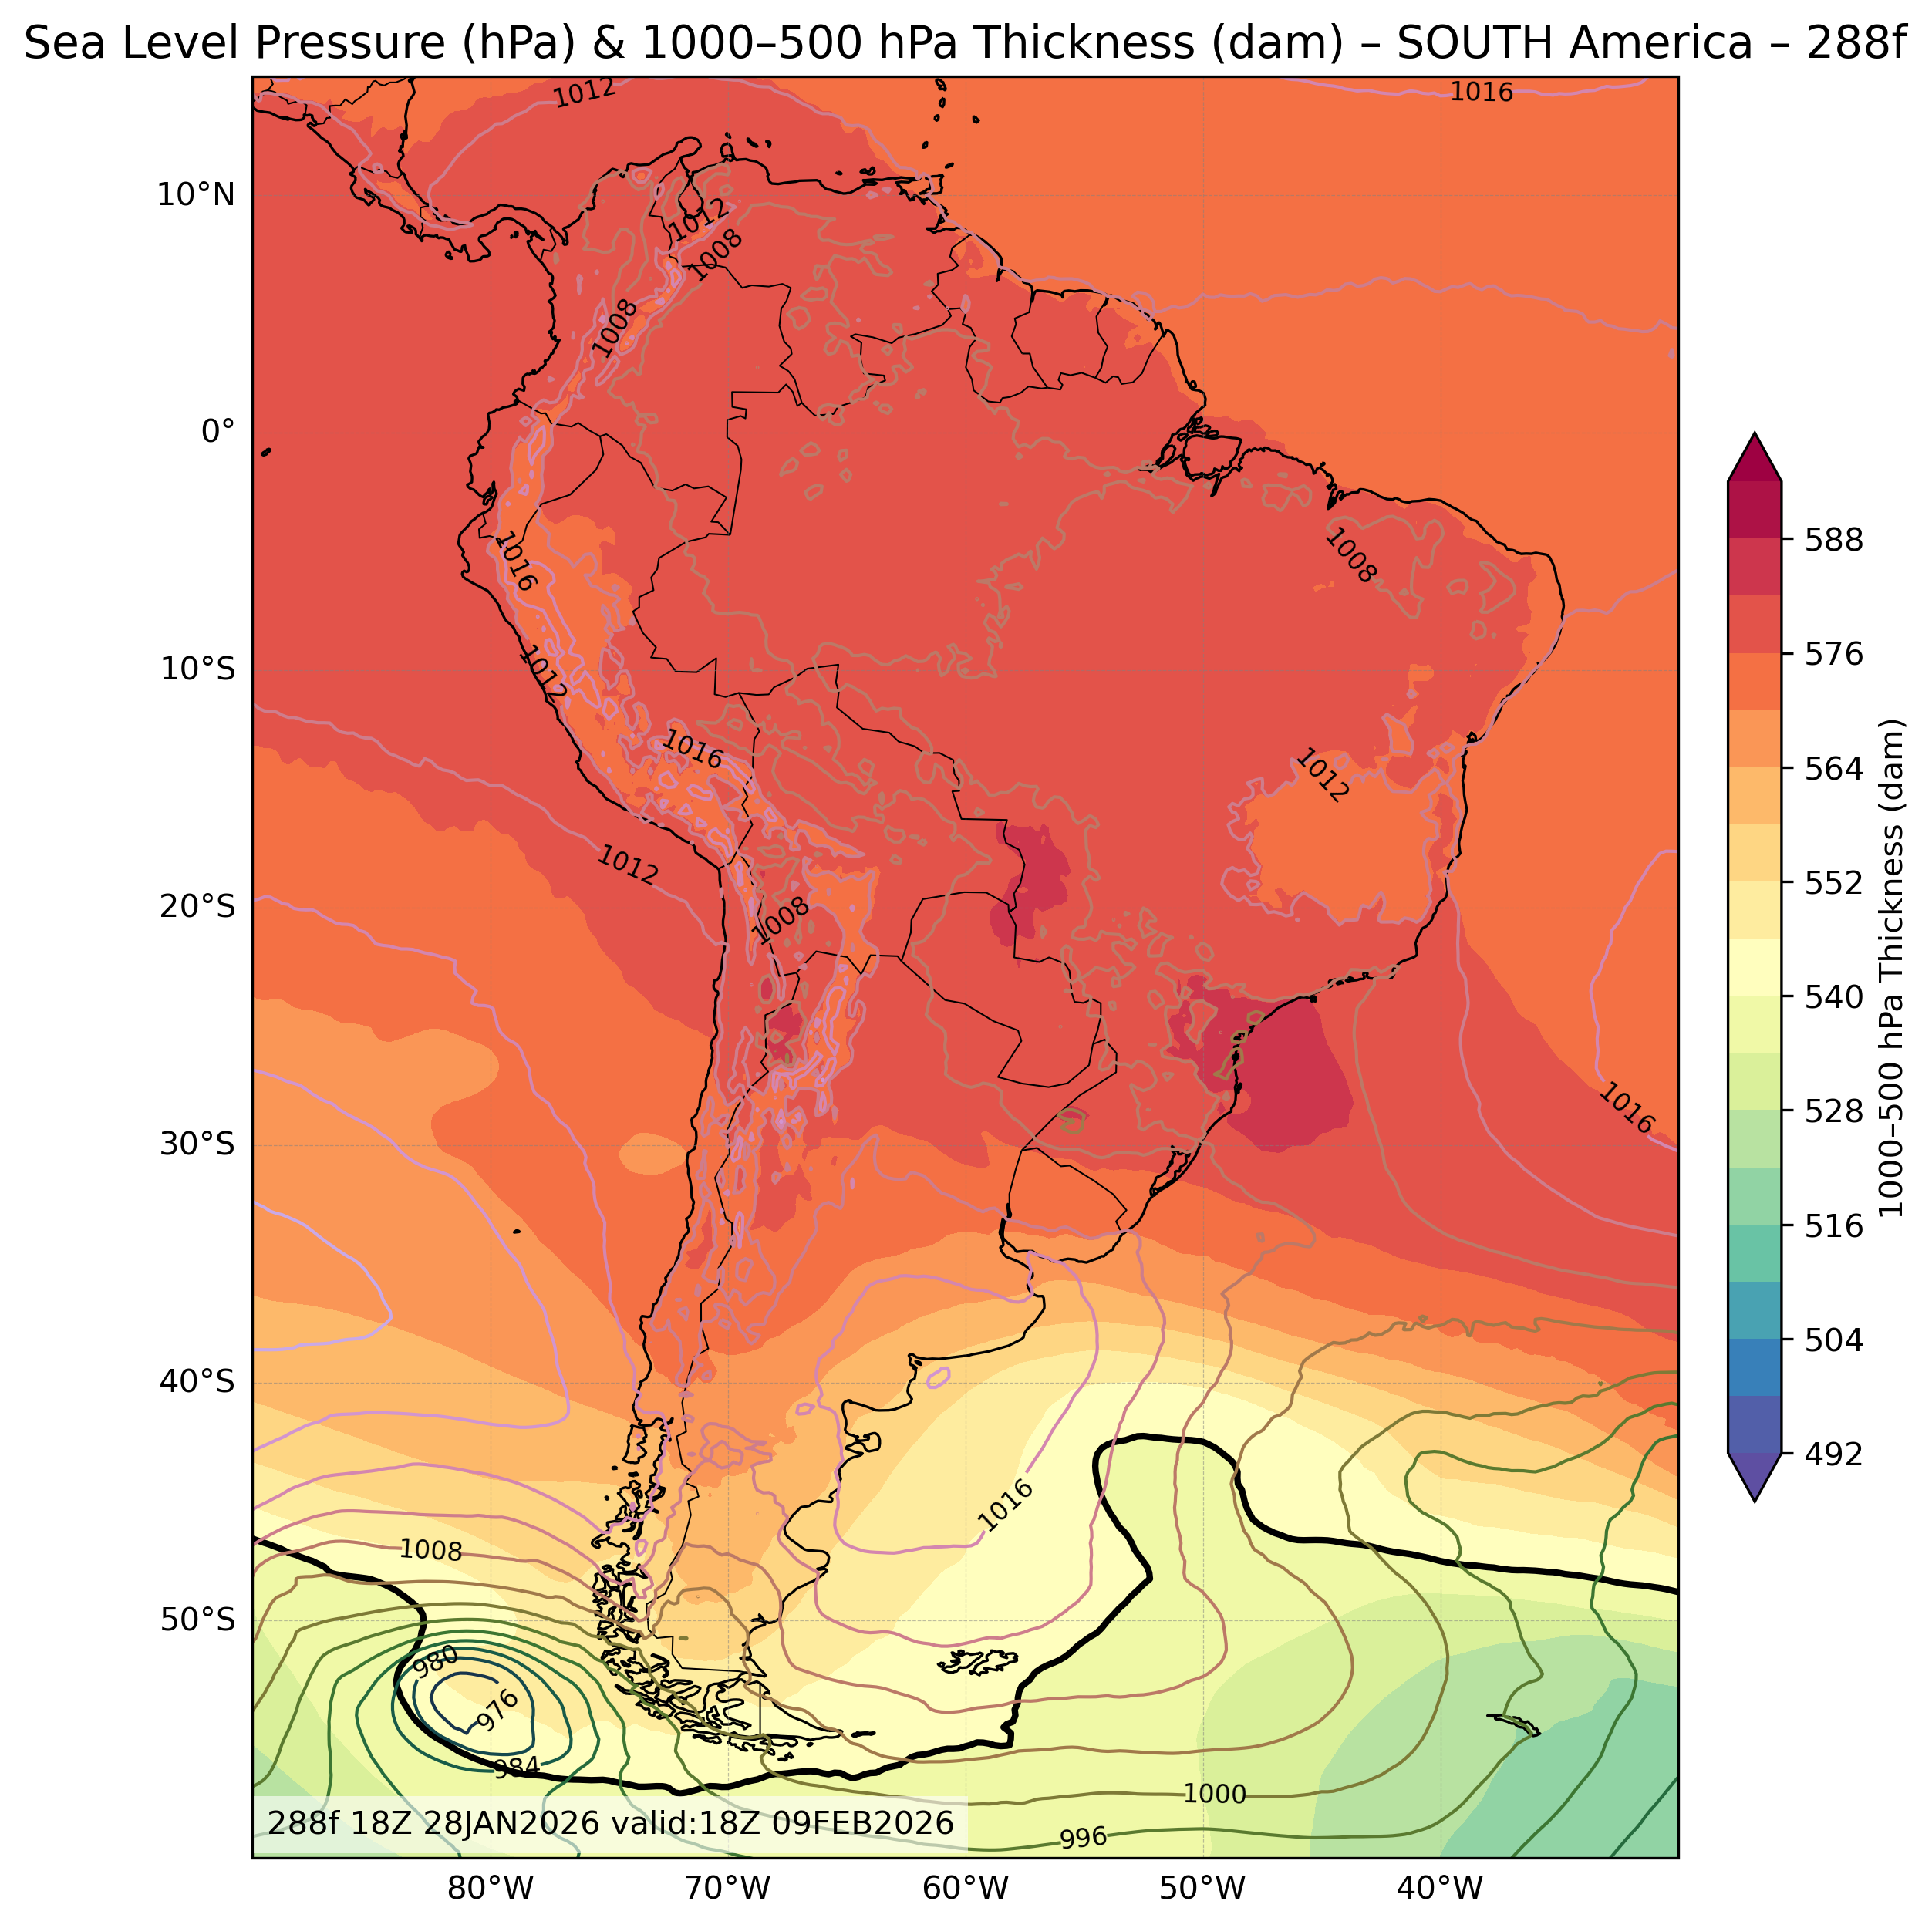
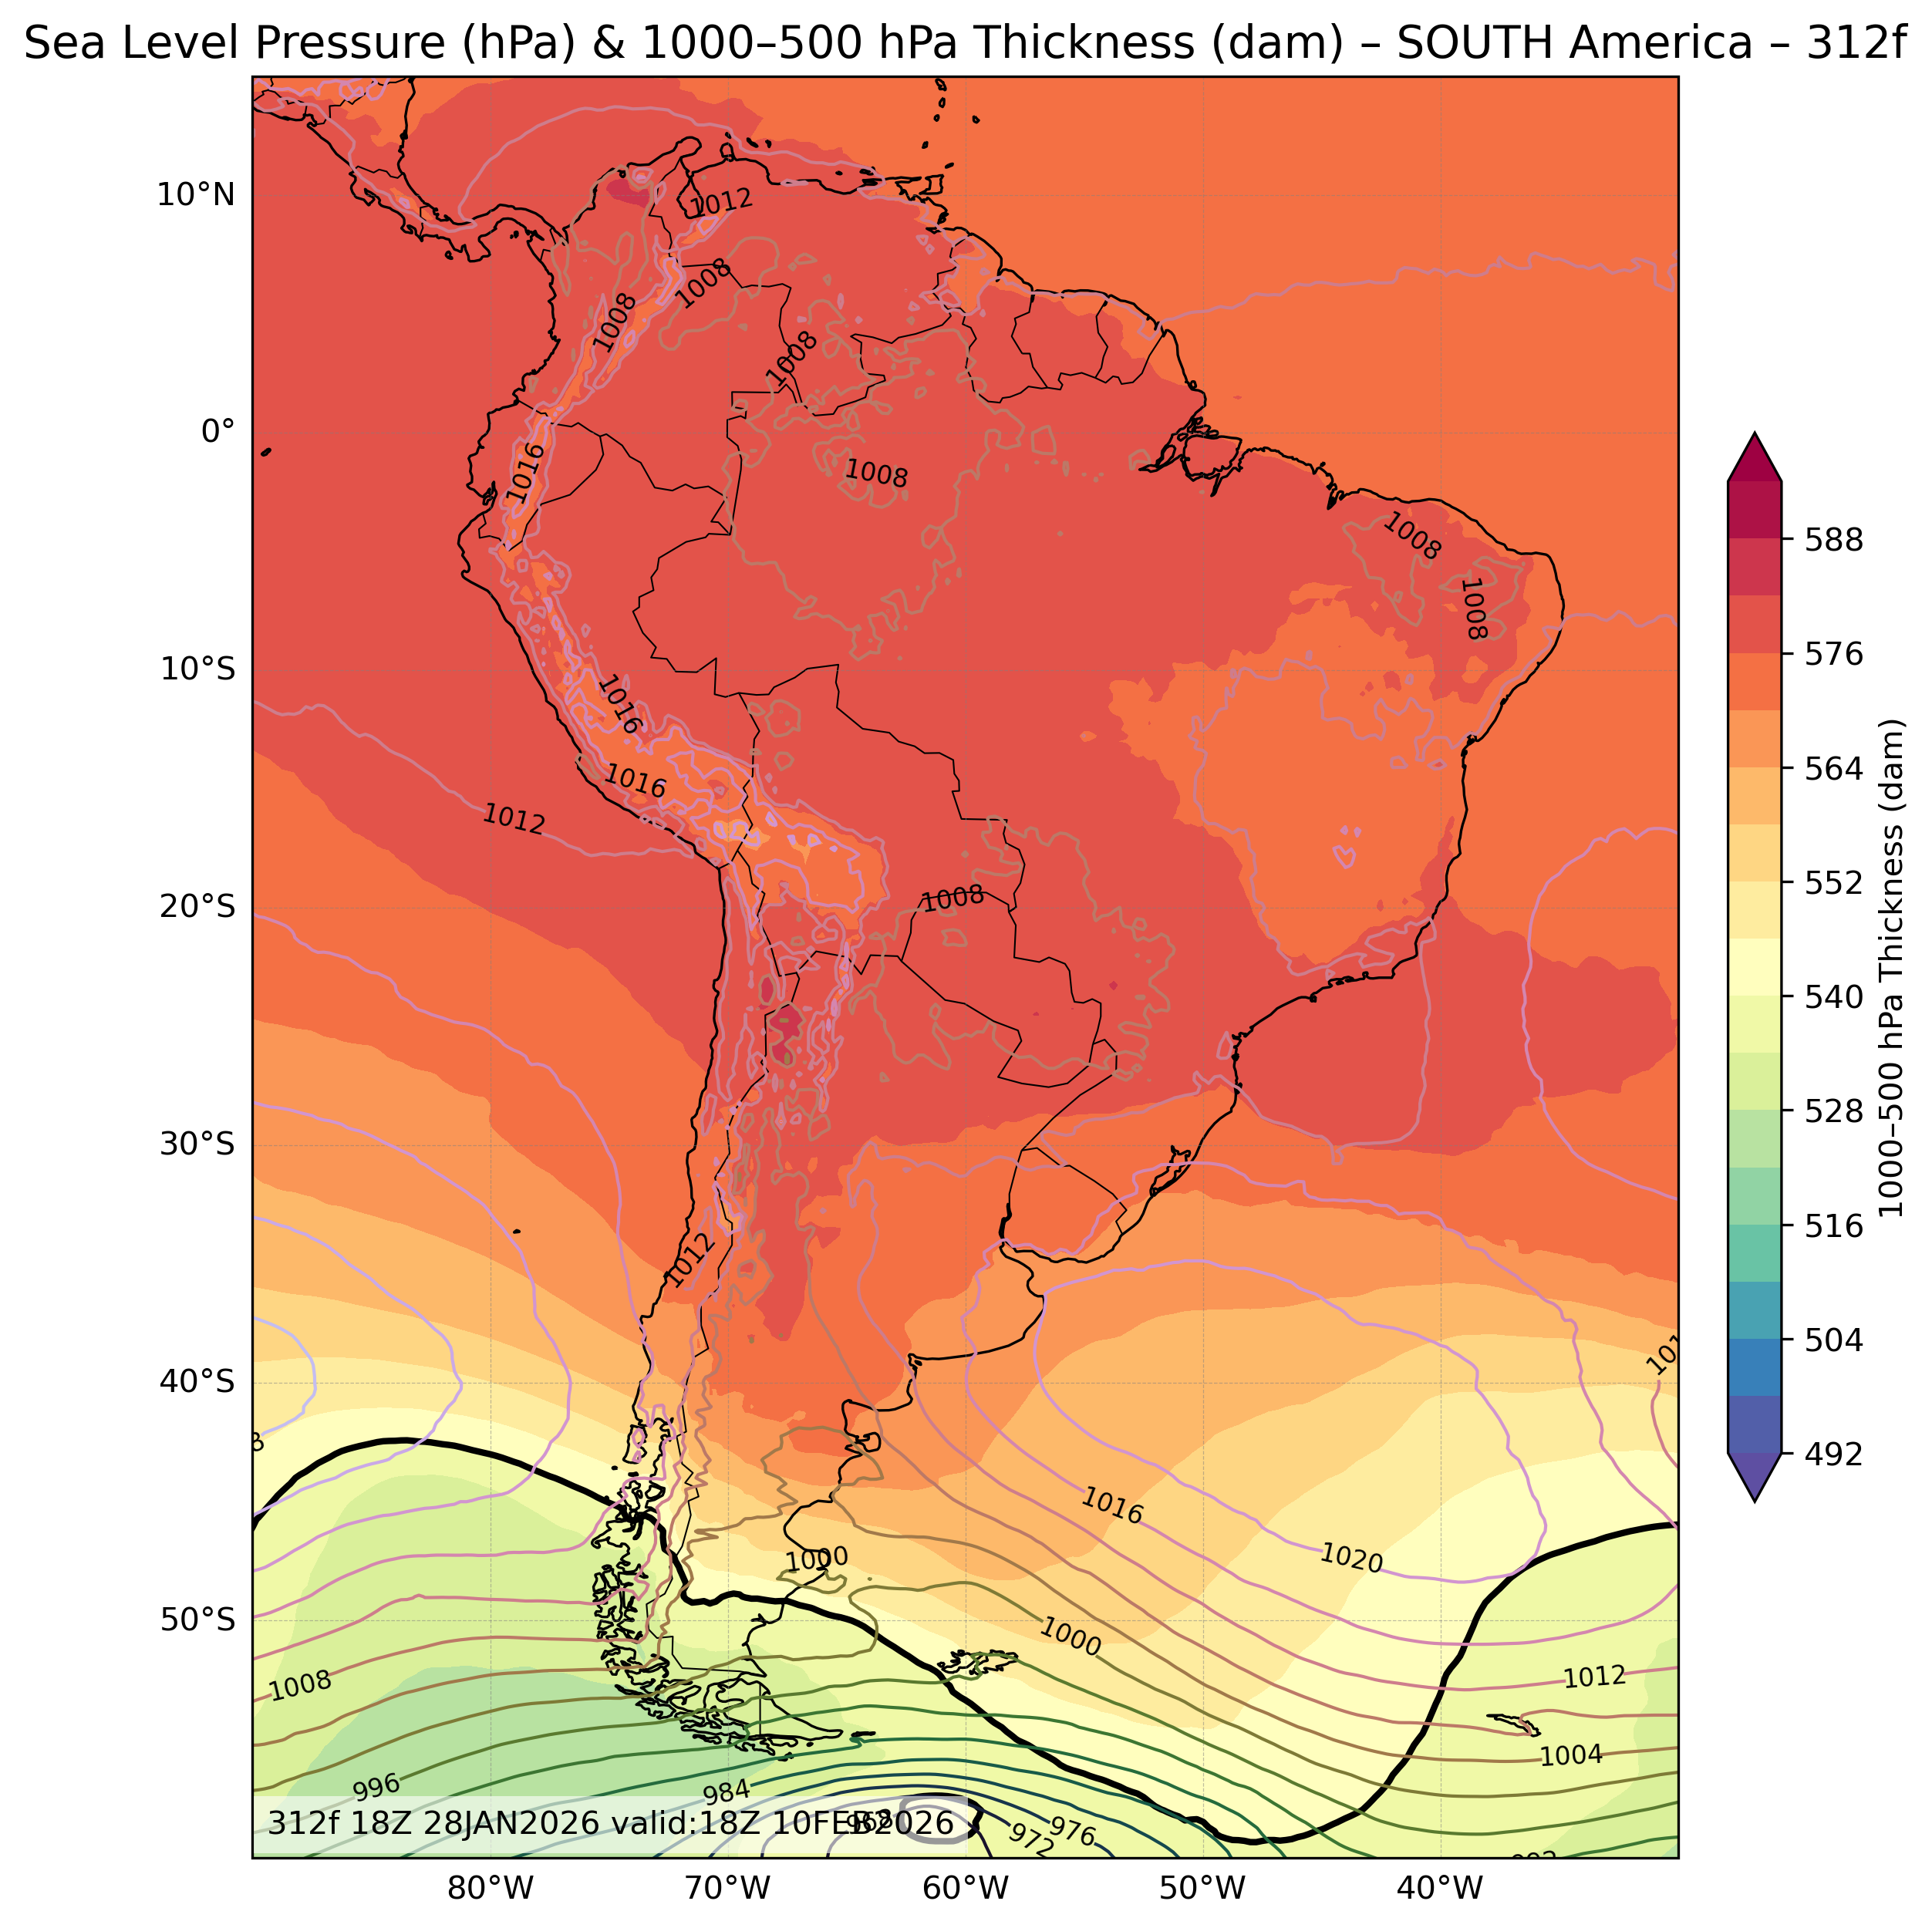
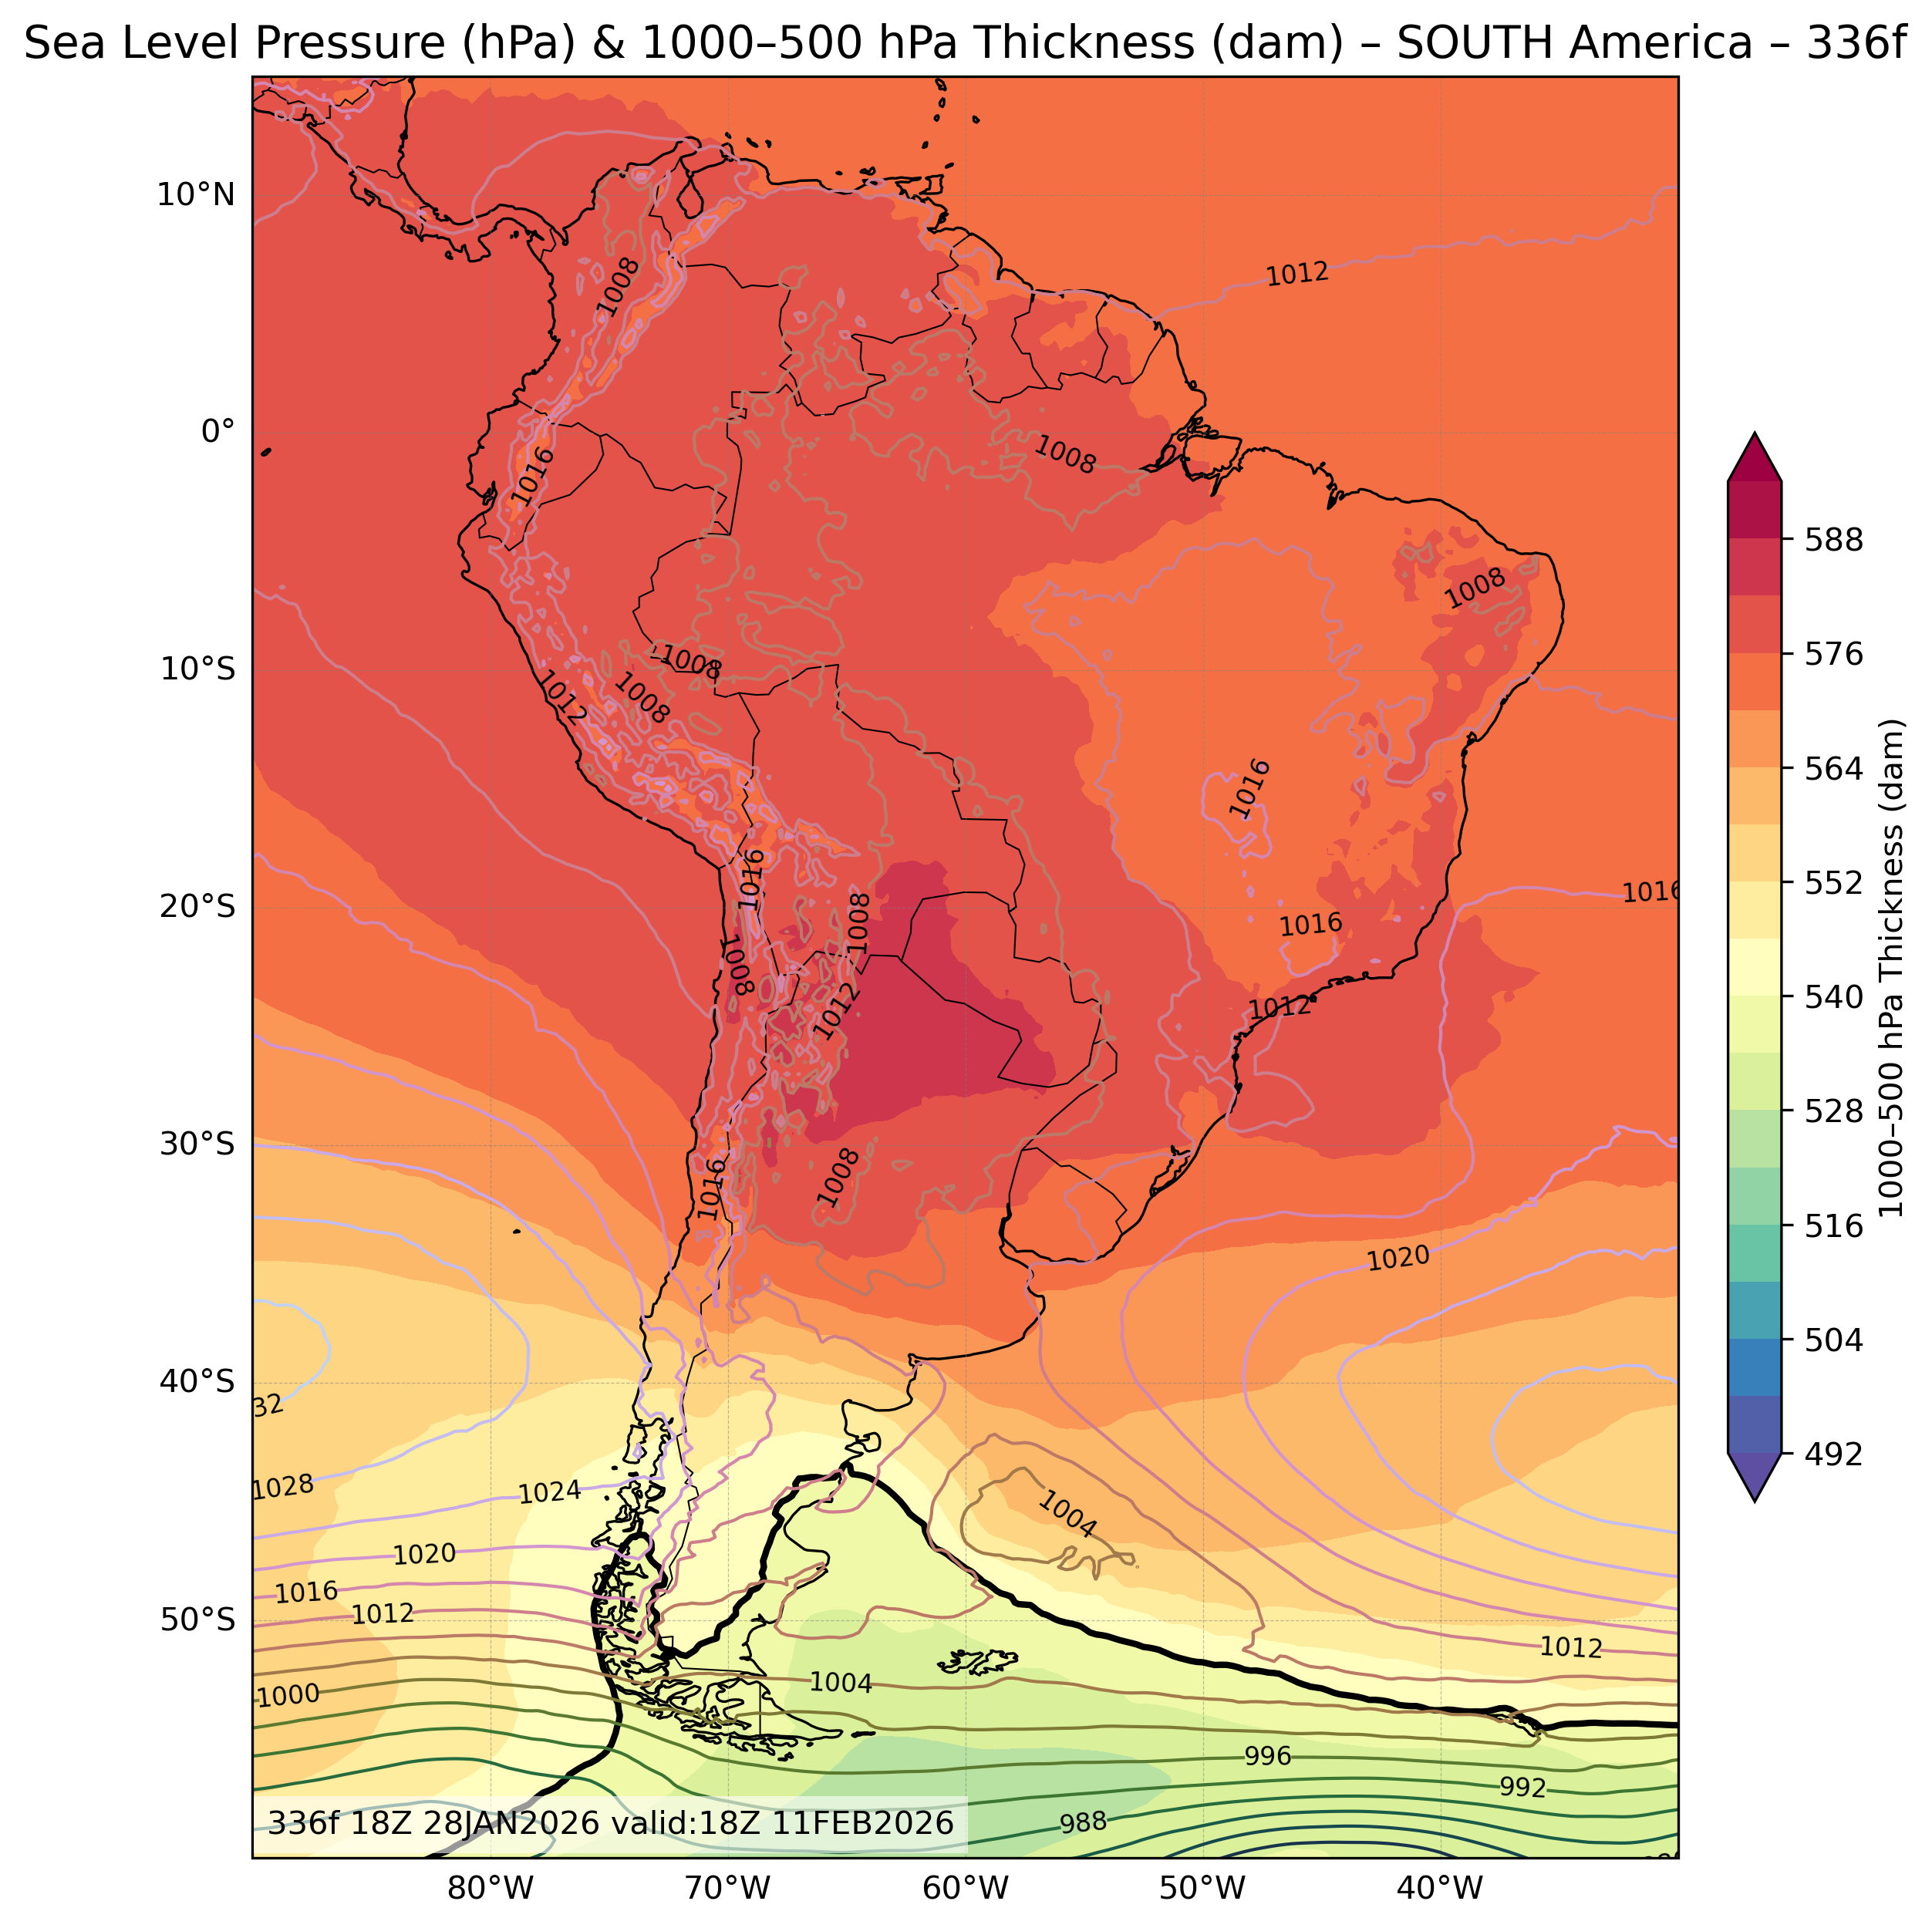
| Sea Level Pressure & 1000-500mb Thickness |
All Times |
🔍 | 🔍 | 🔍 | 🔍 | 🔍 |
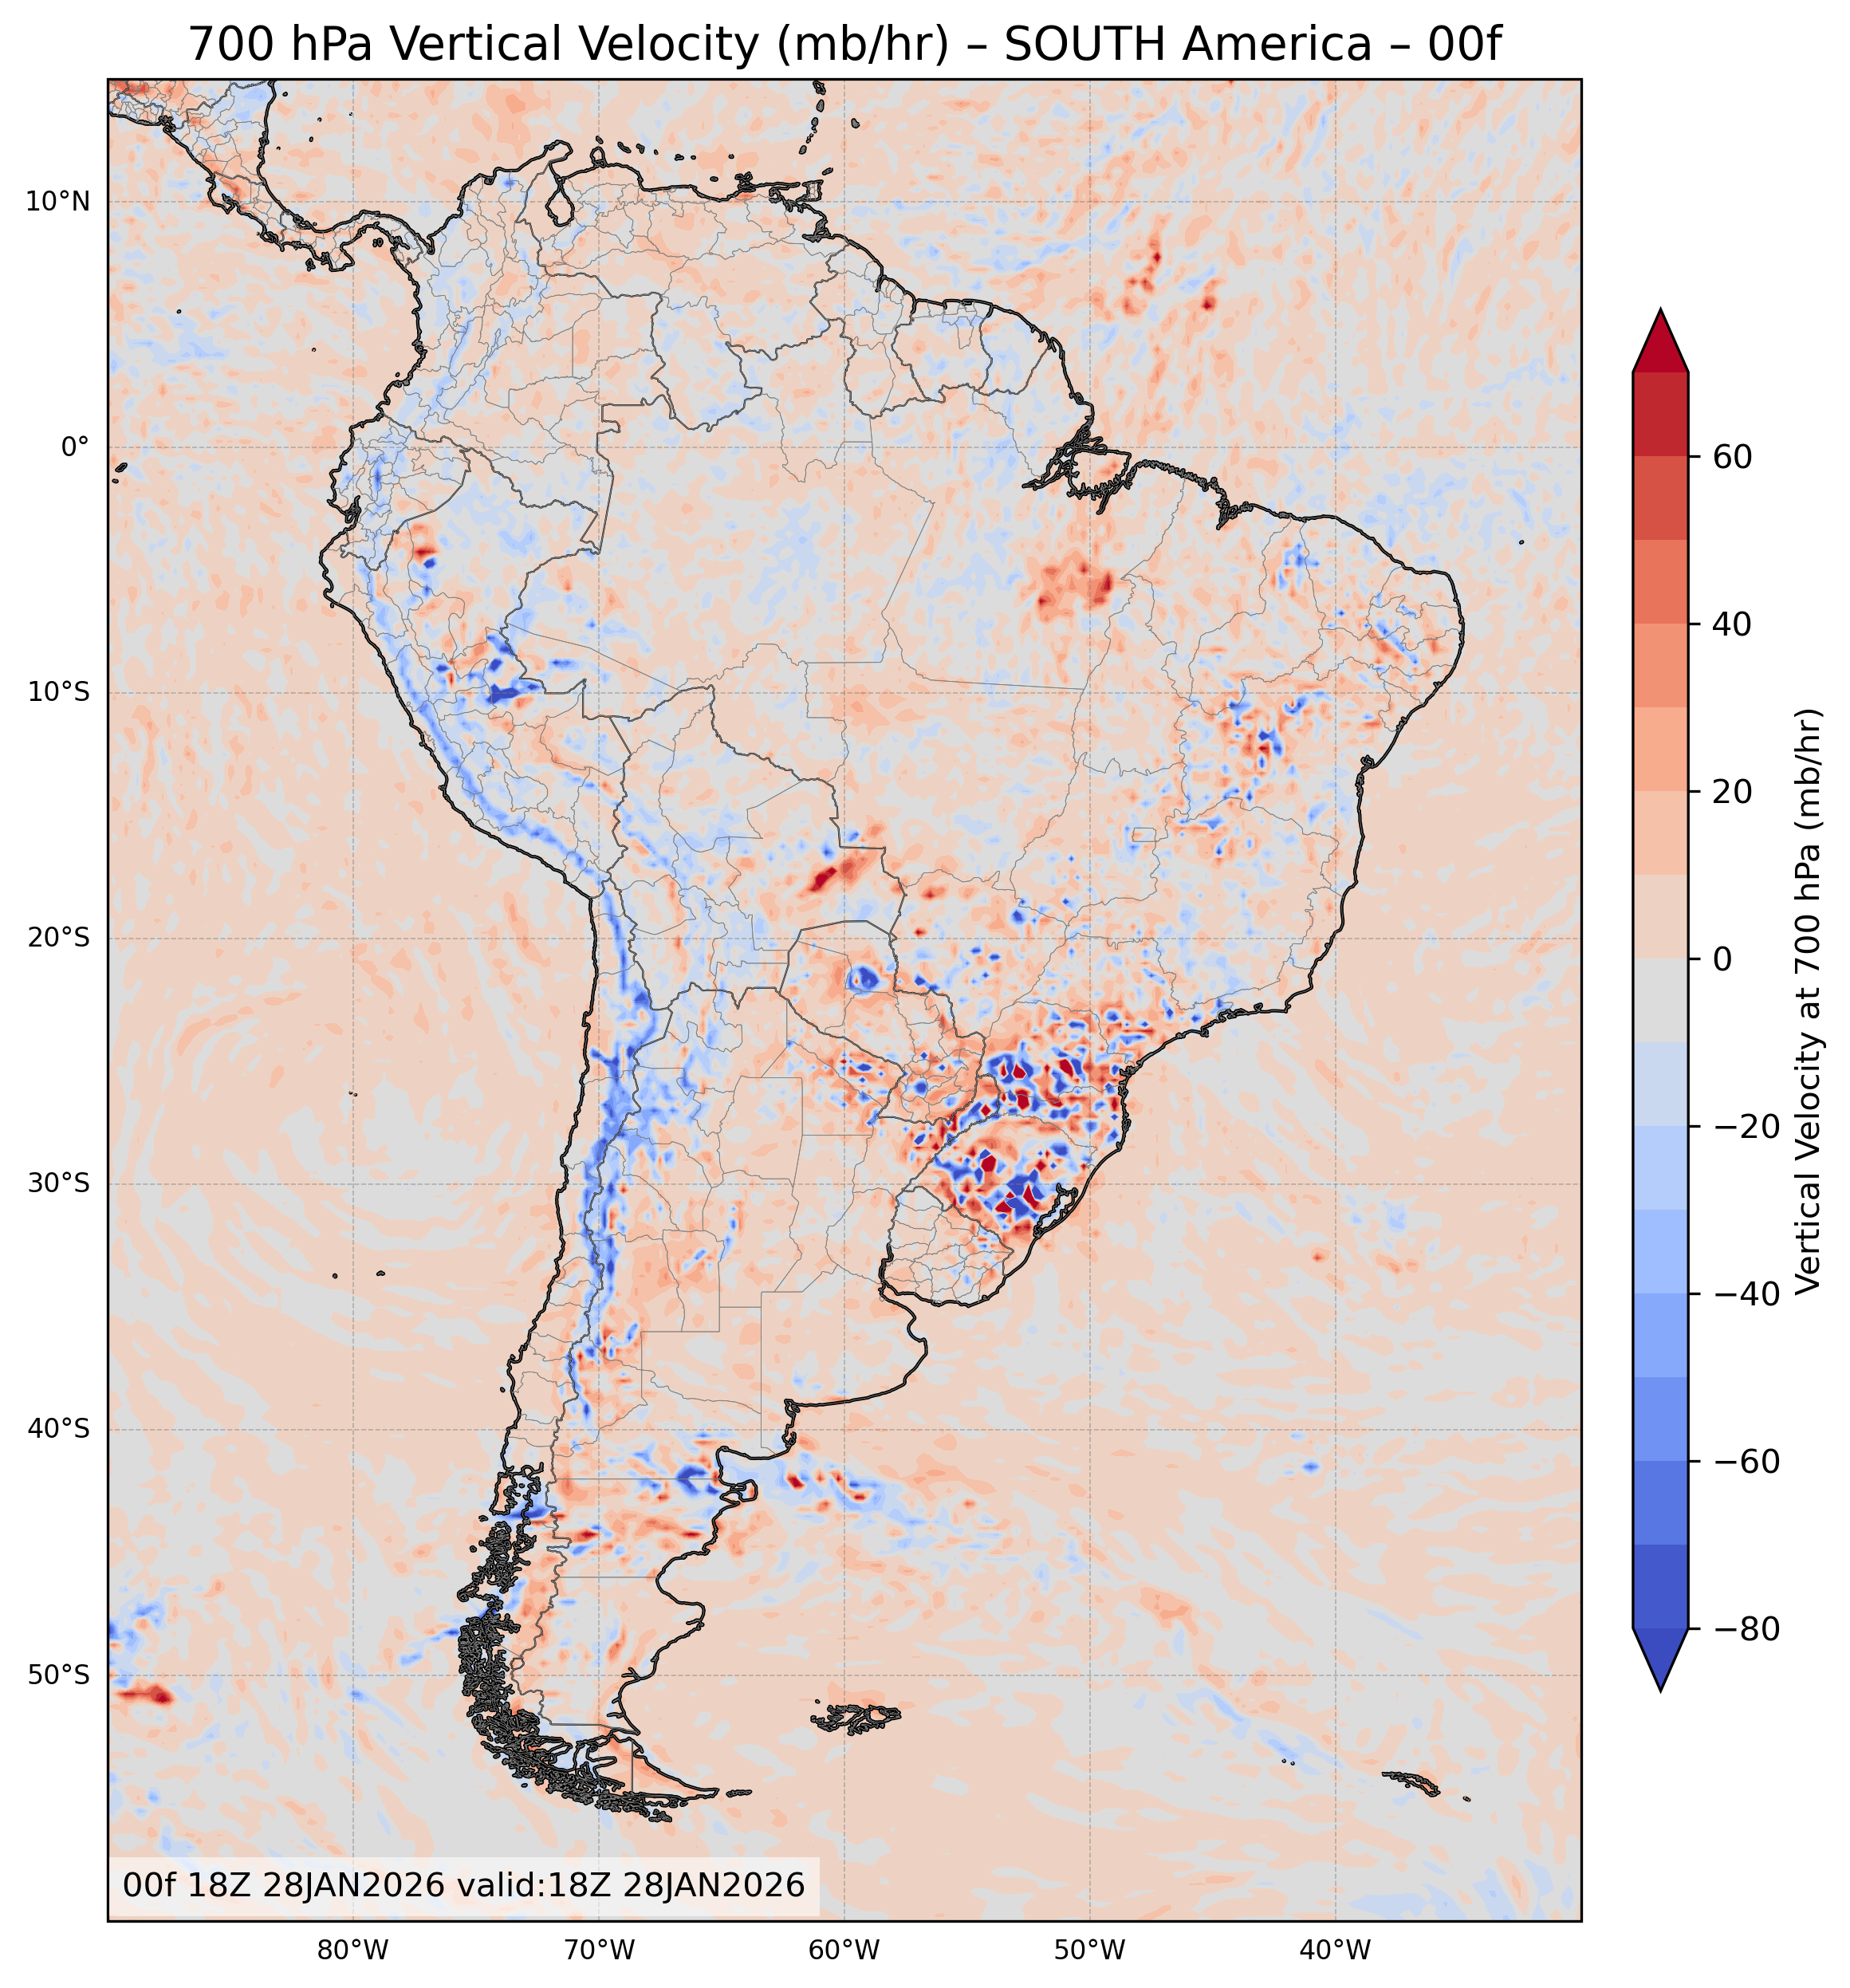
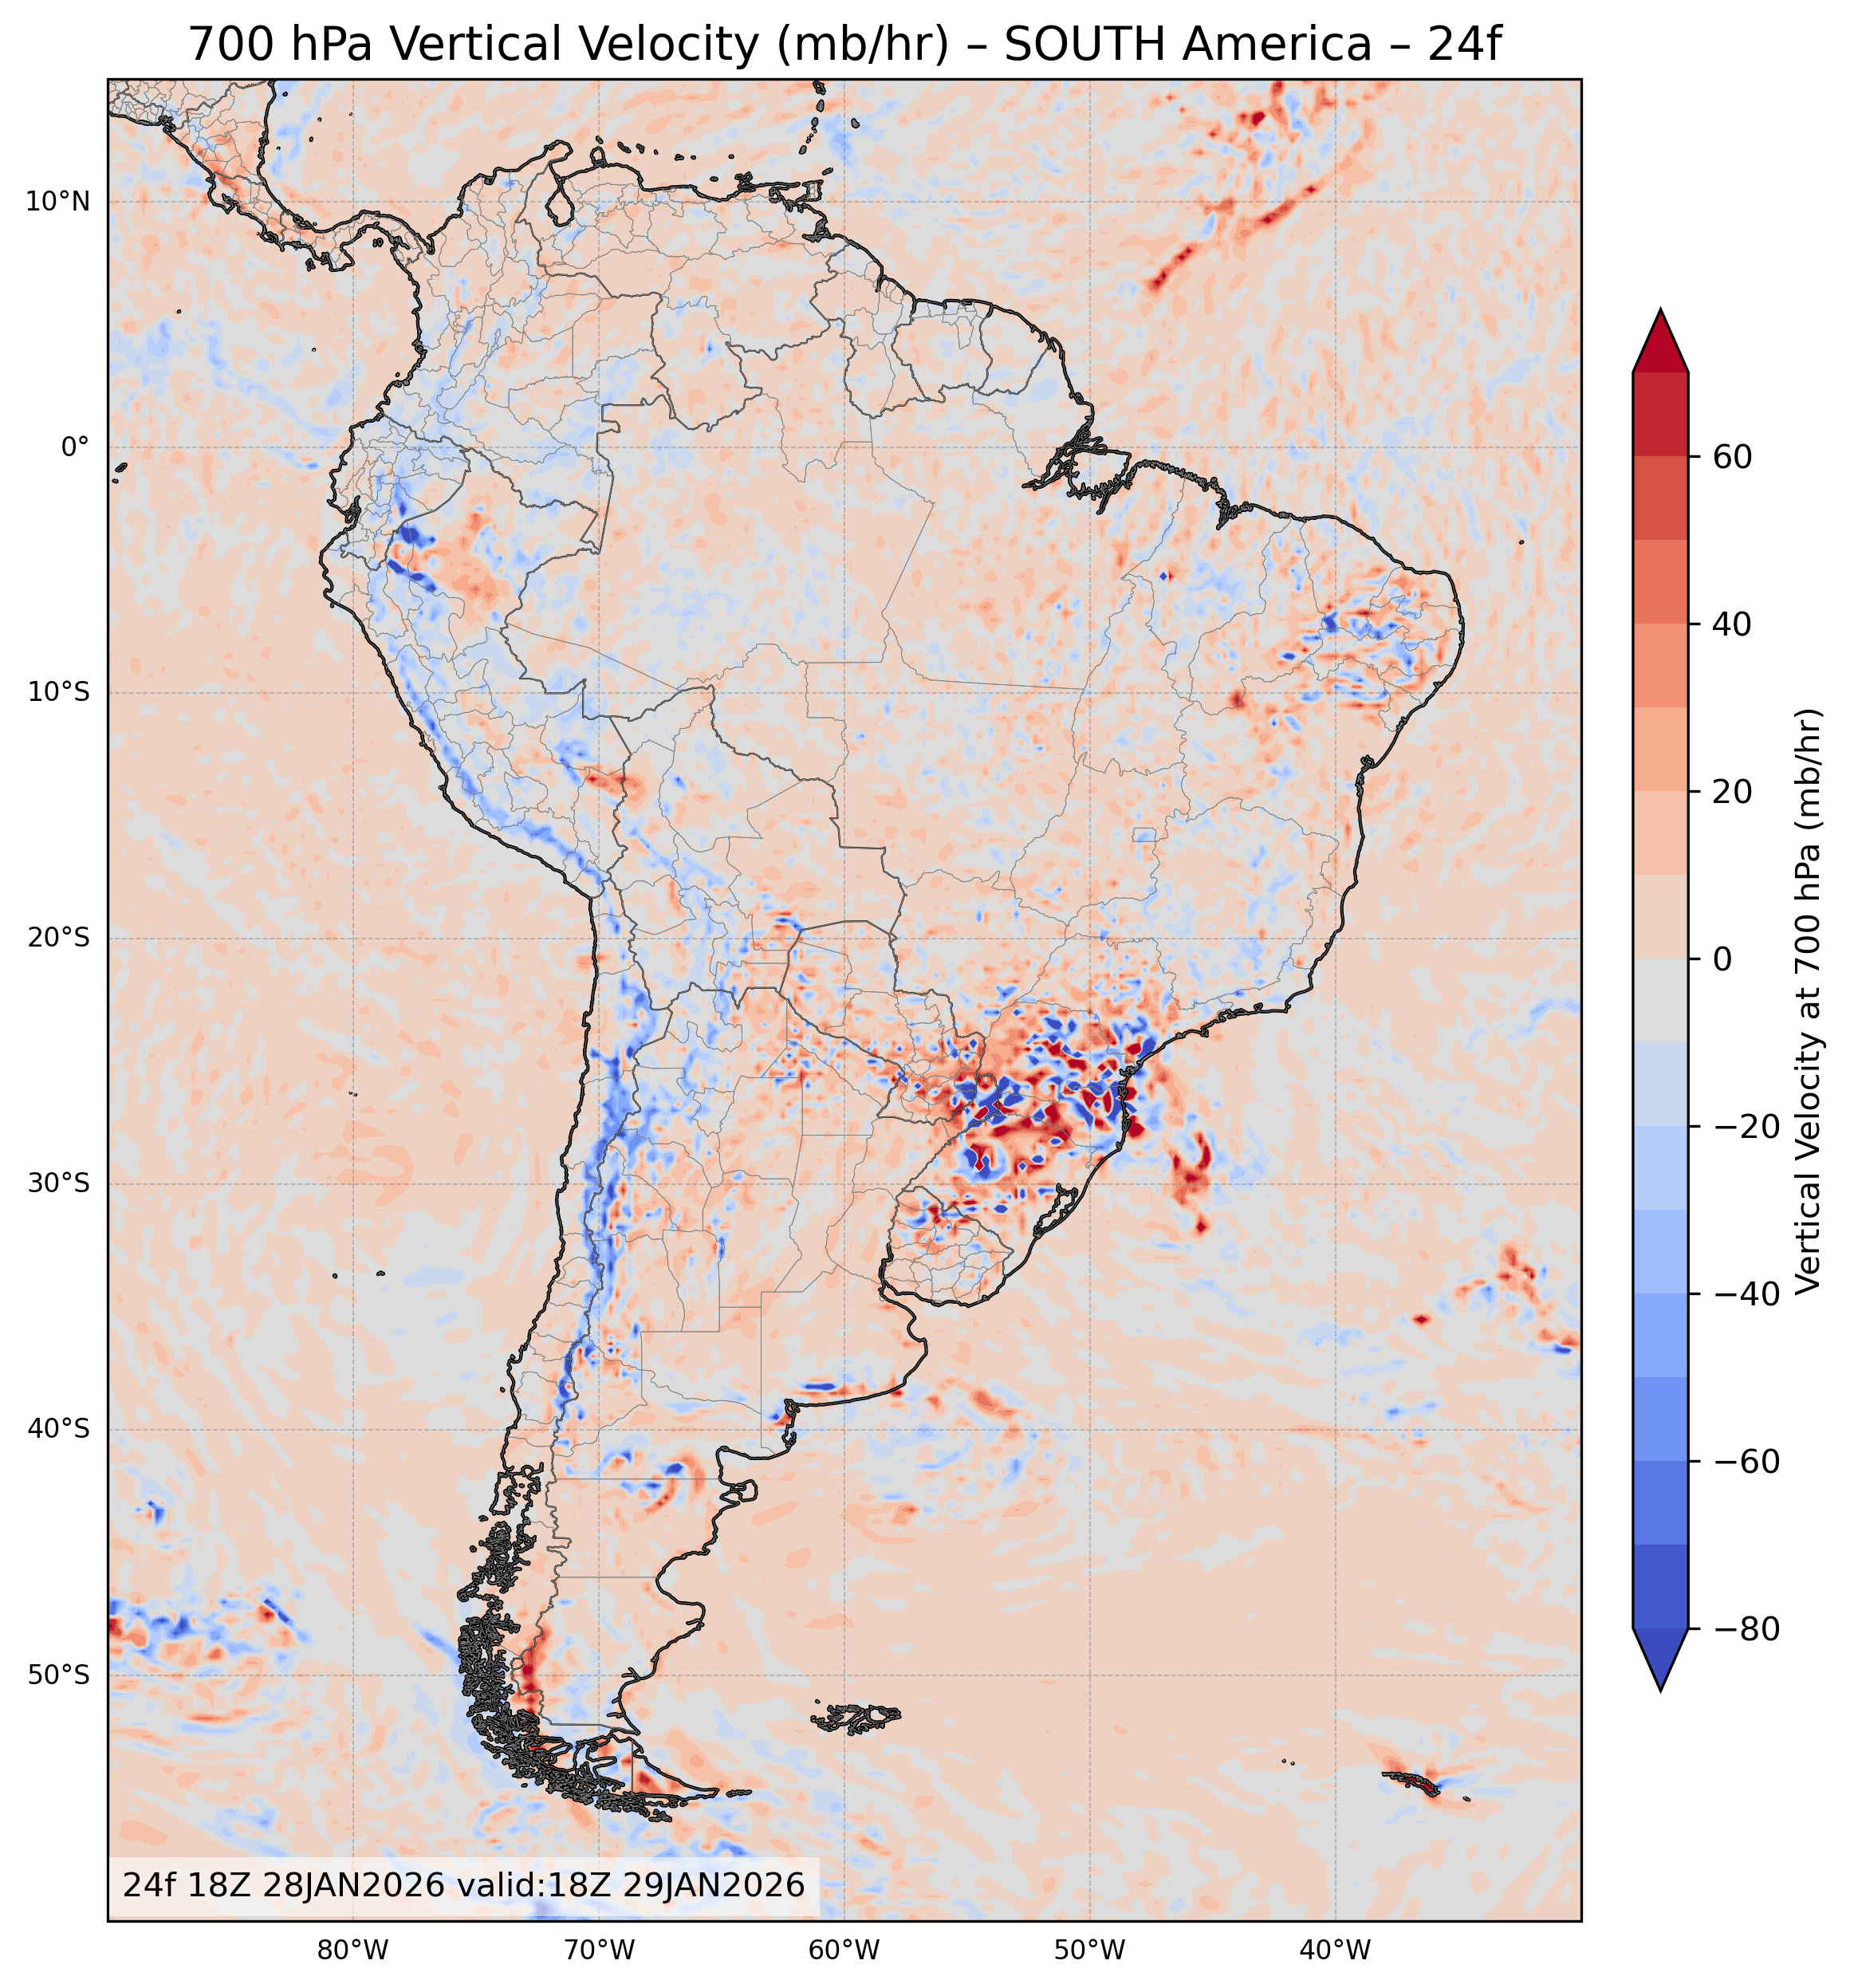
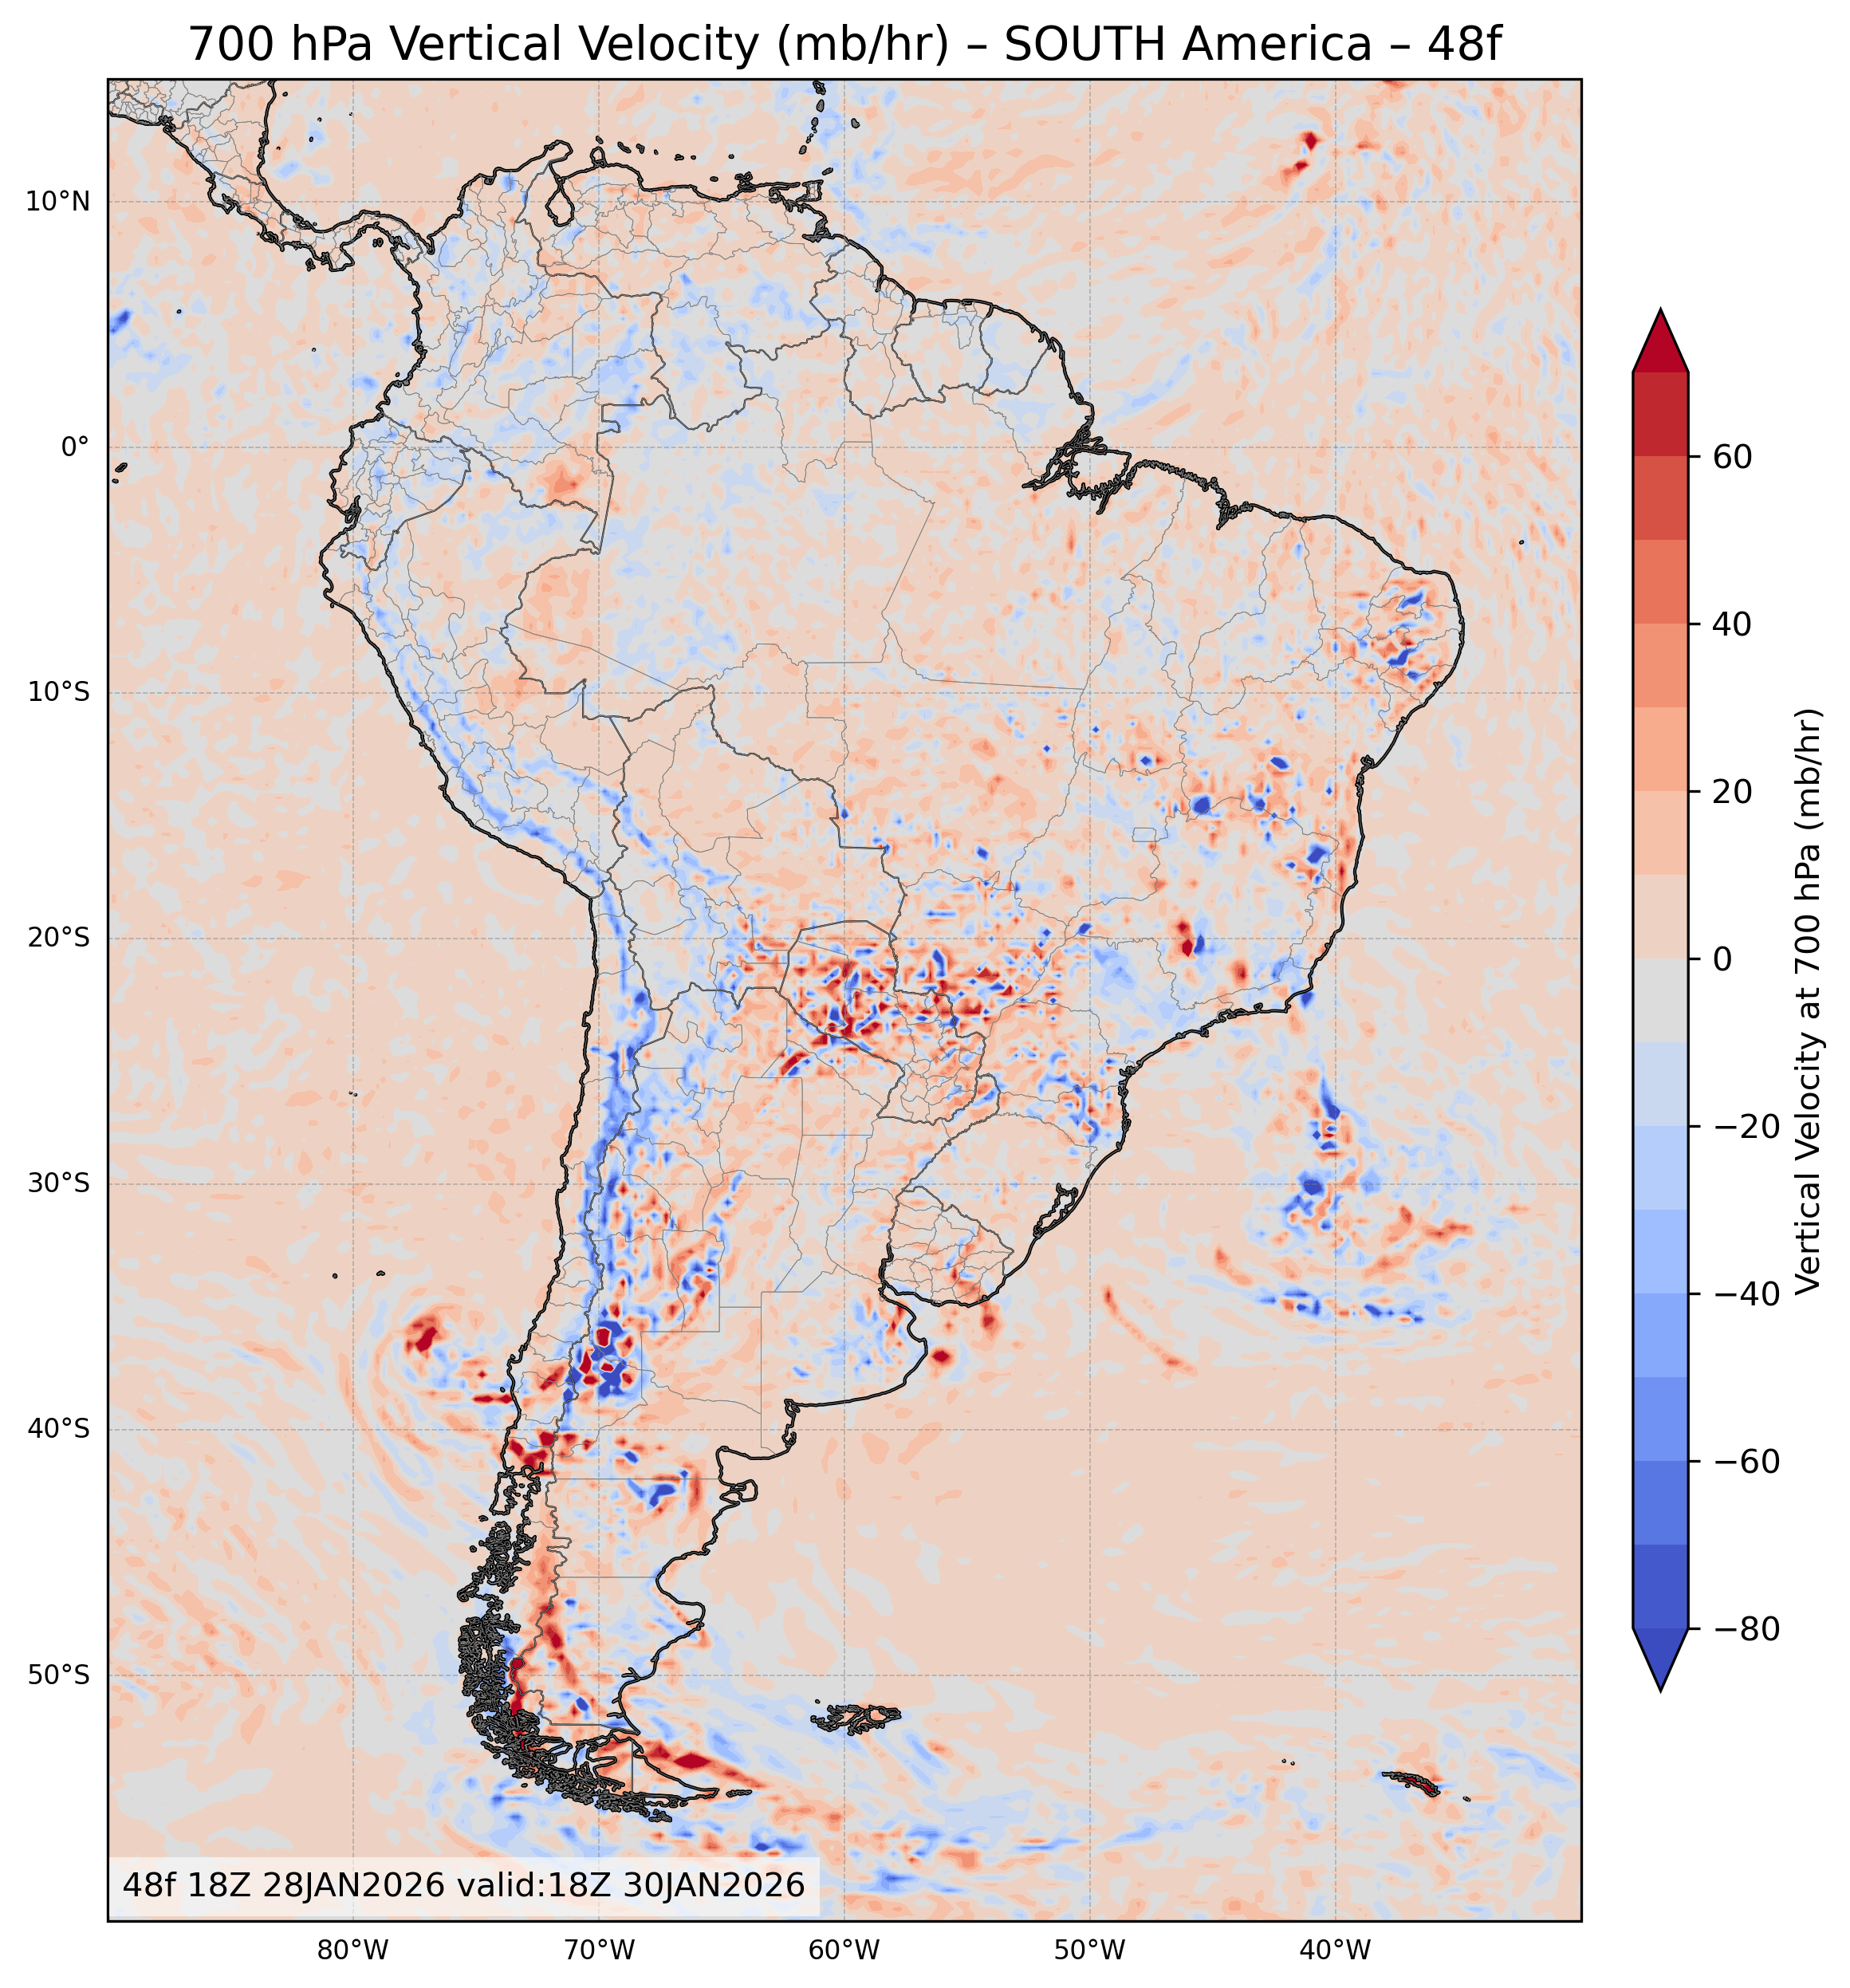
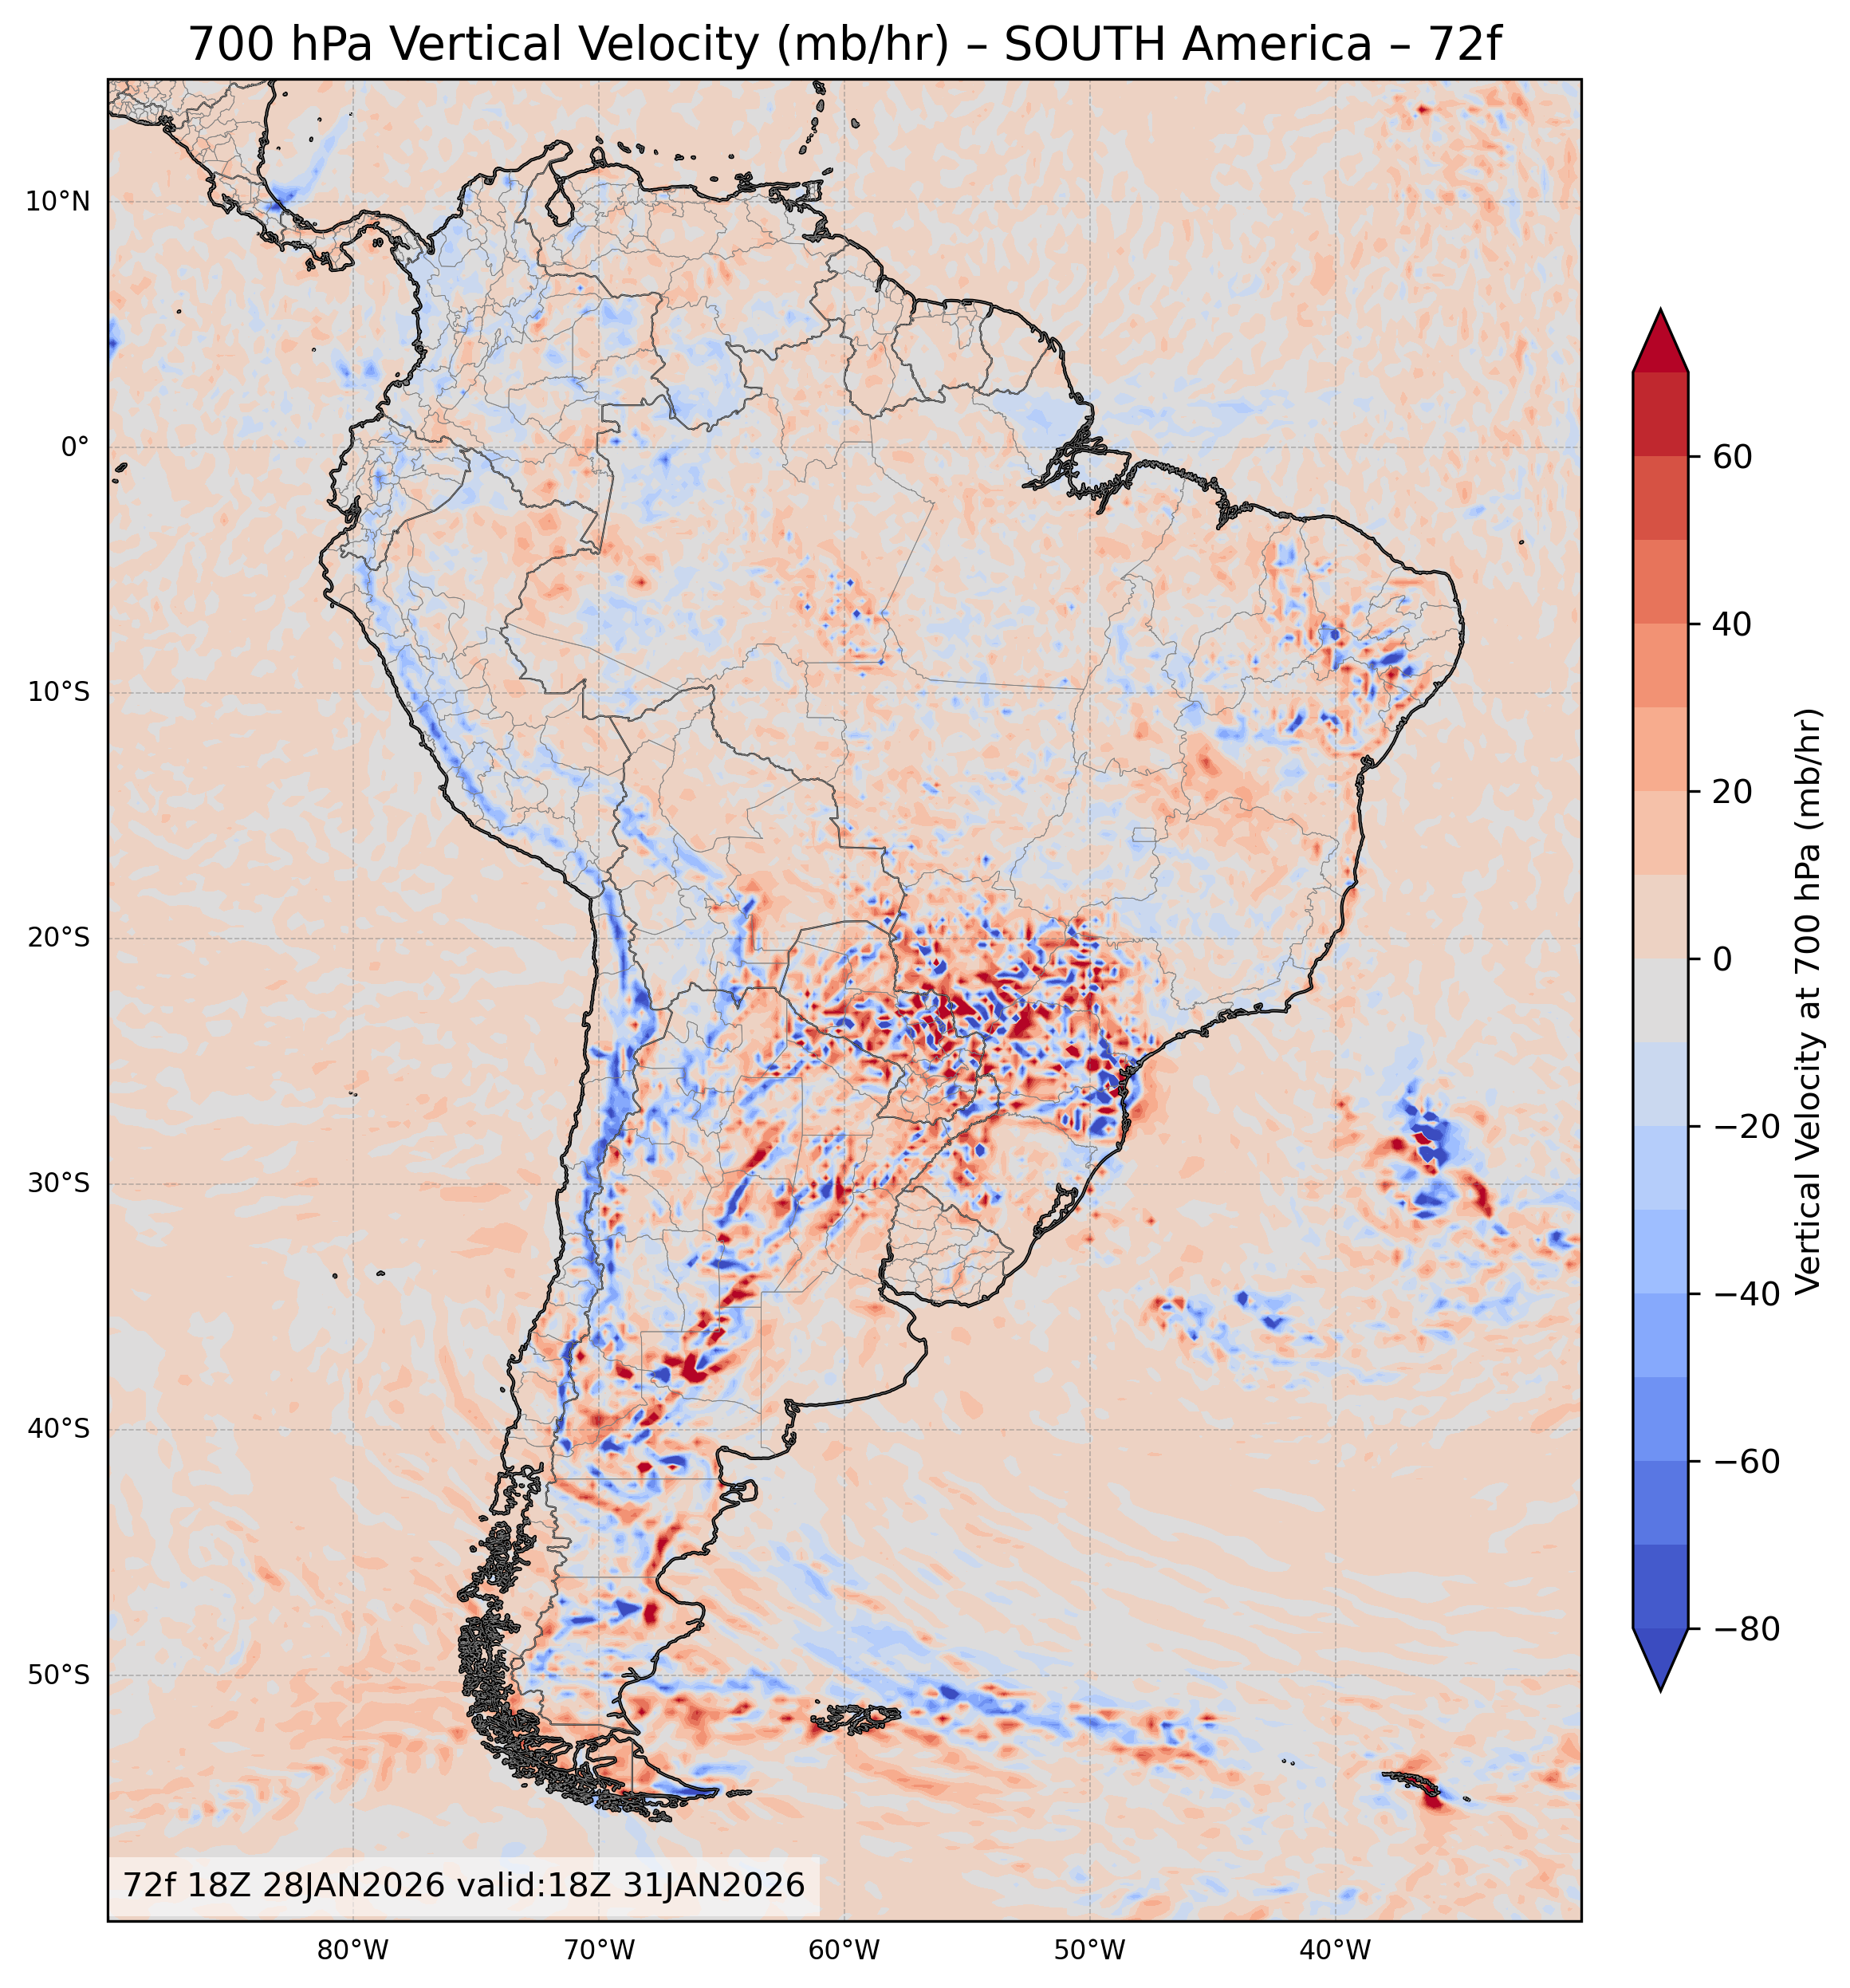
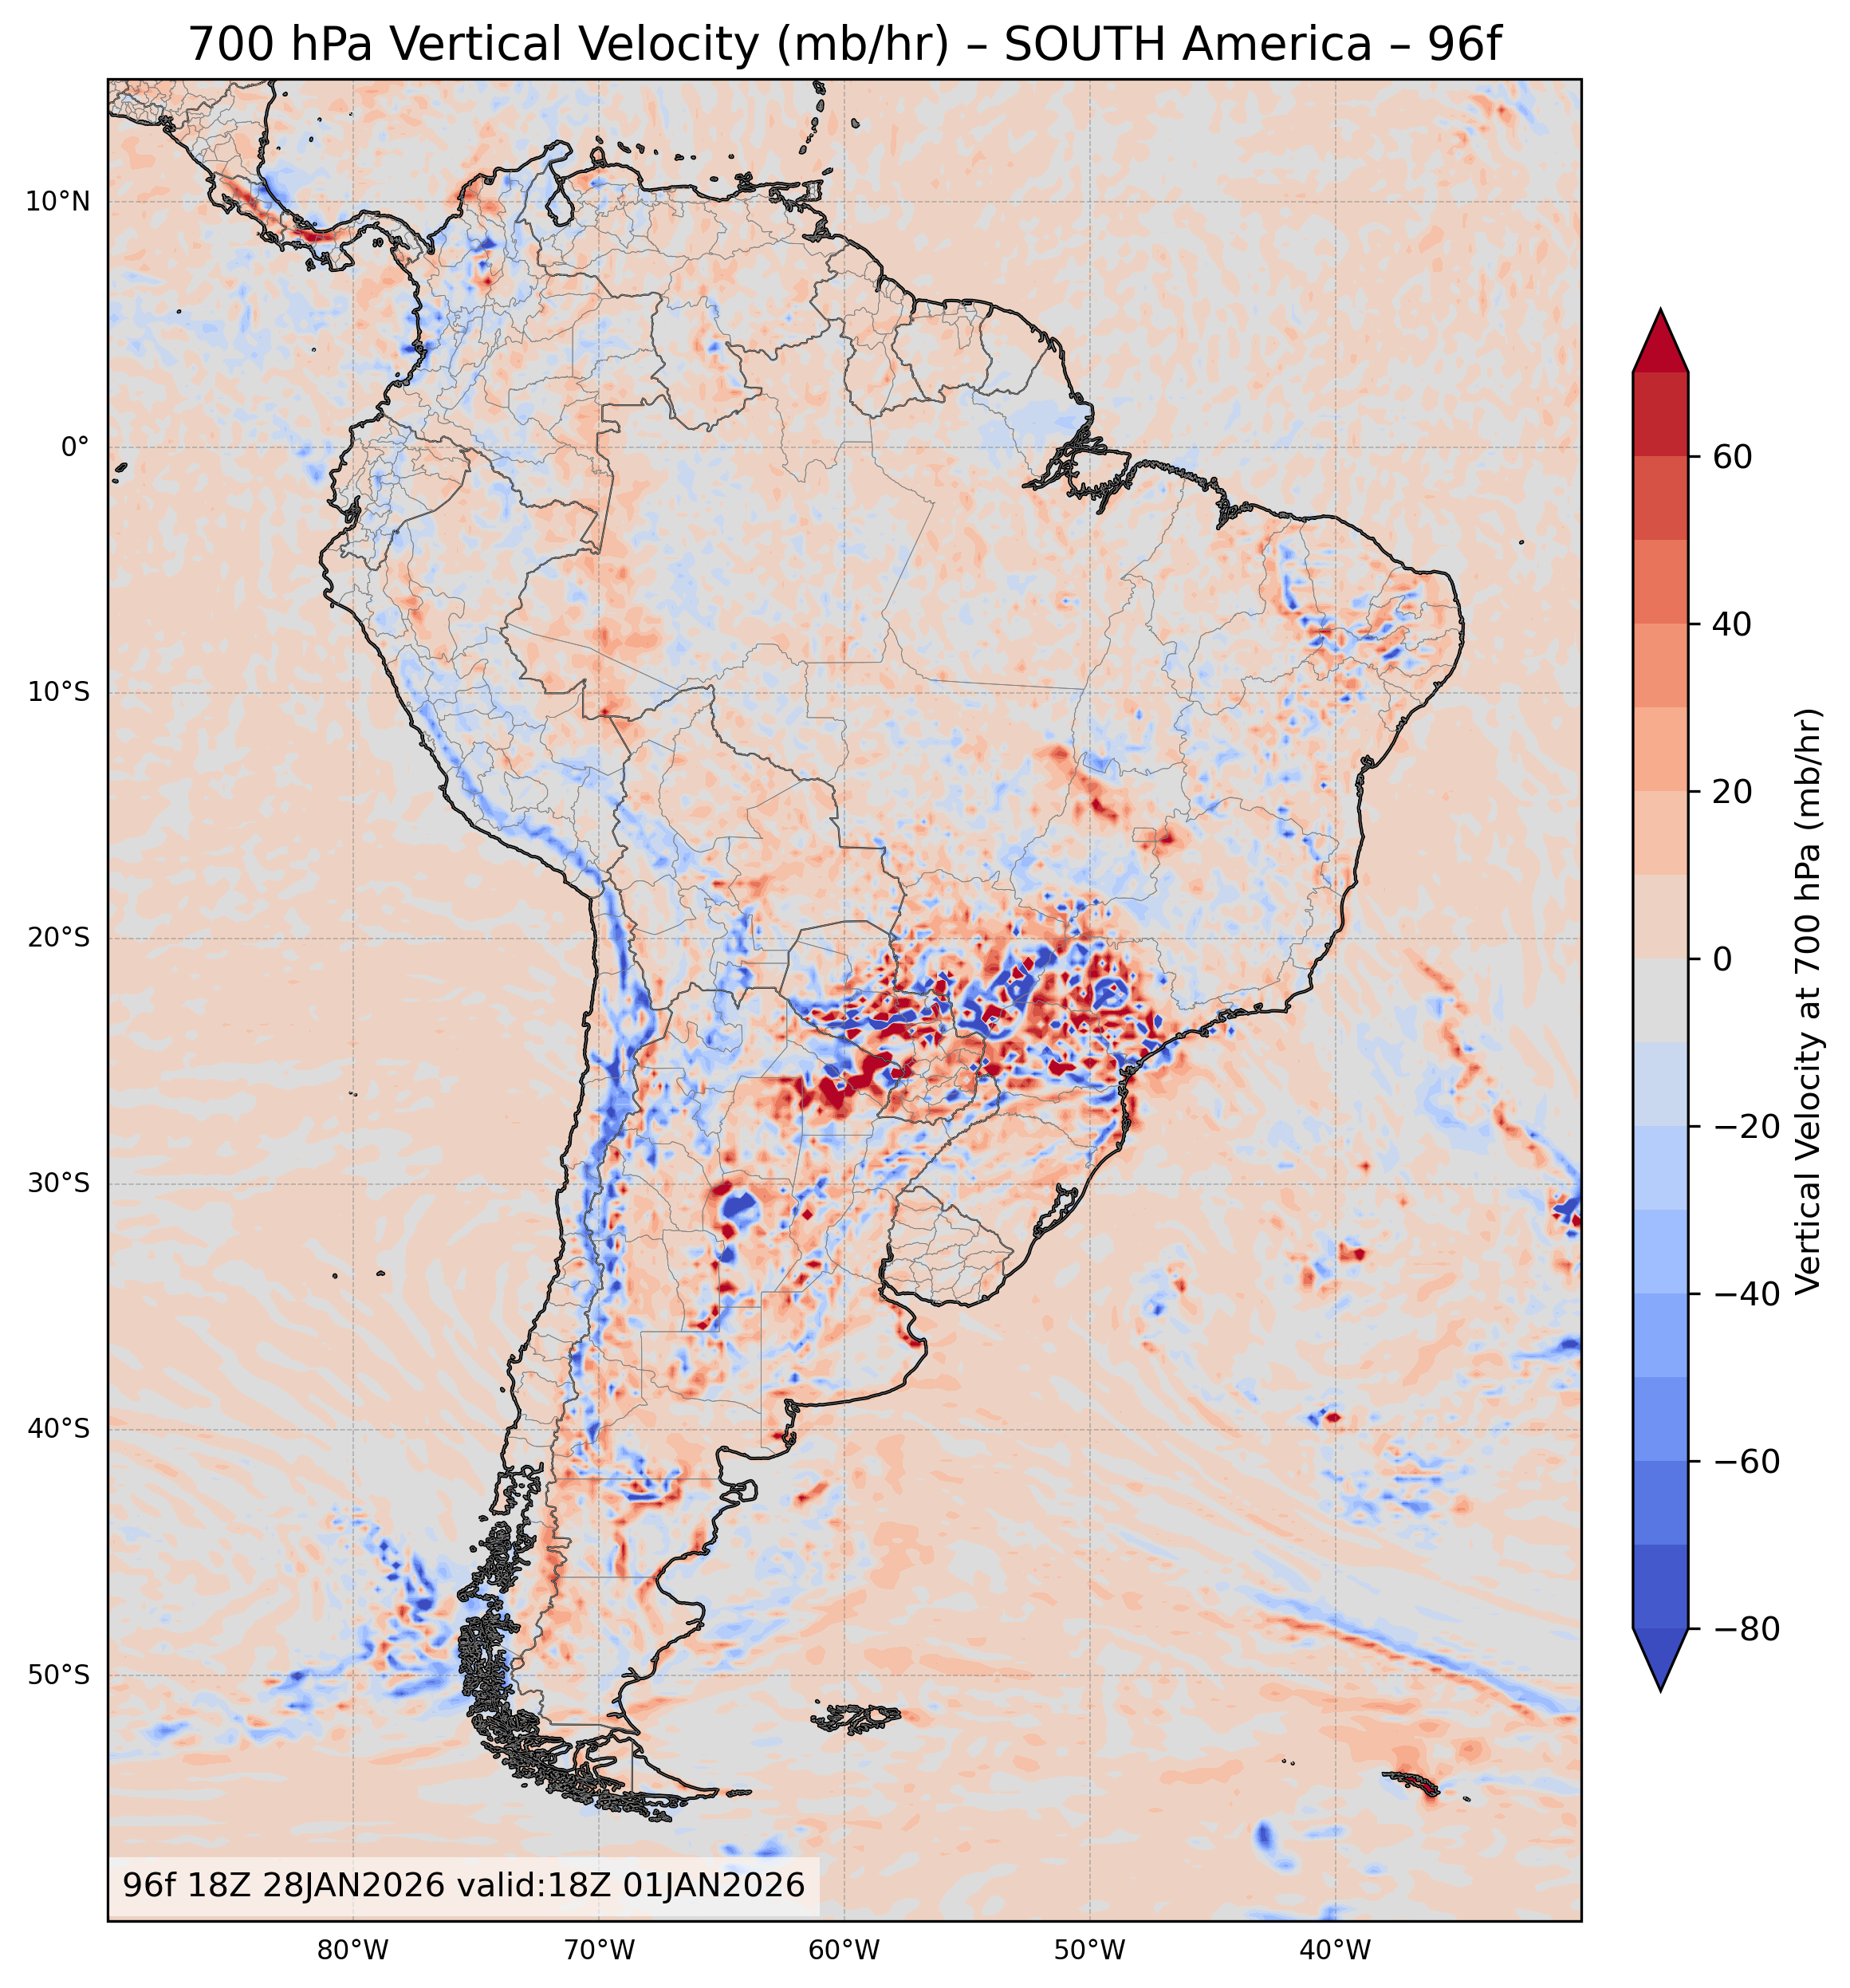
| 700 mb Vertical Velocity (mb/hr) | All Times |
🔍 | 🔍 | 🔍 | 🔍 | 🔍 |
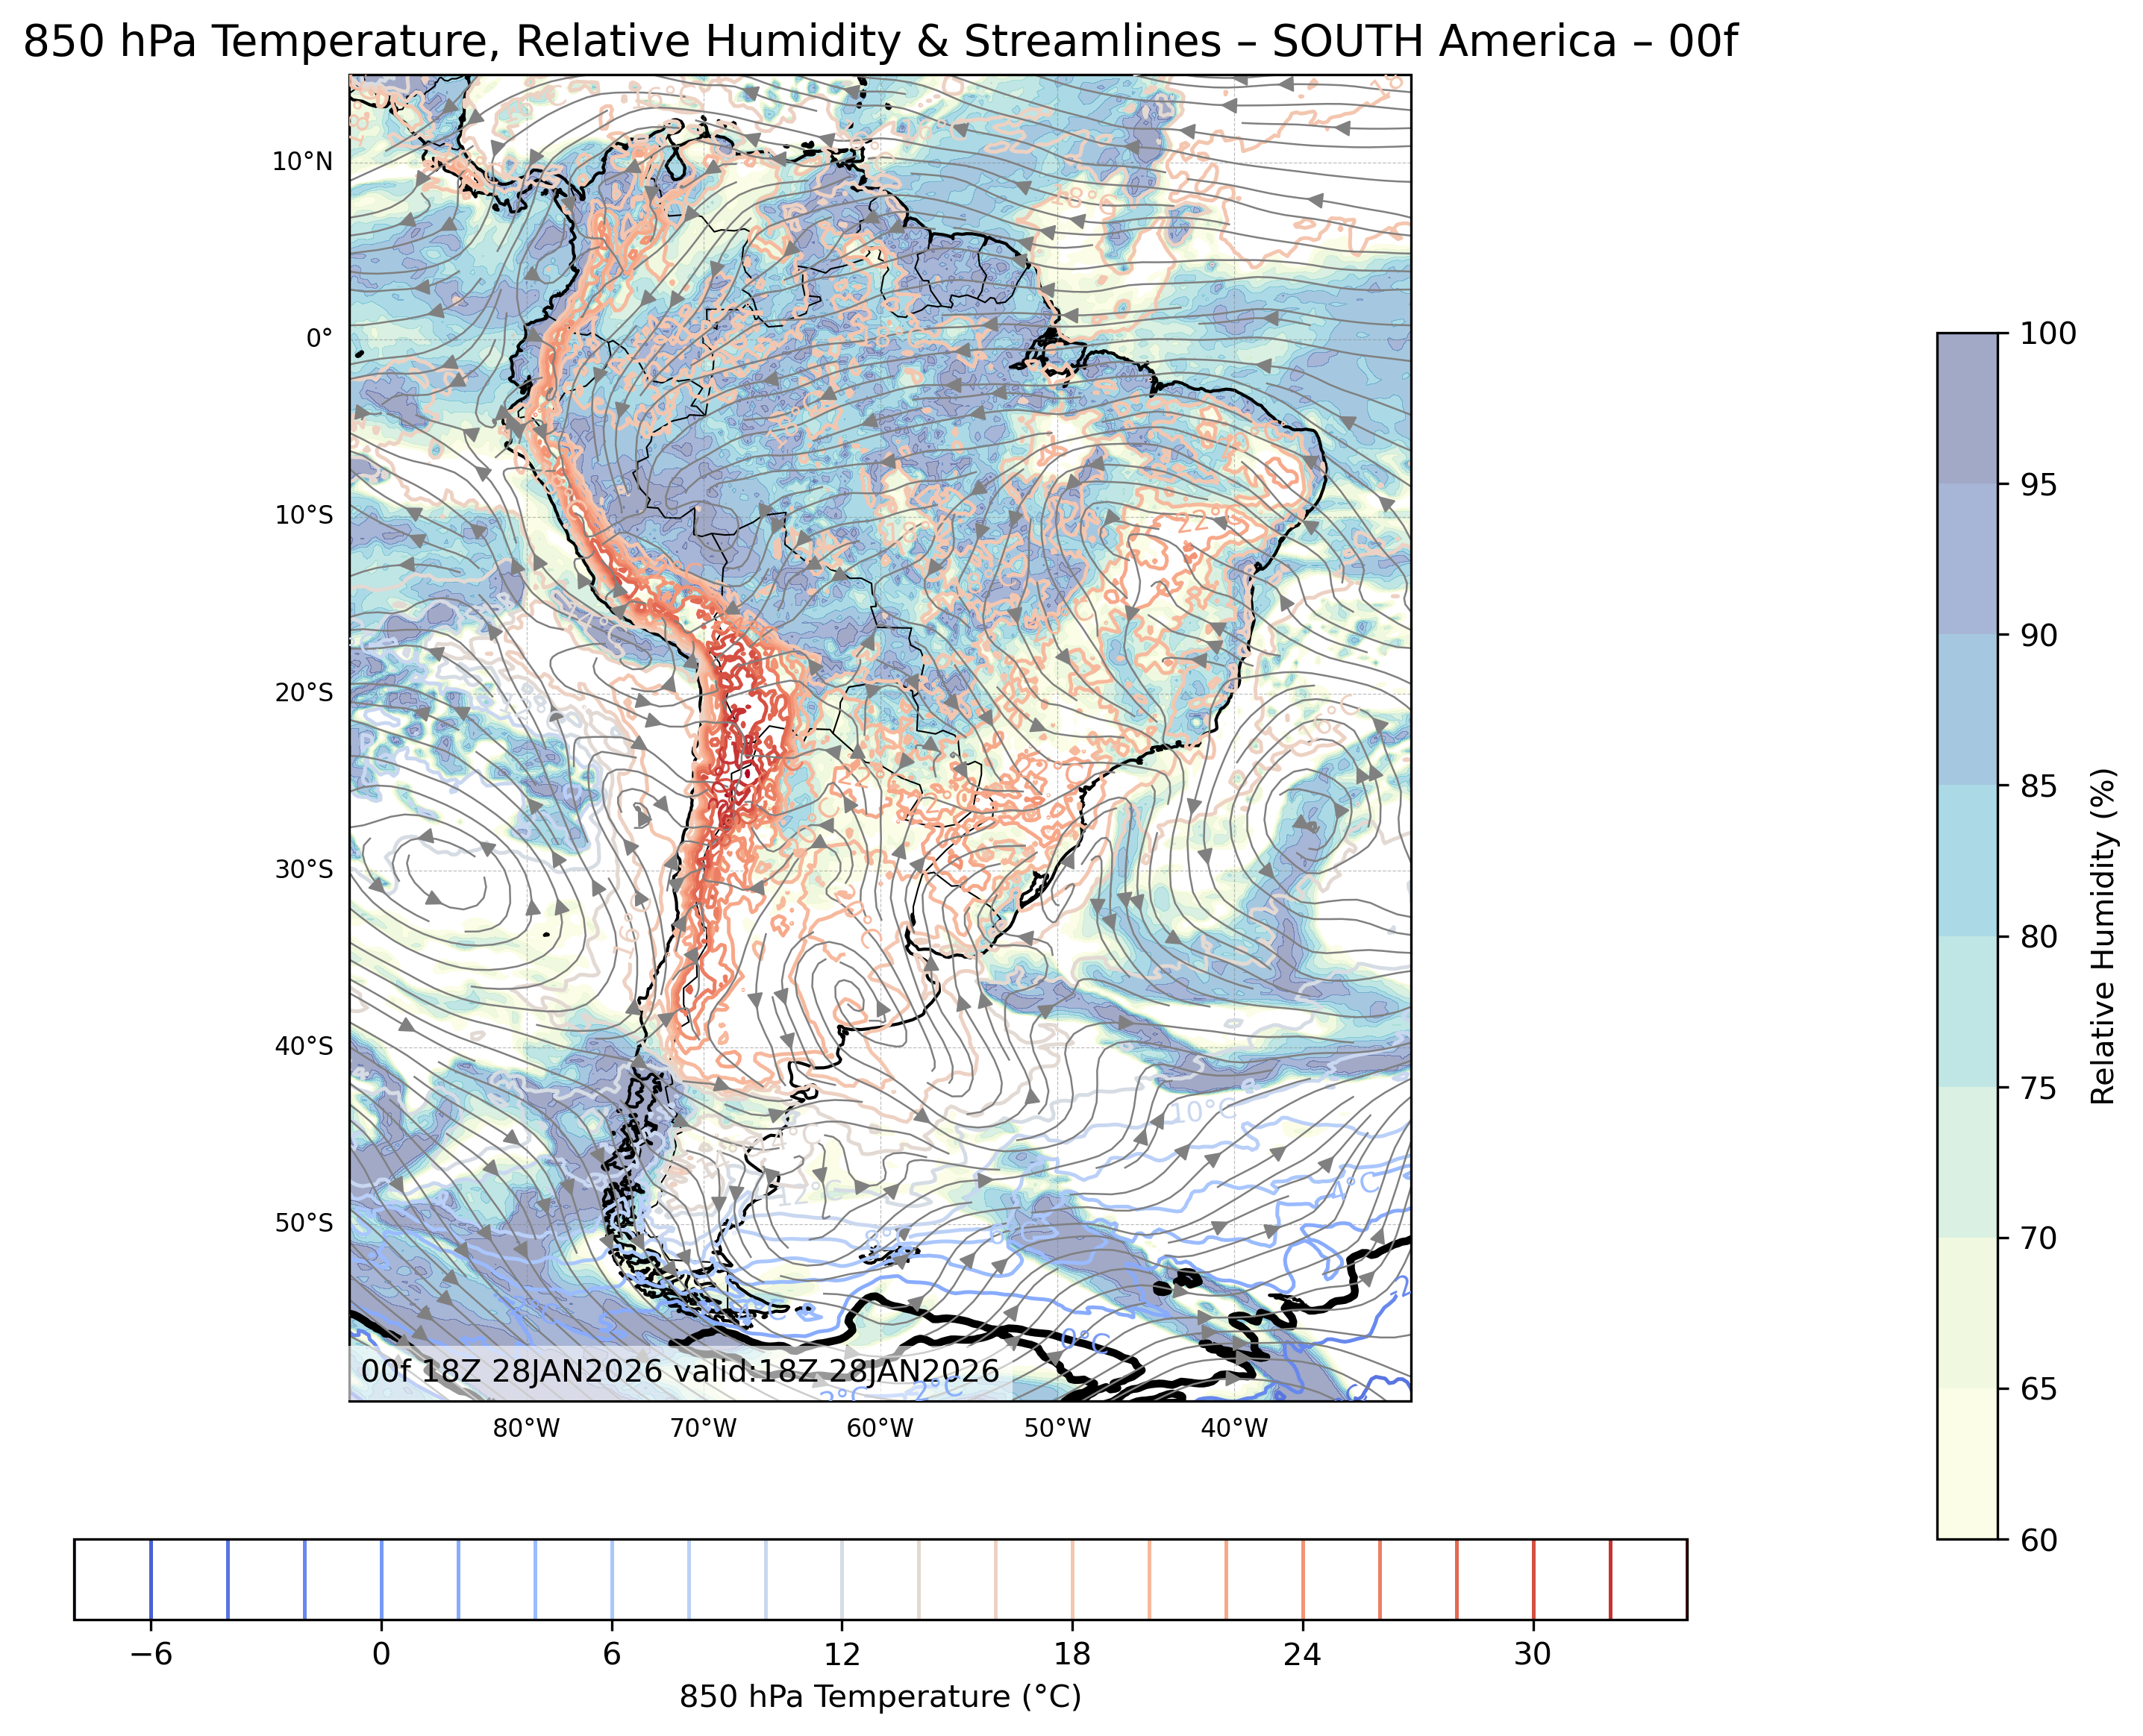
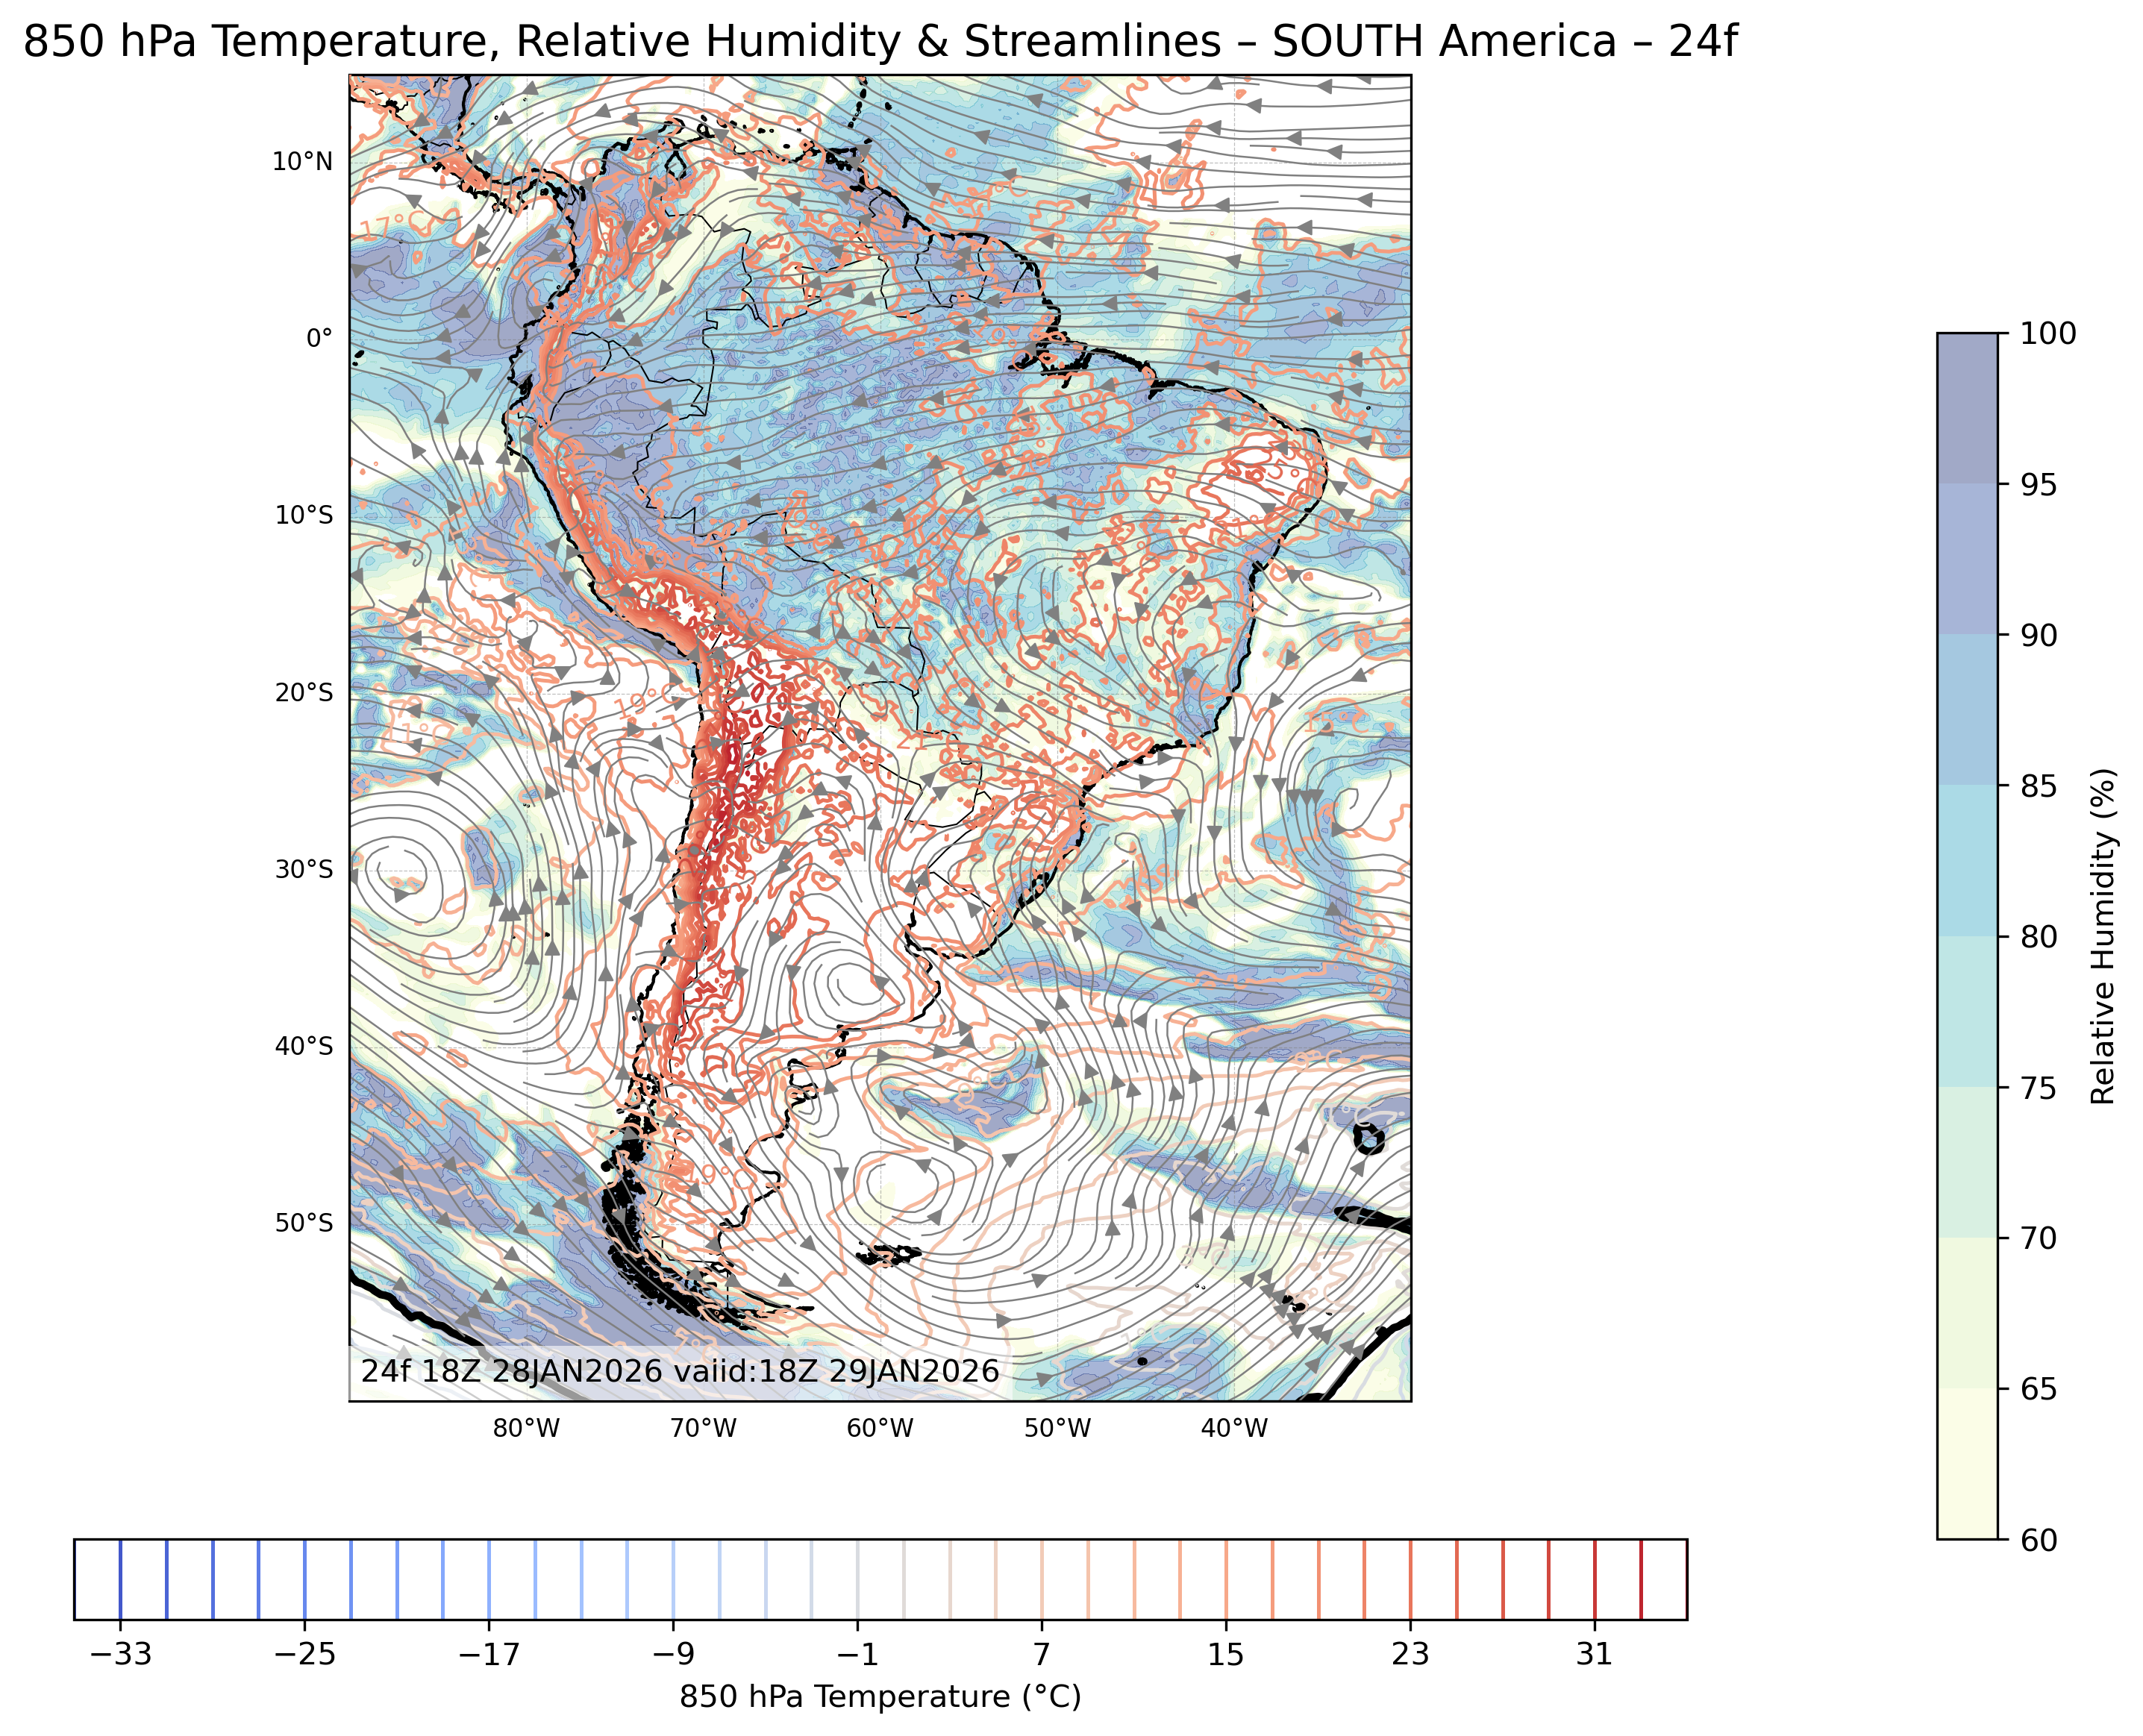
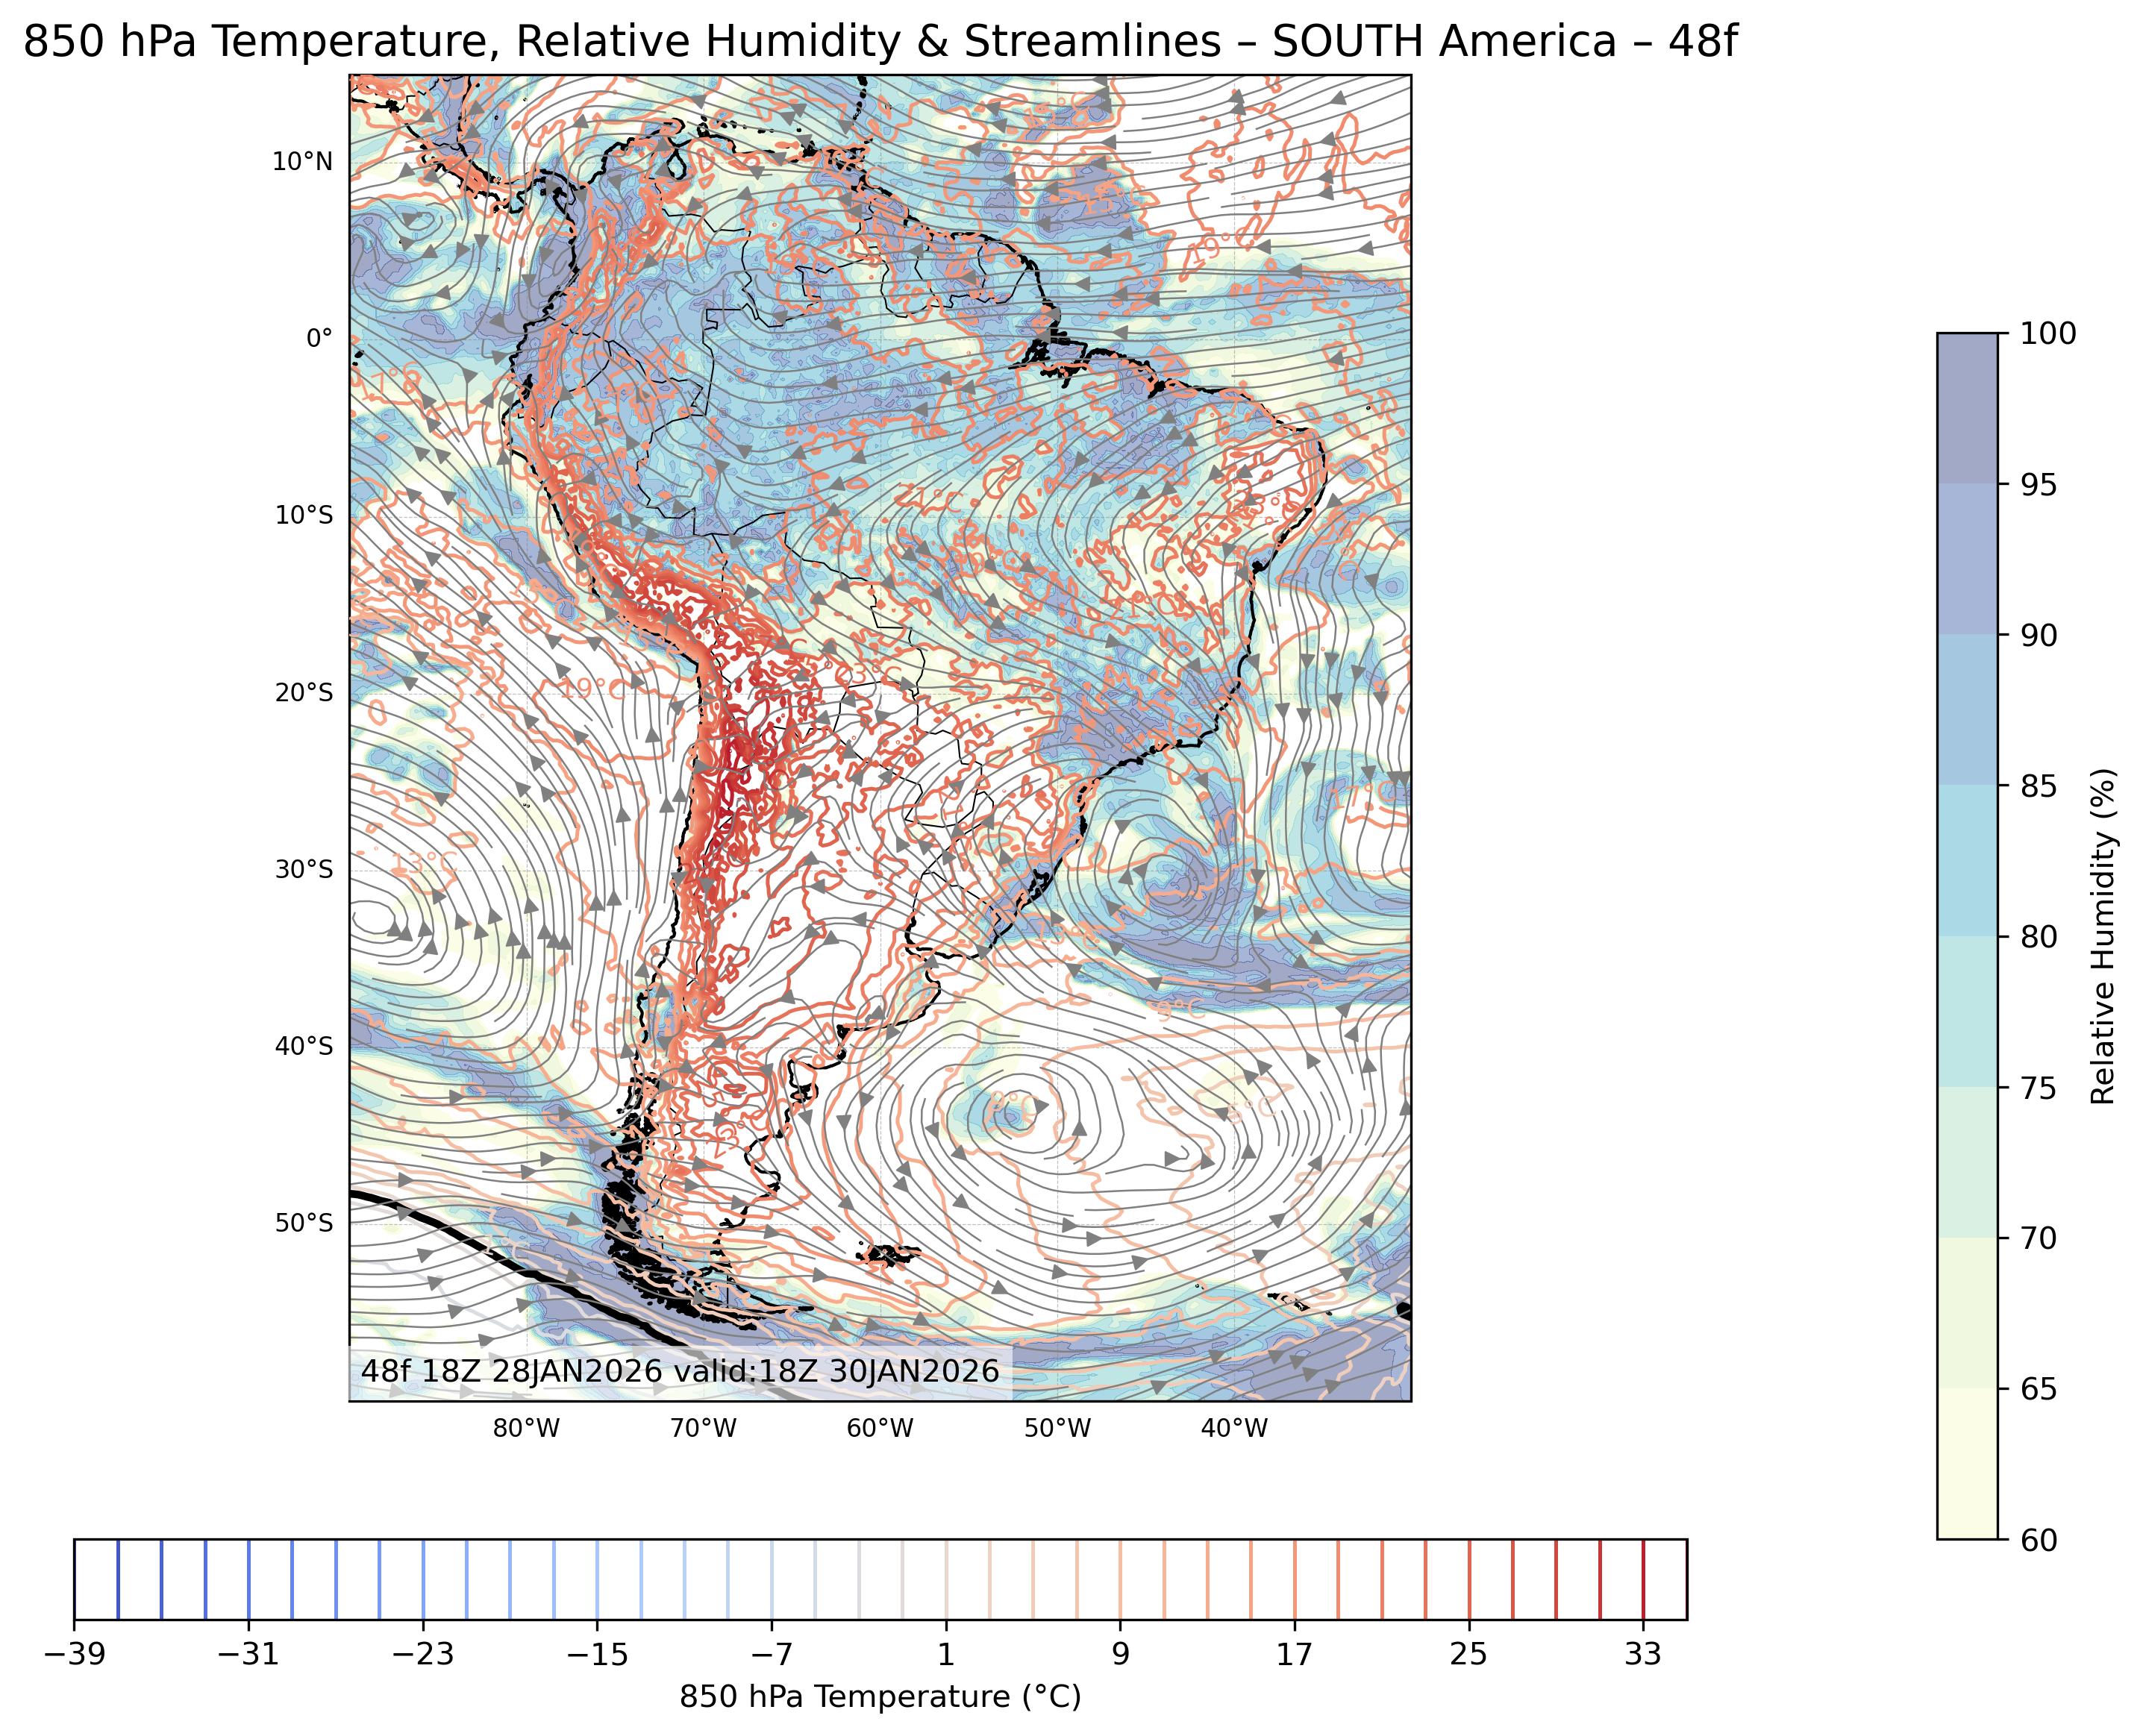
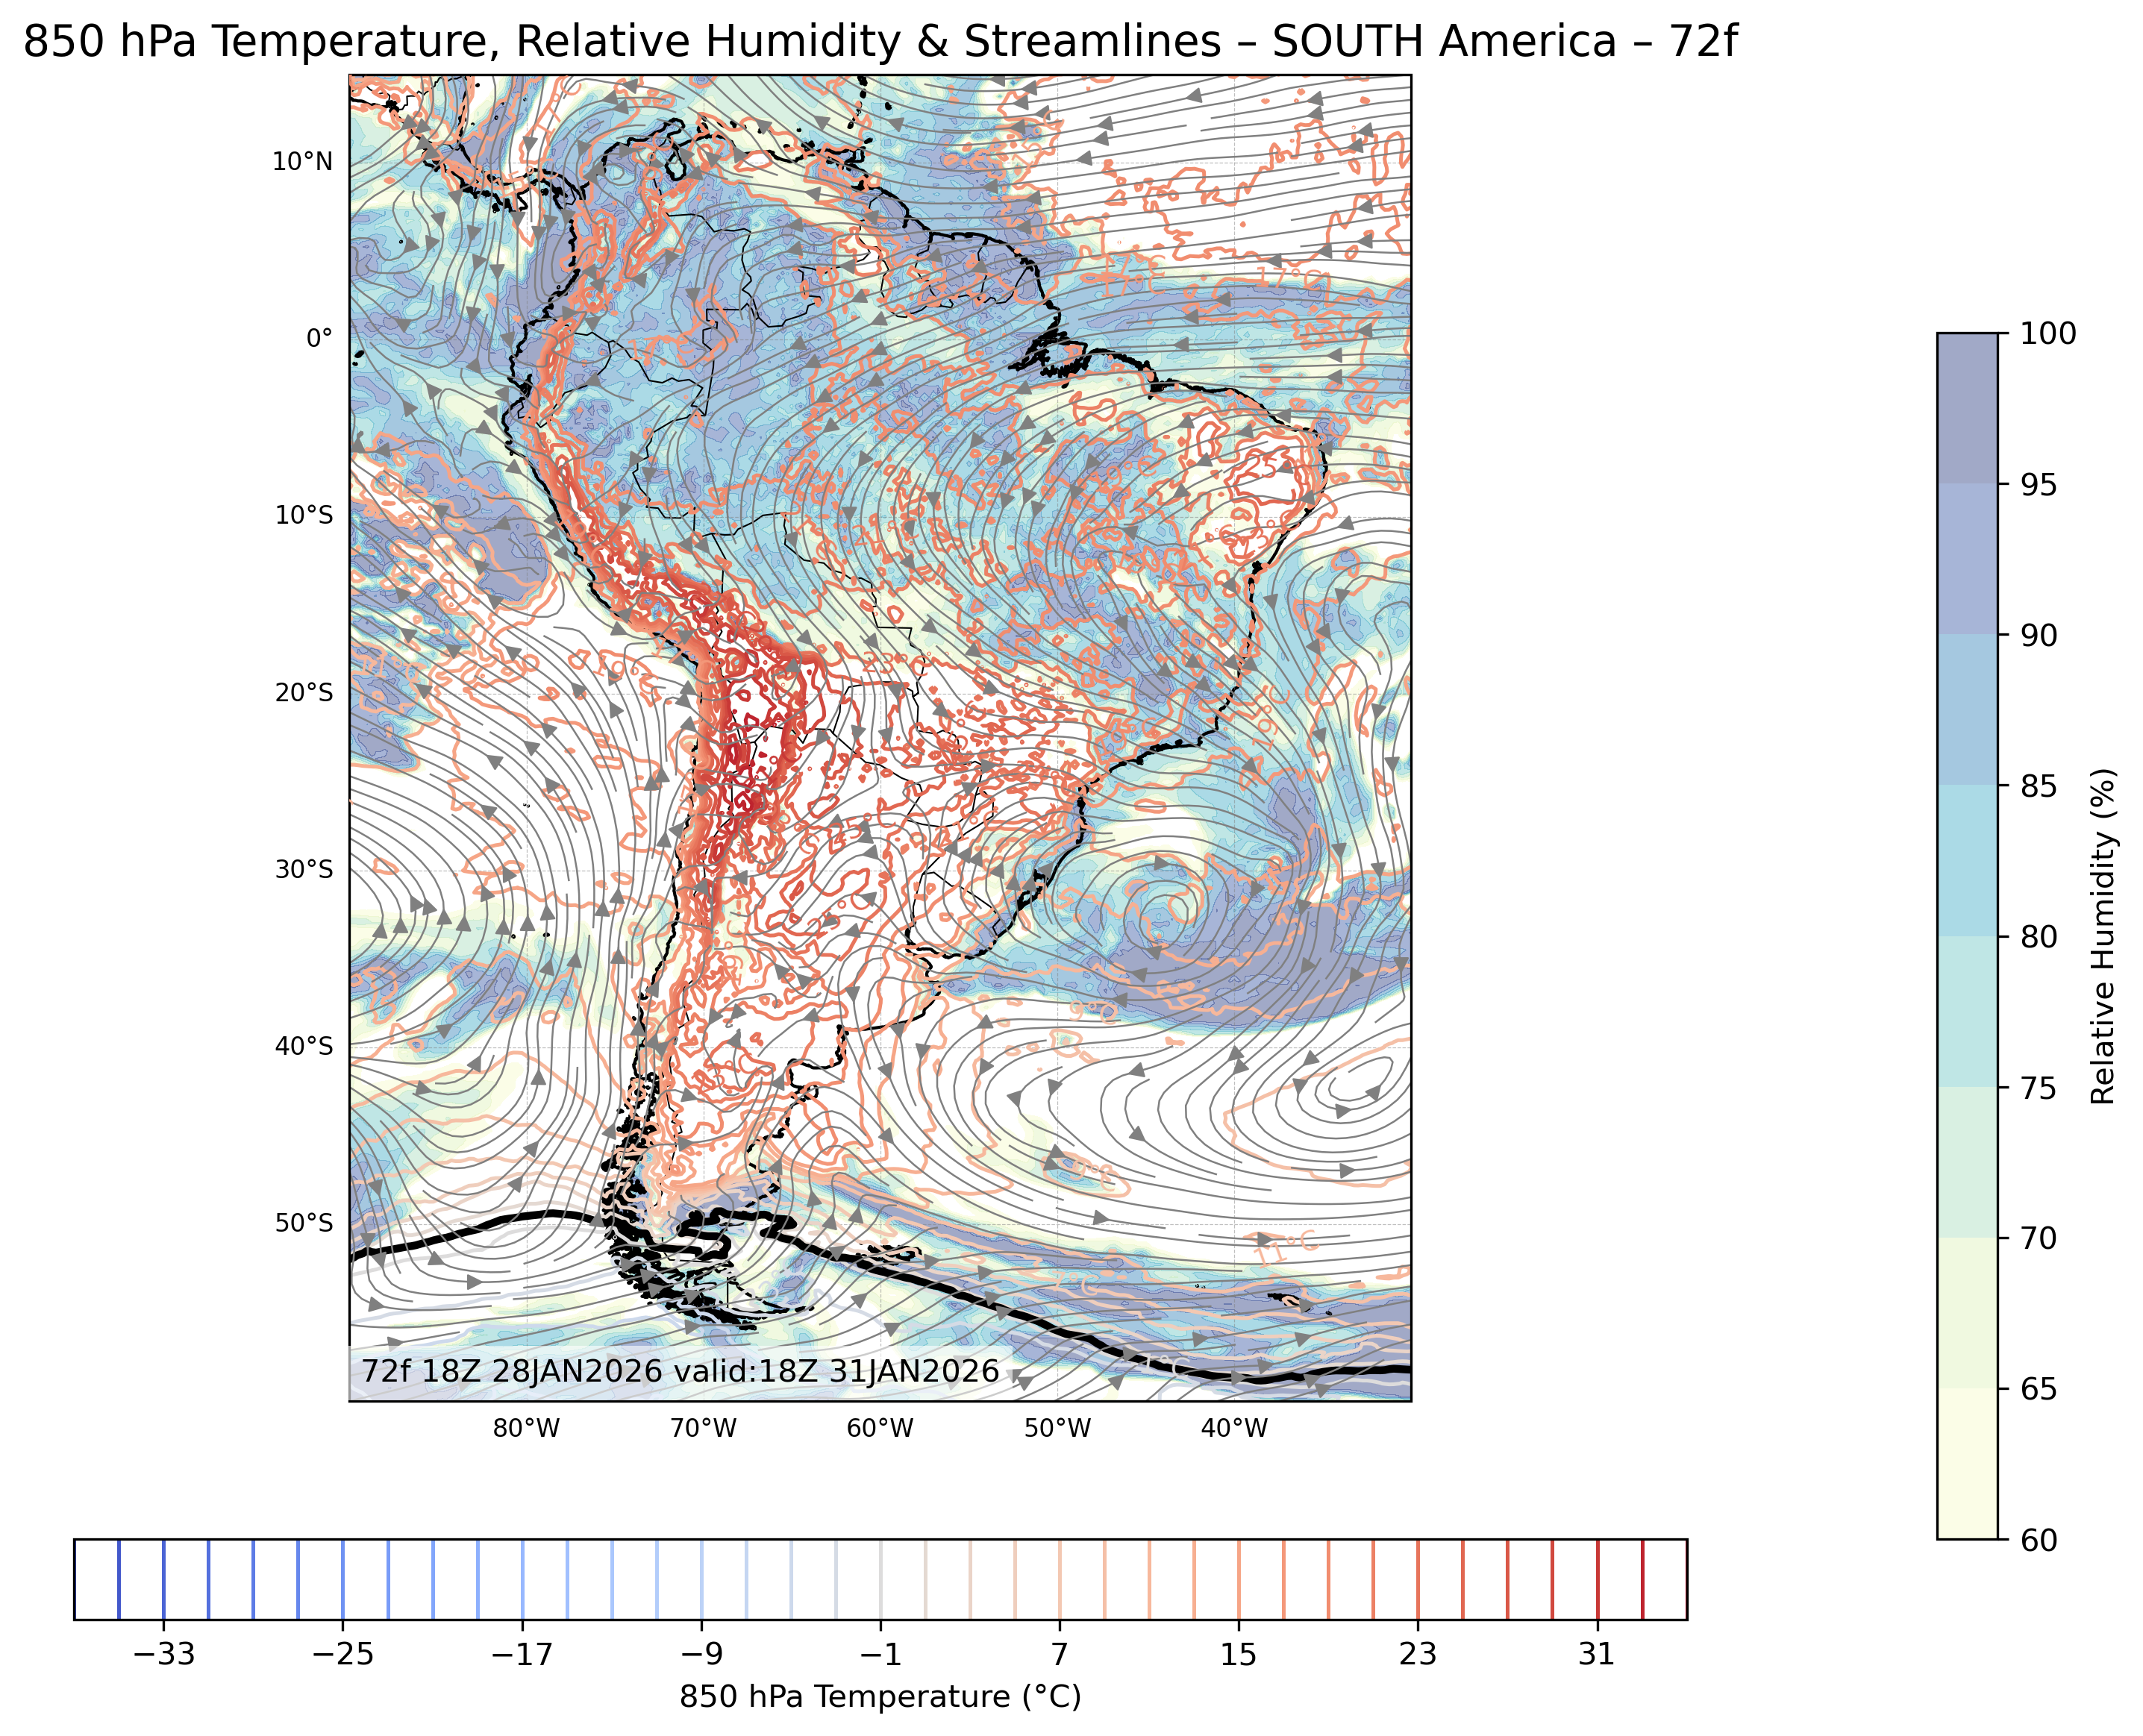
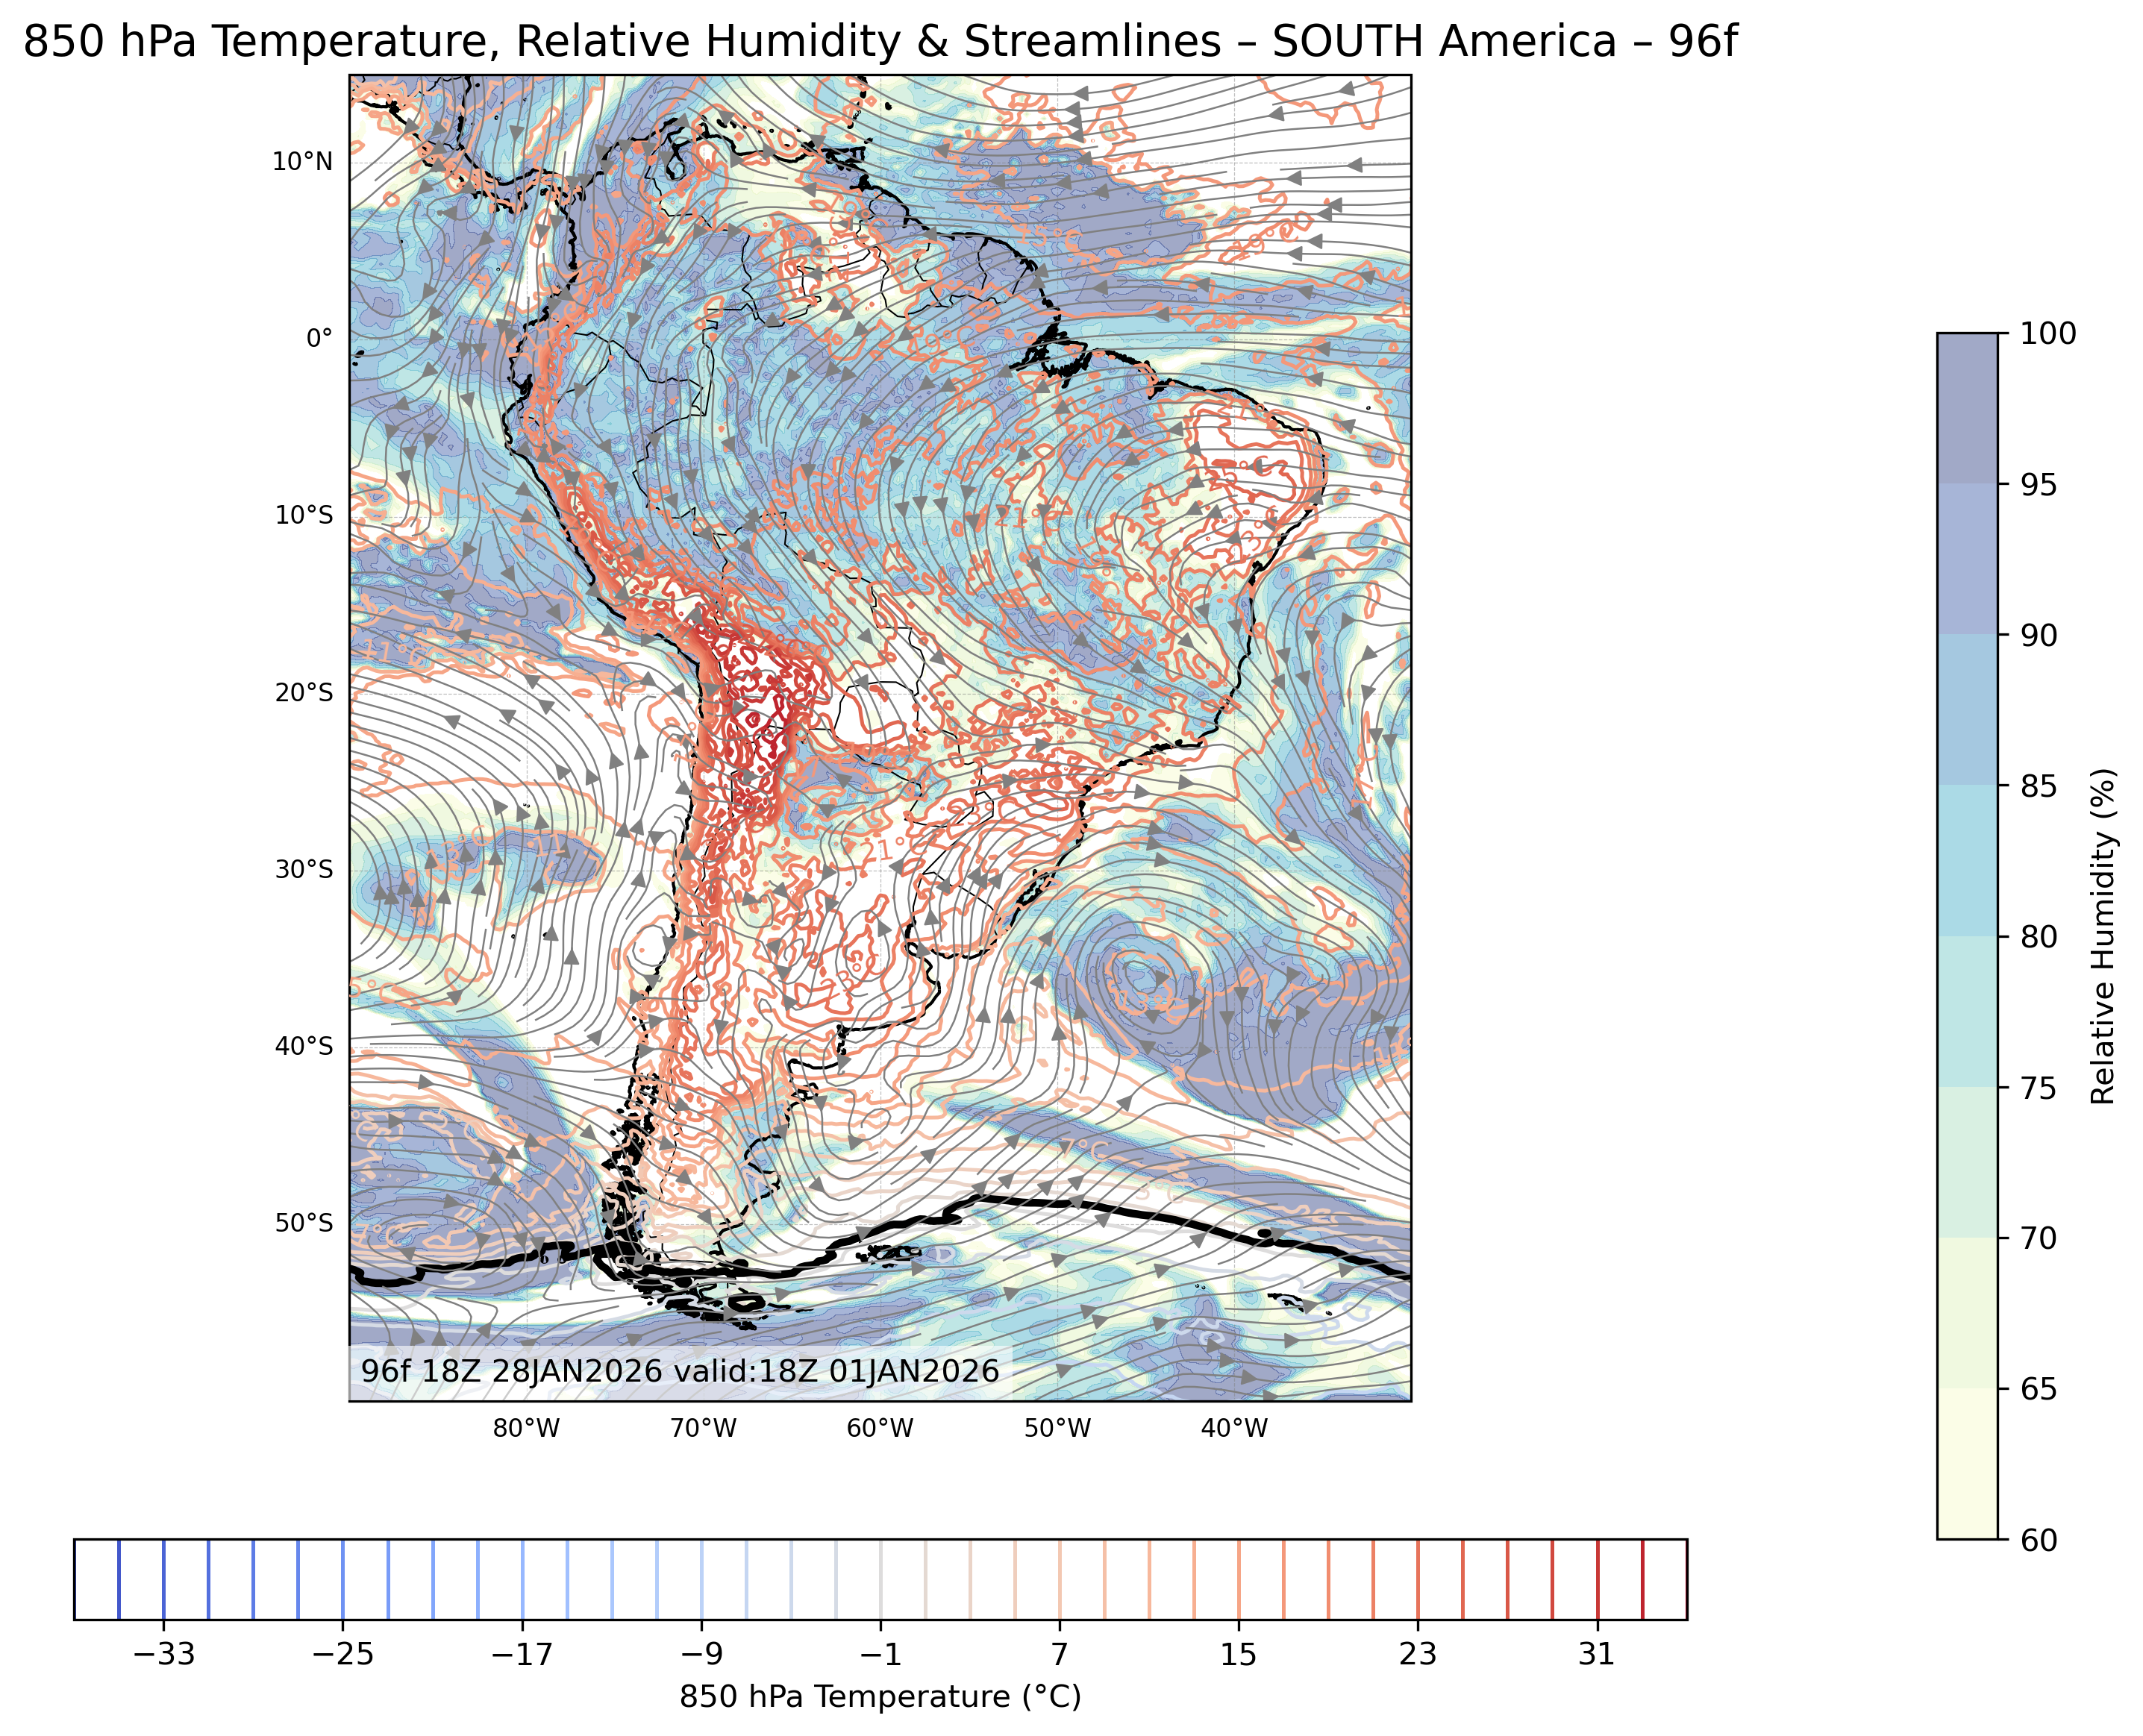
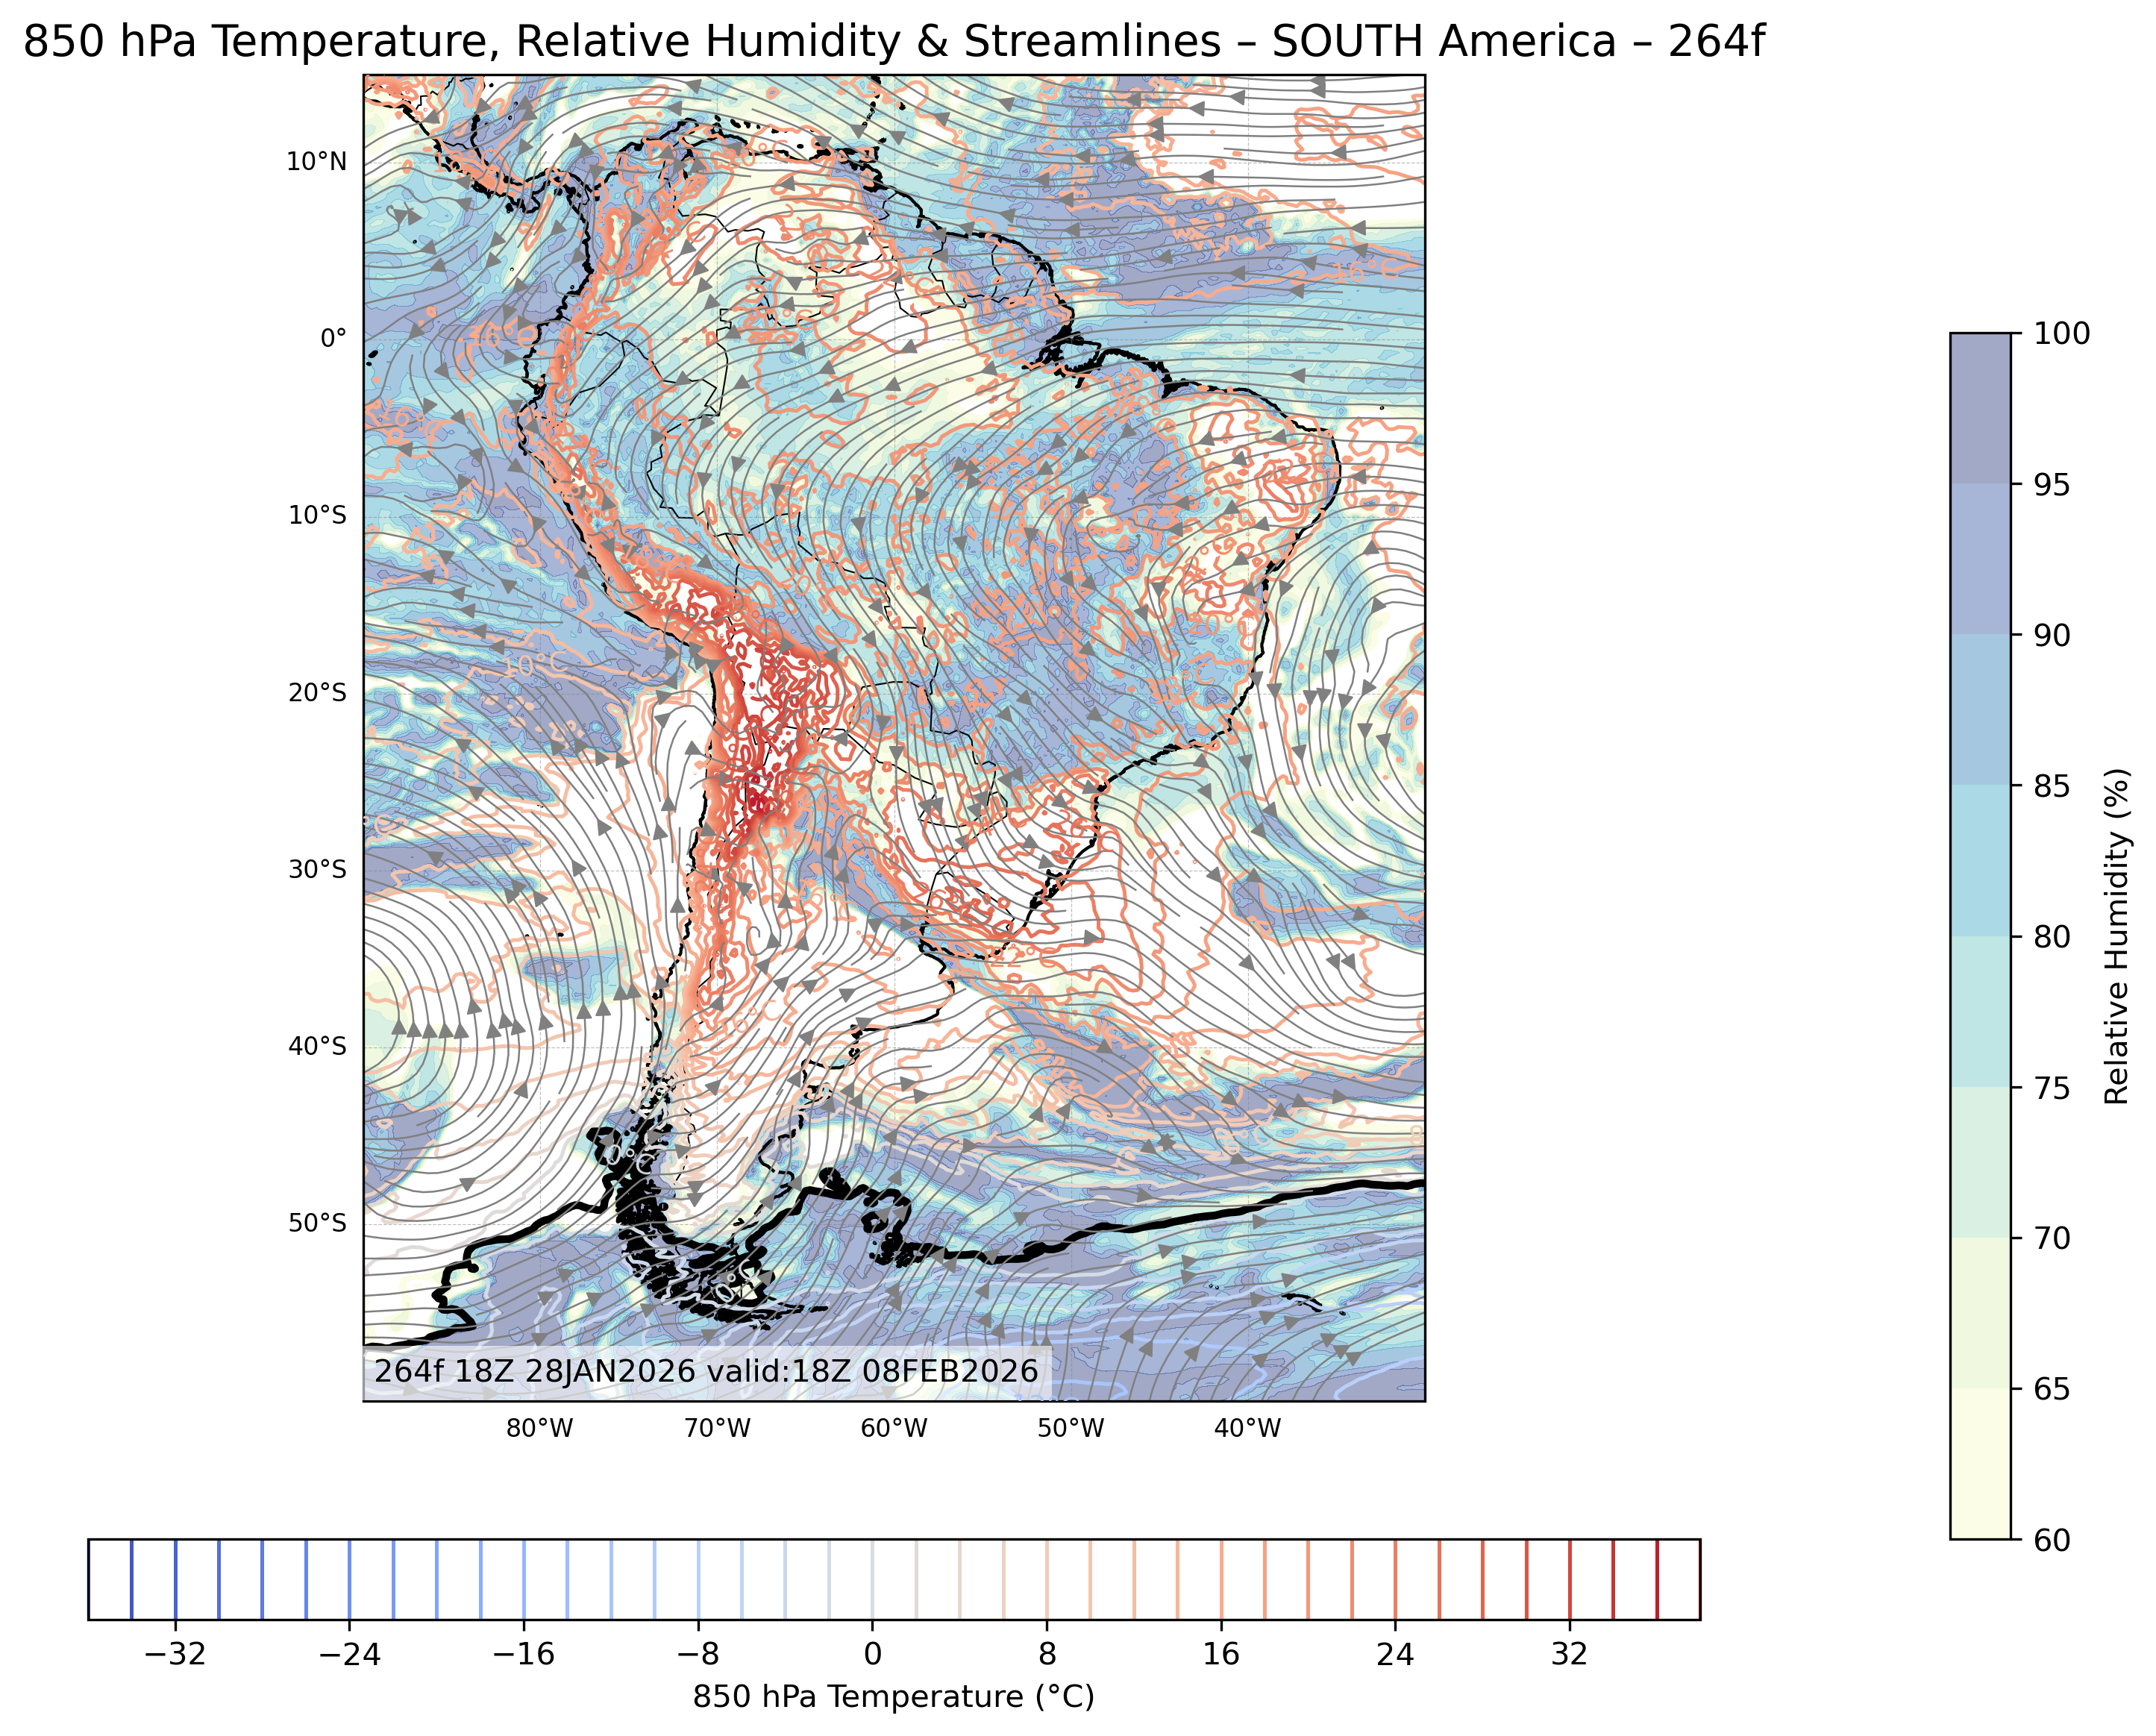
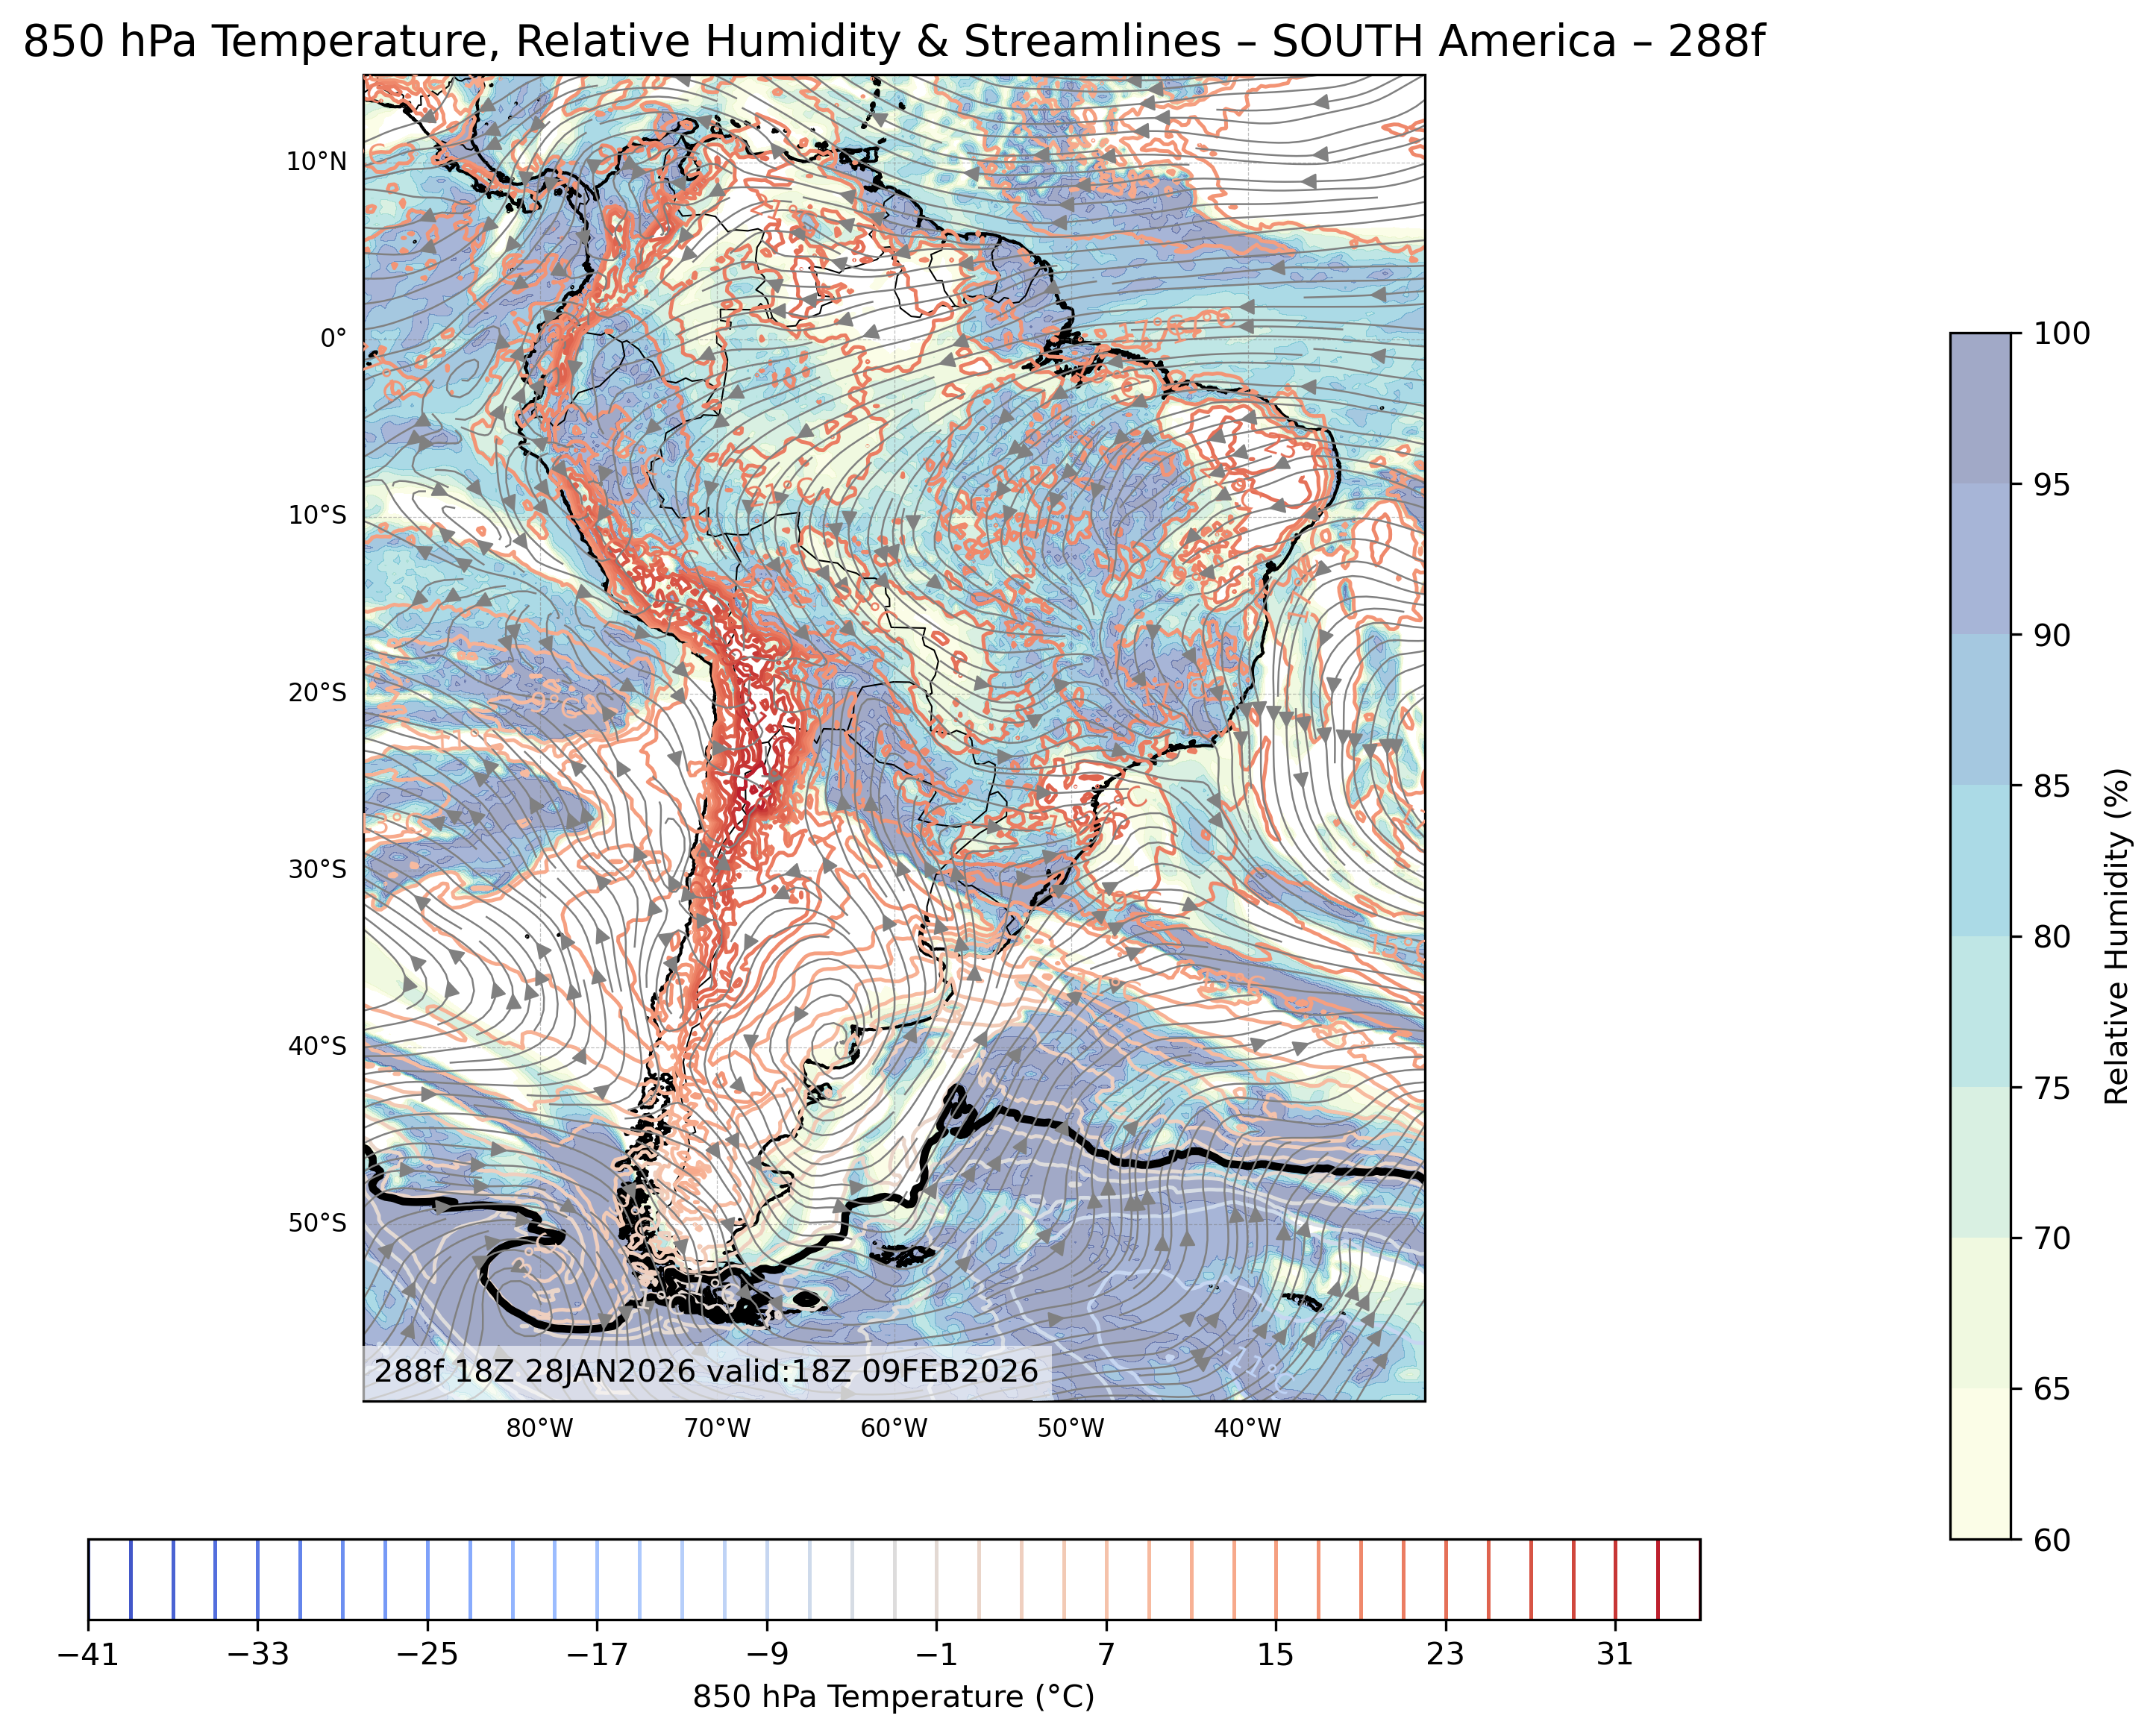
| 850mb Temperature Relative Humidity & Winds |
All Times |
🔍 | 🔍 | 🔍 | 🔍 | 🔍 |
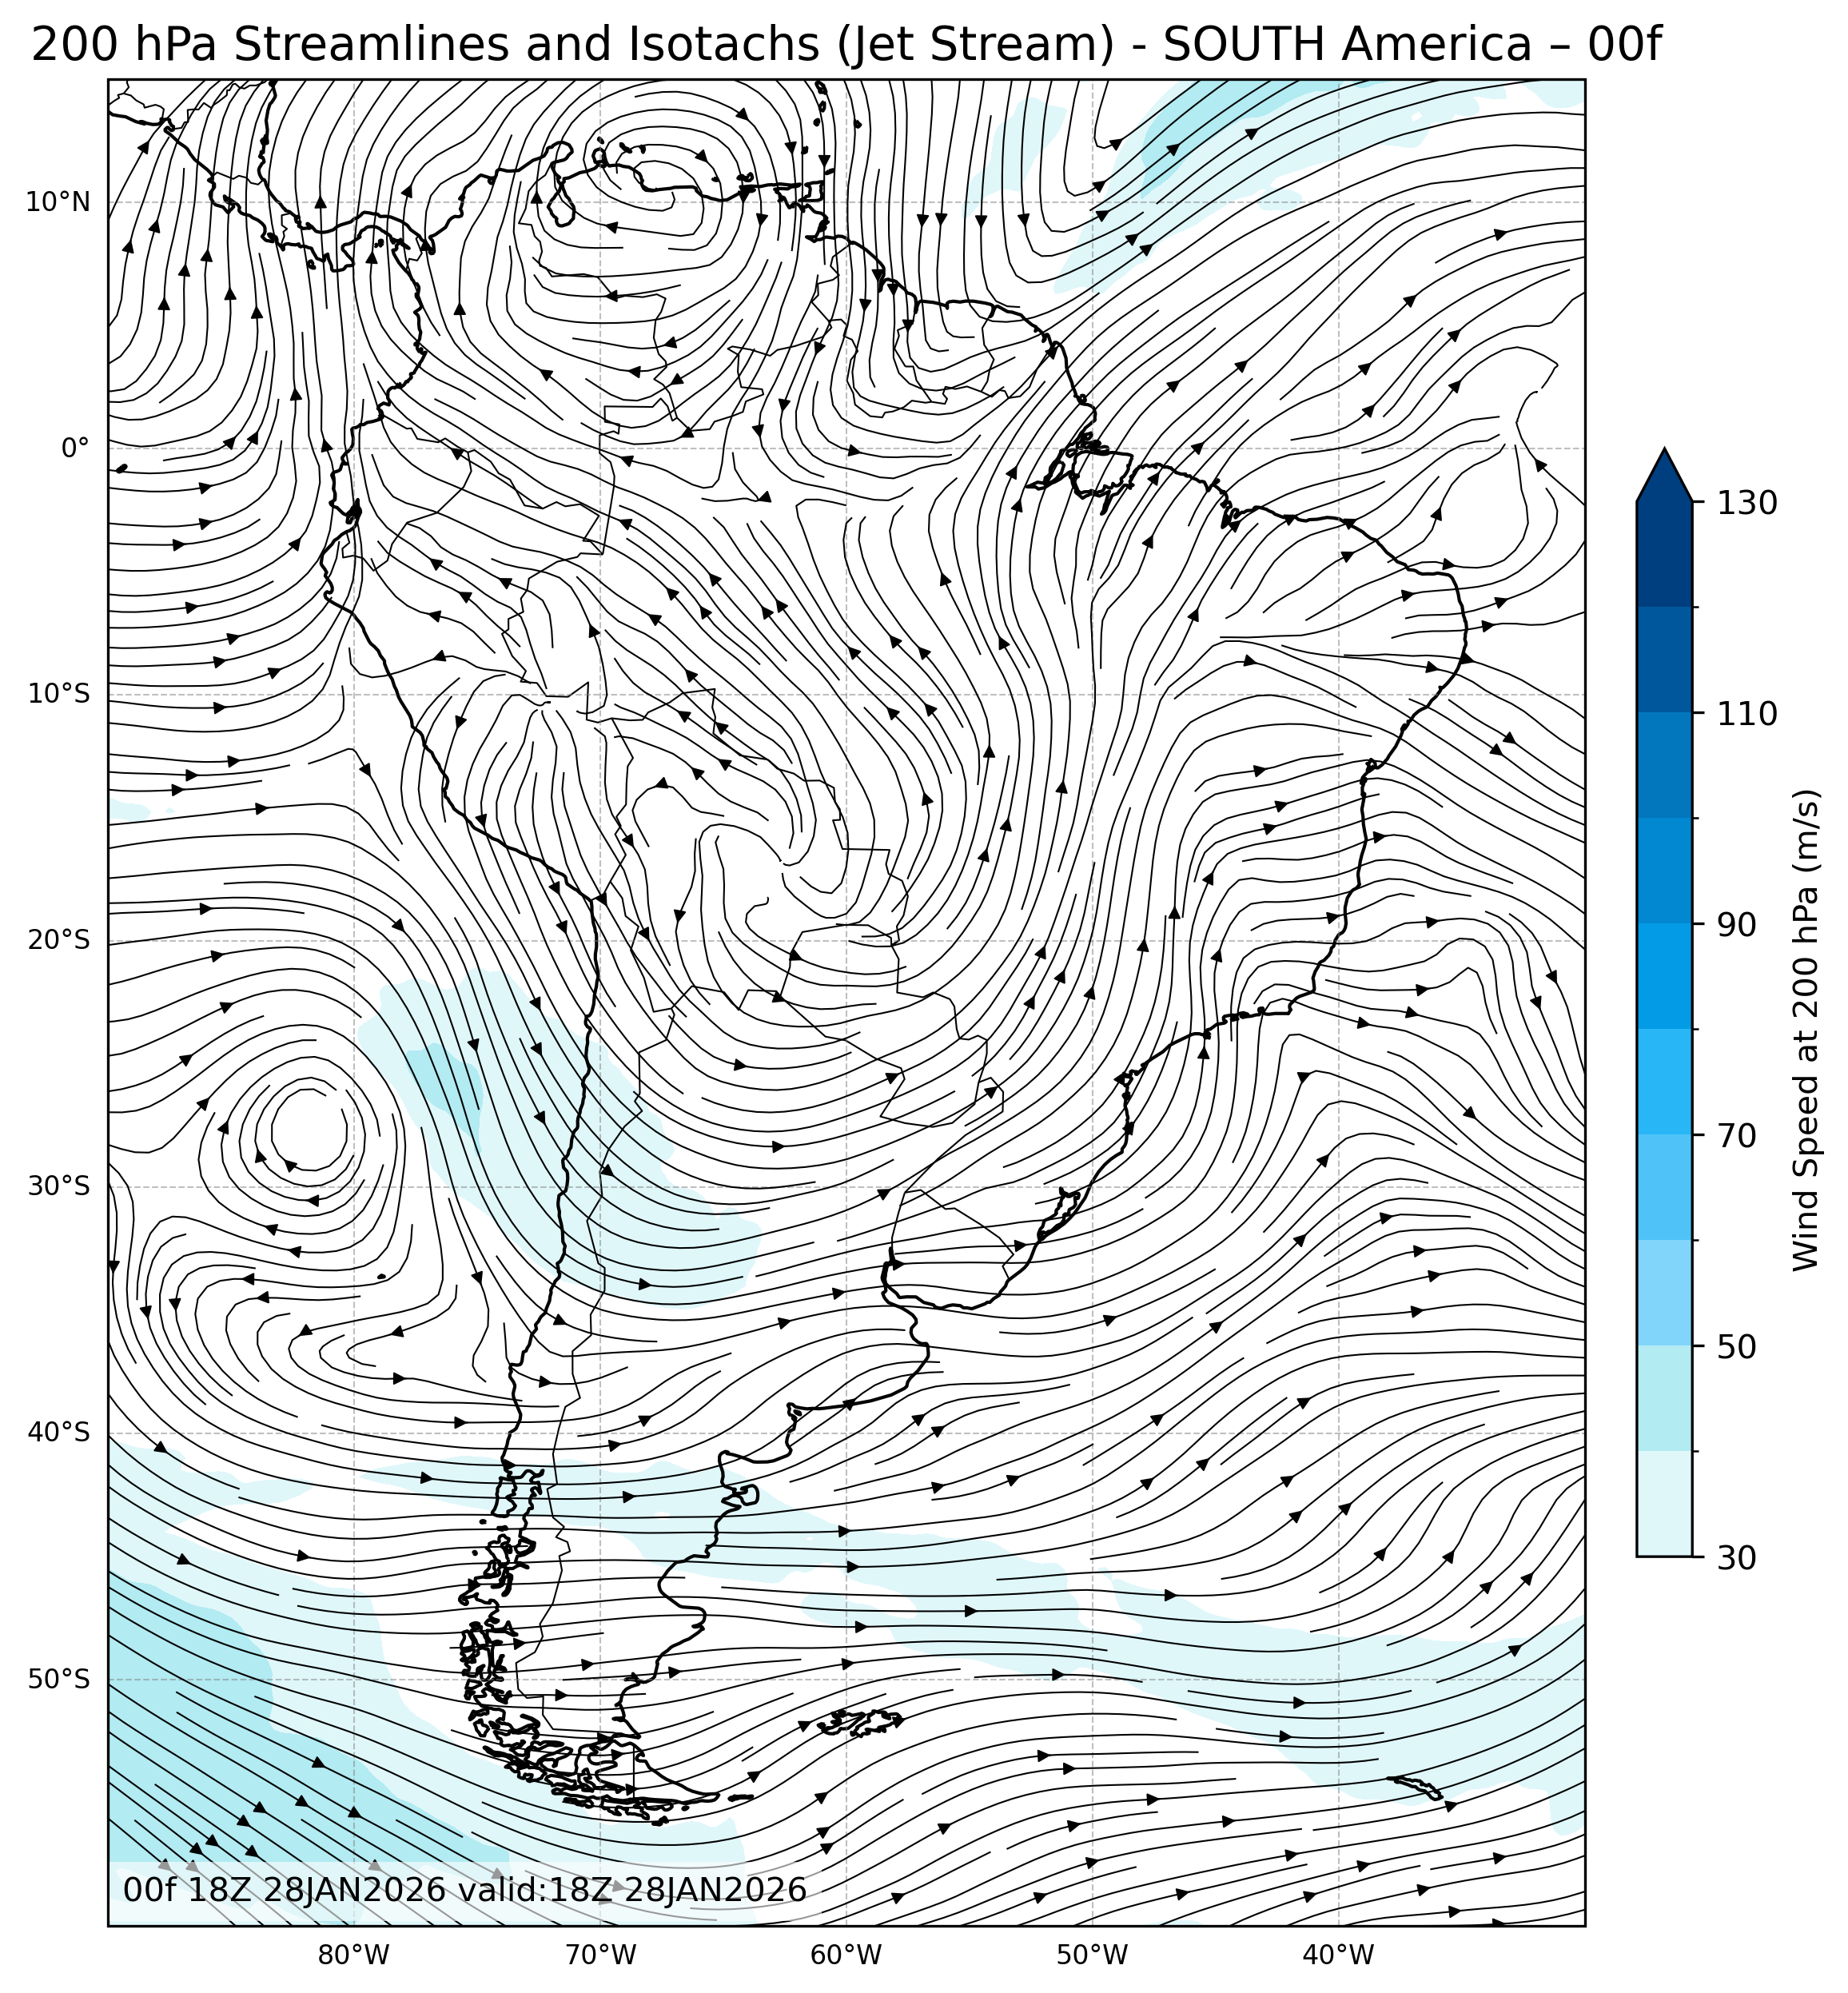
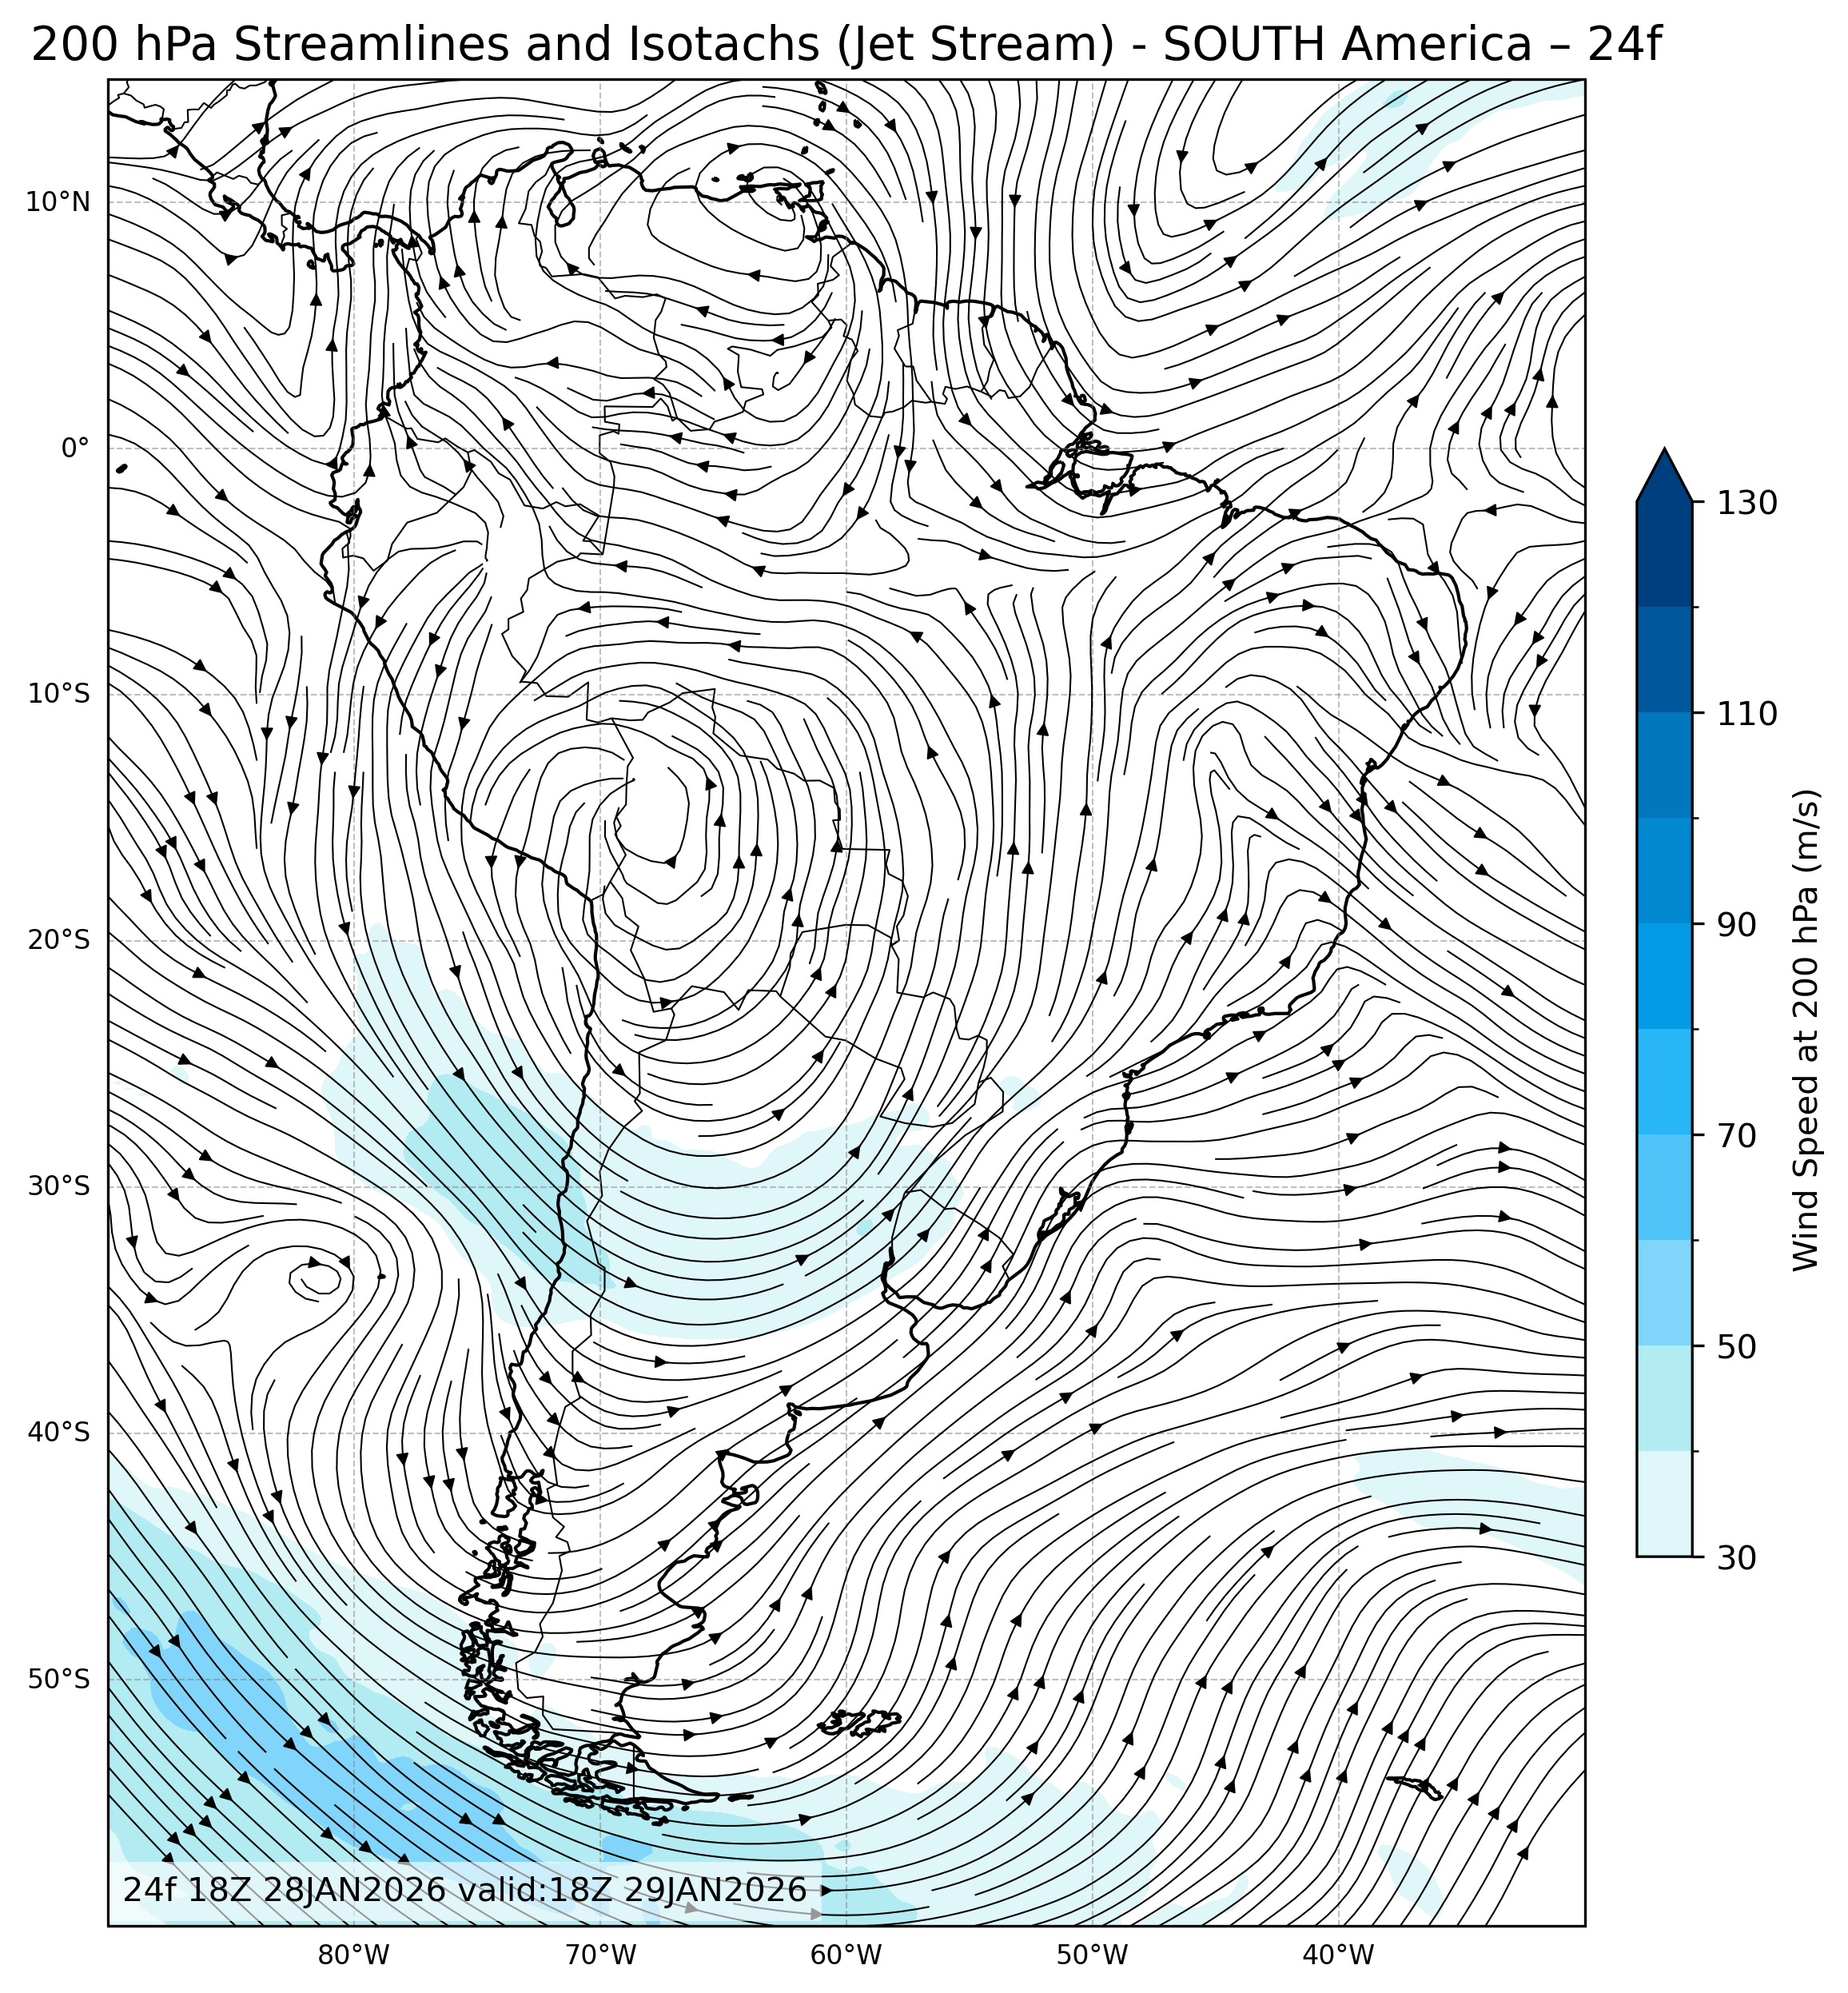
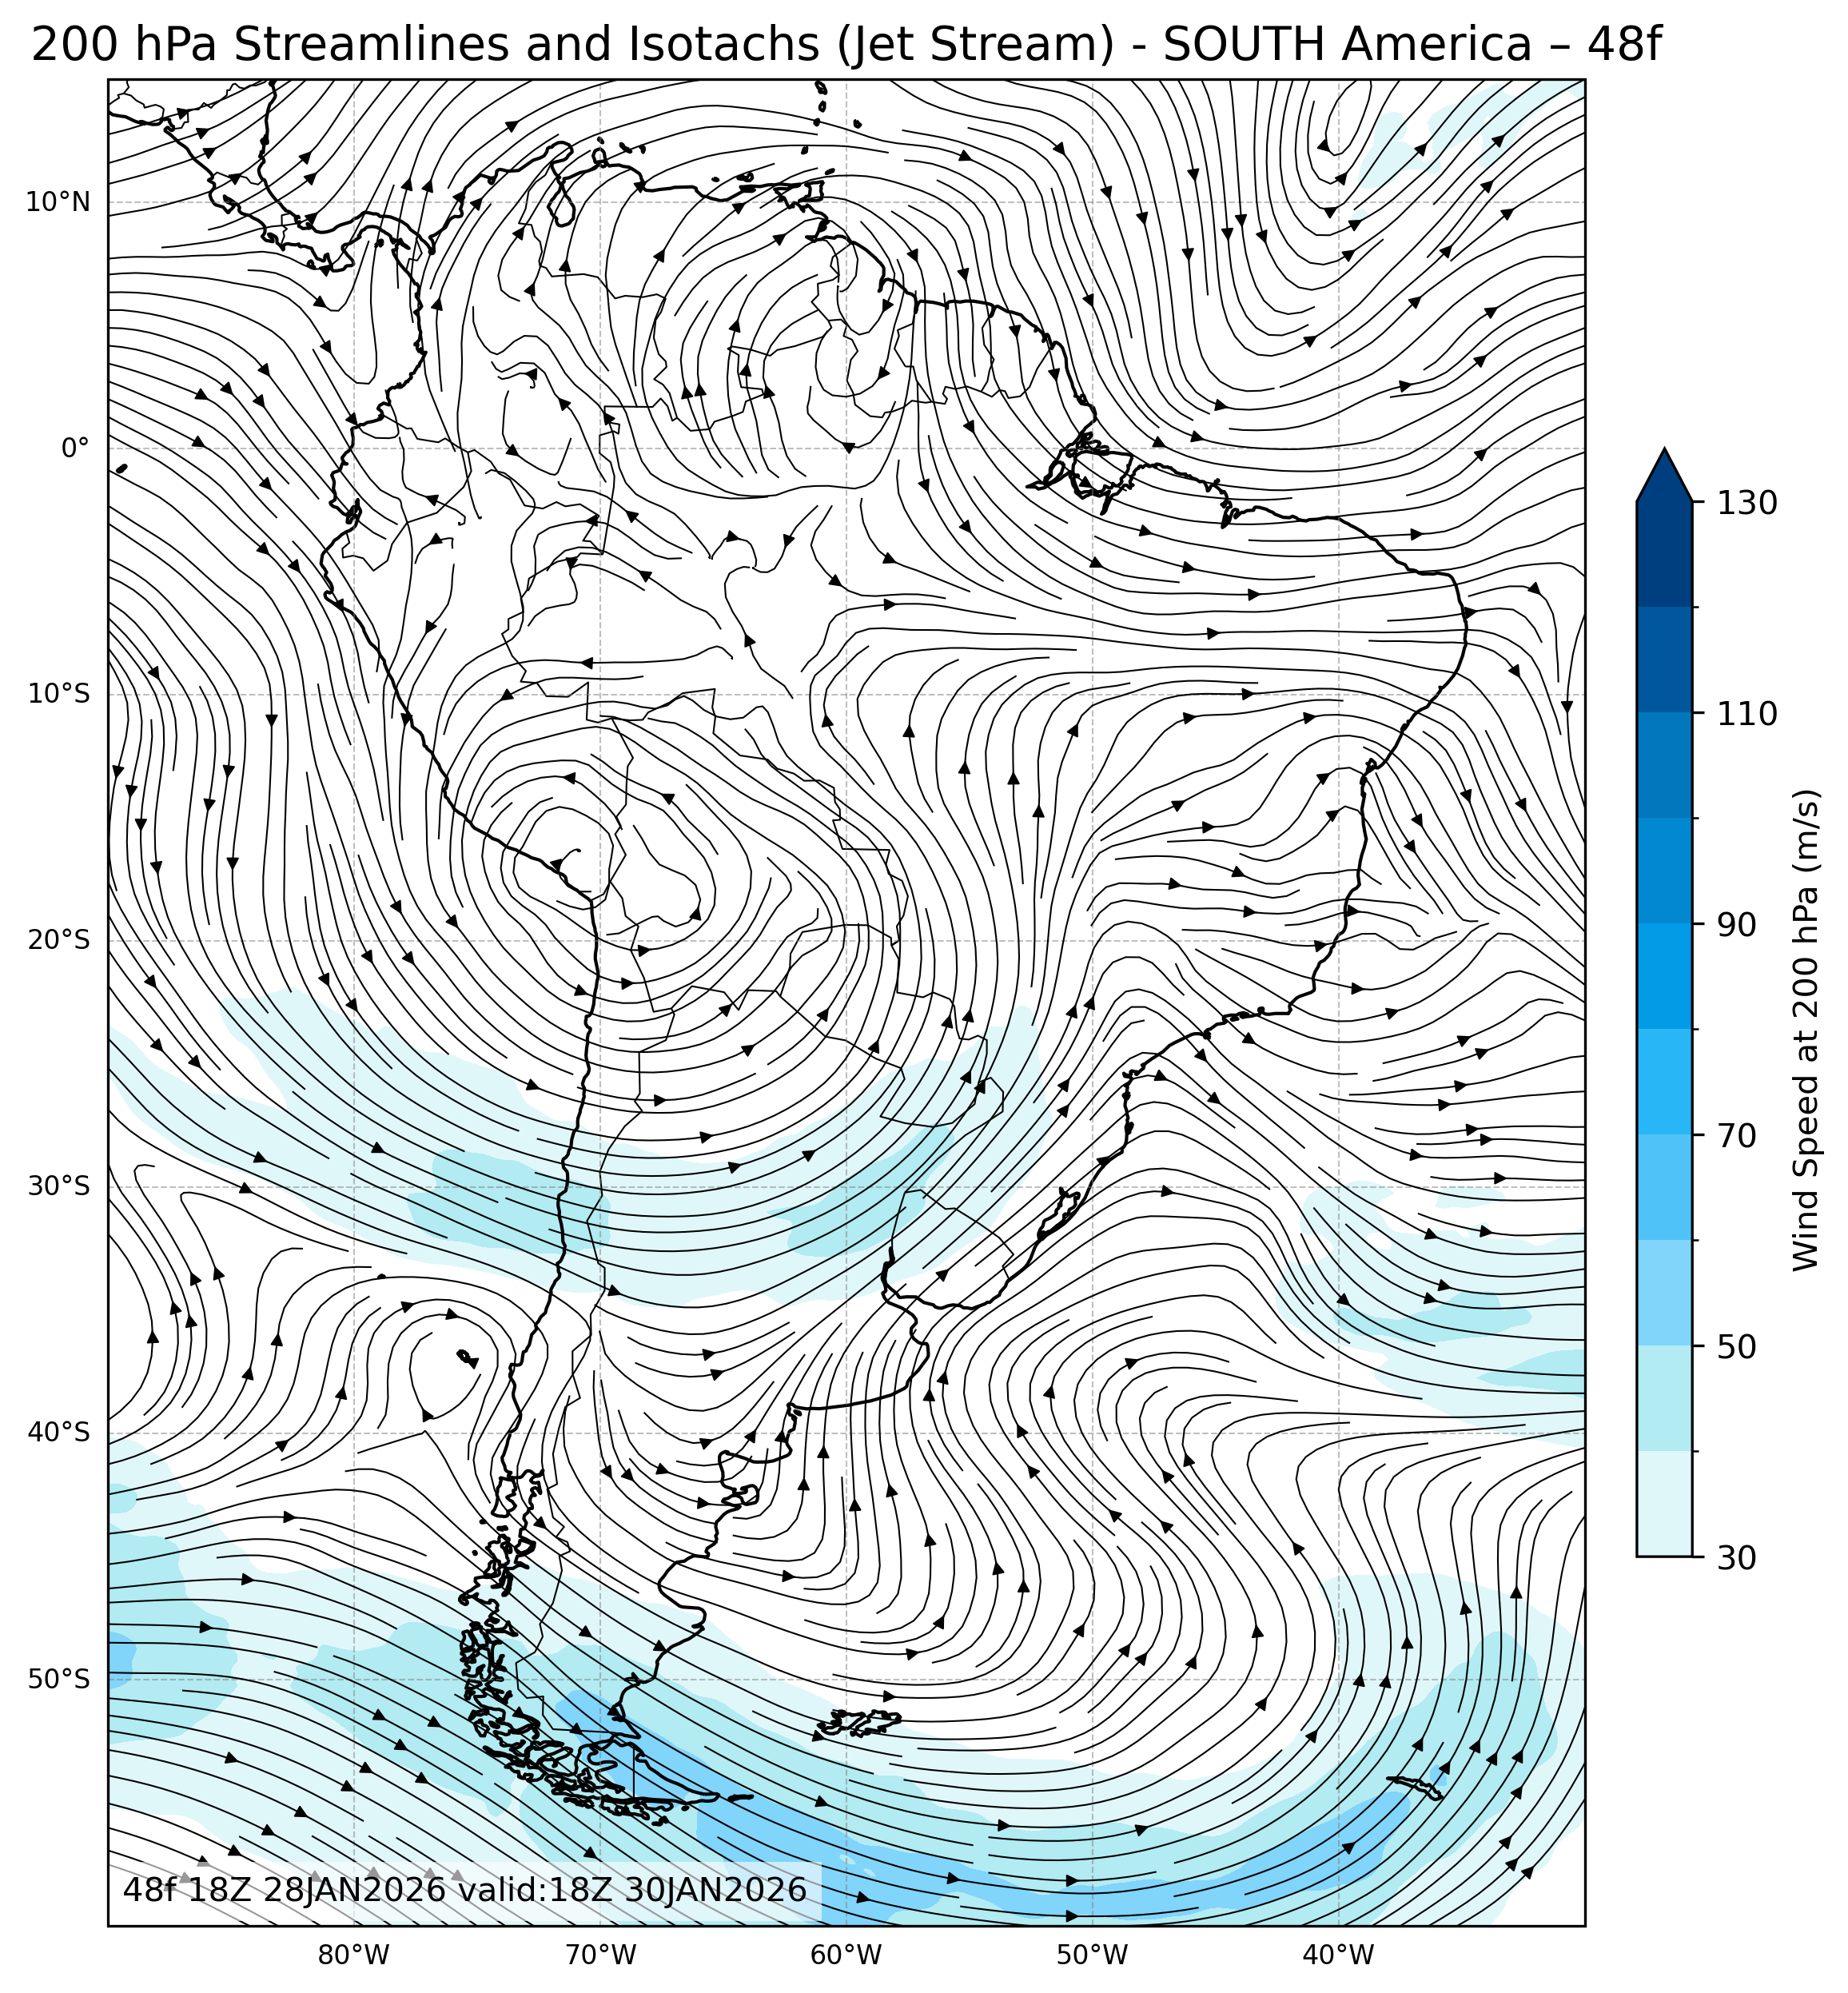
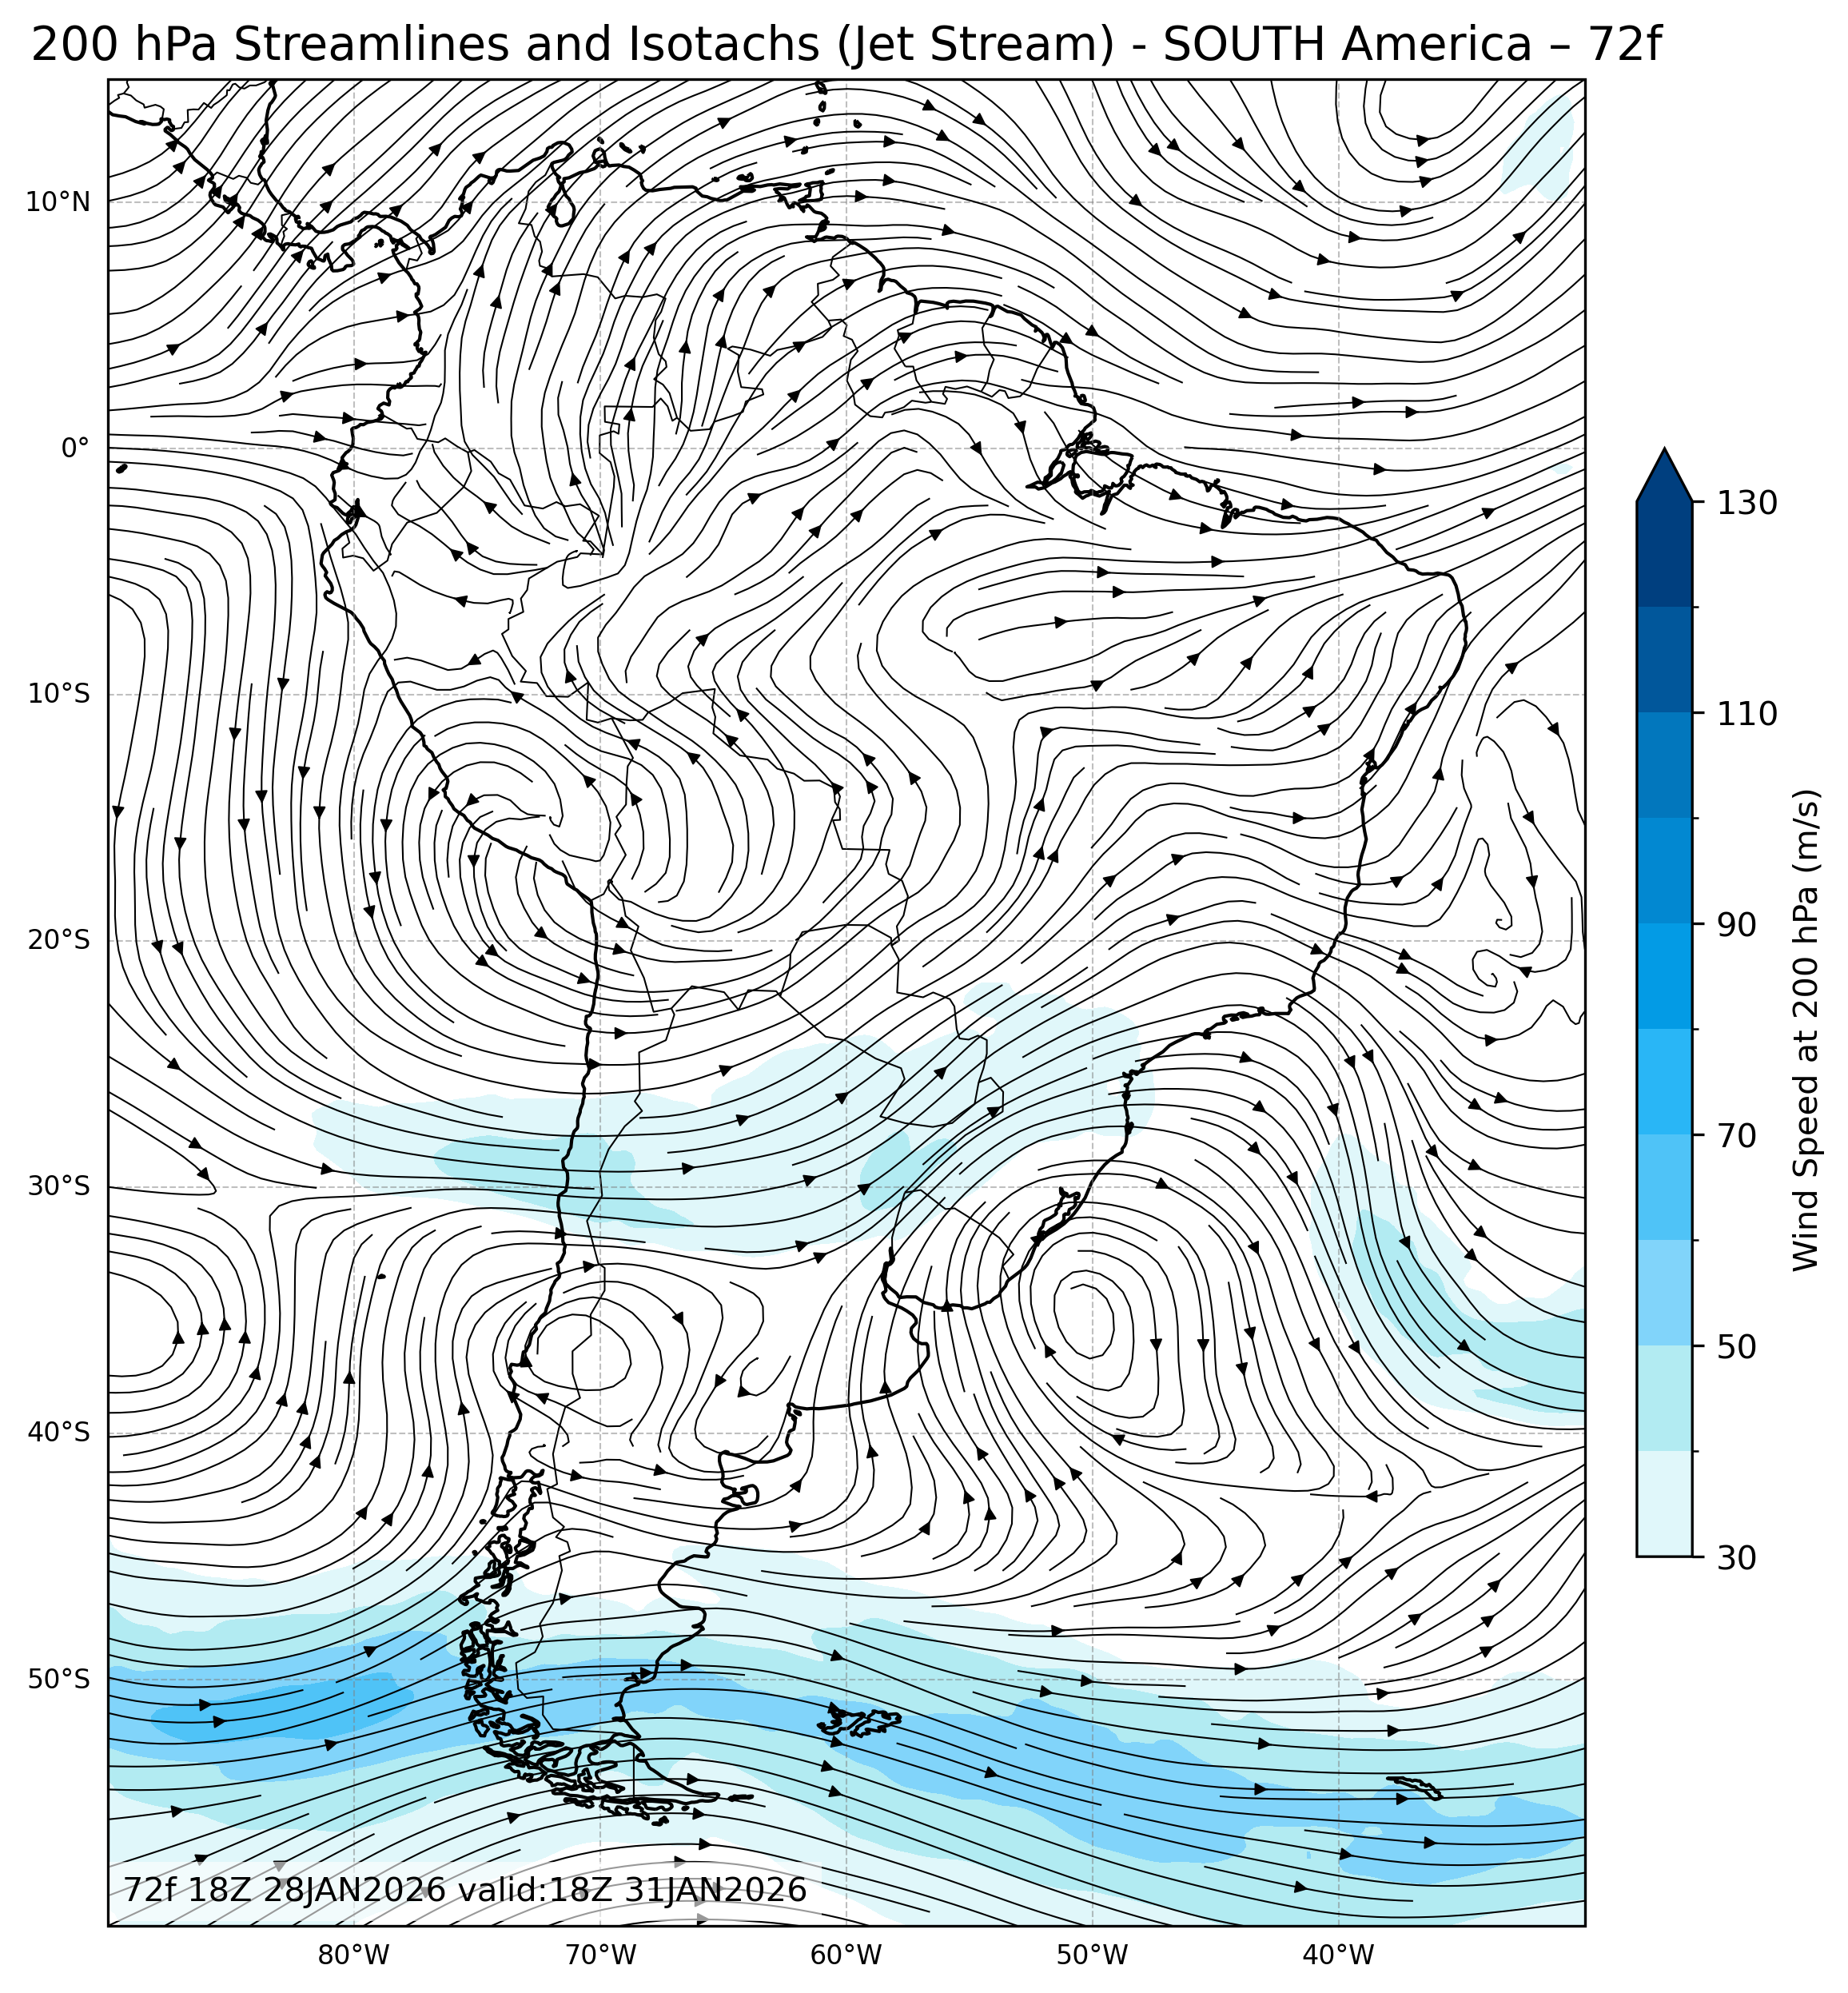
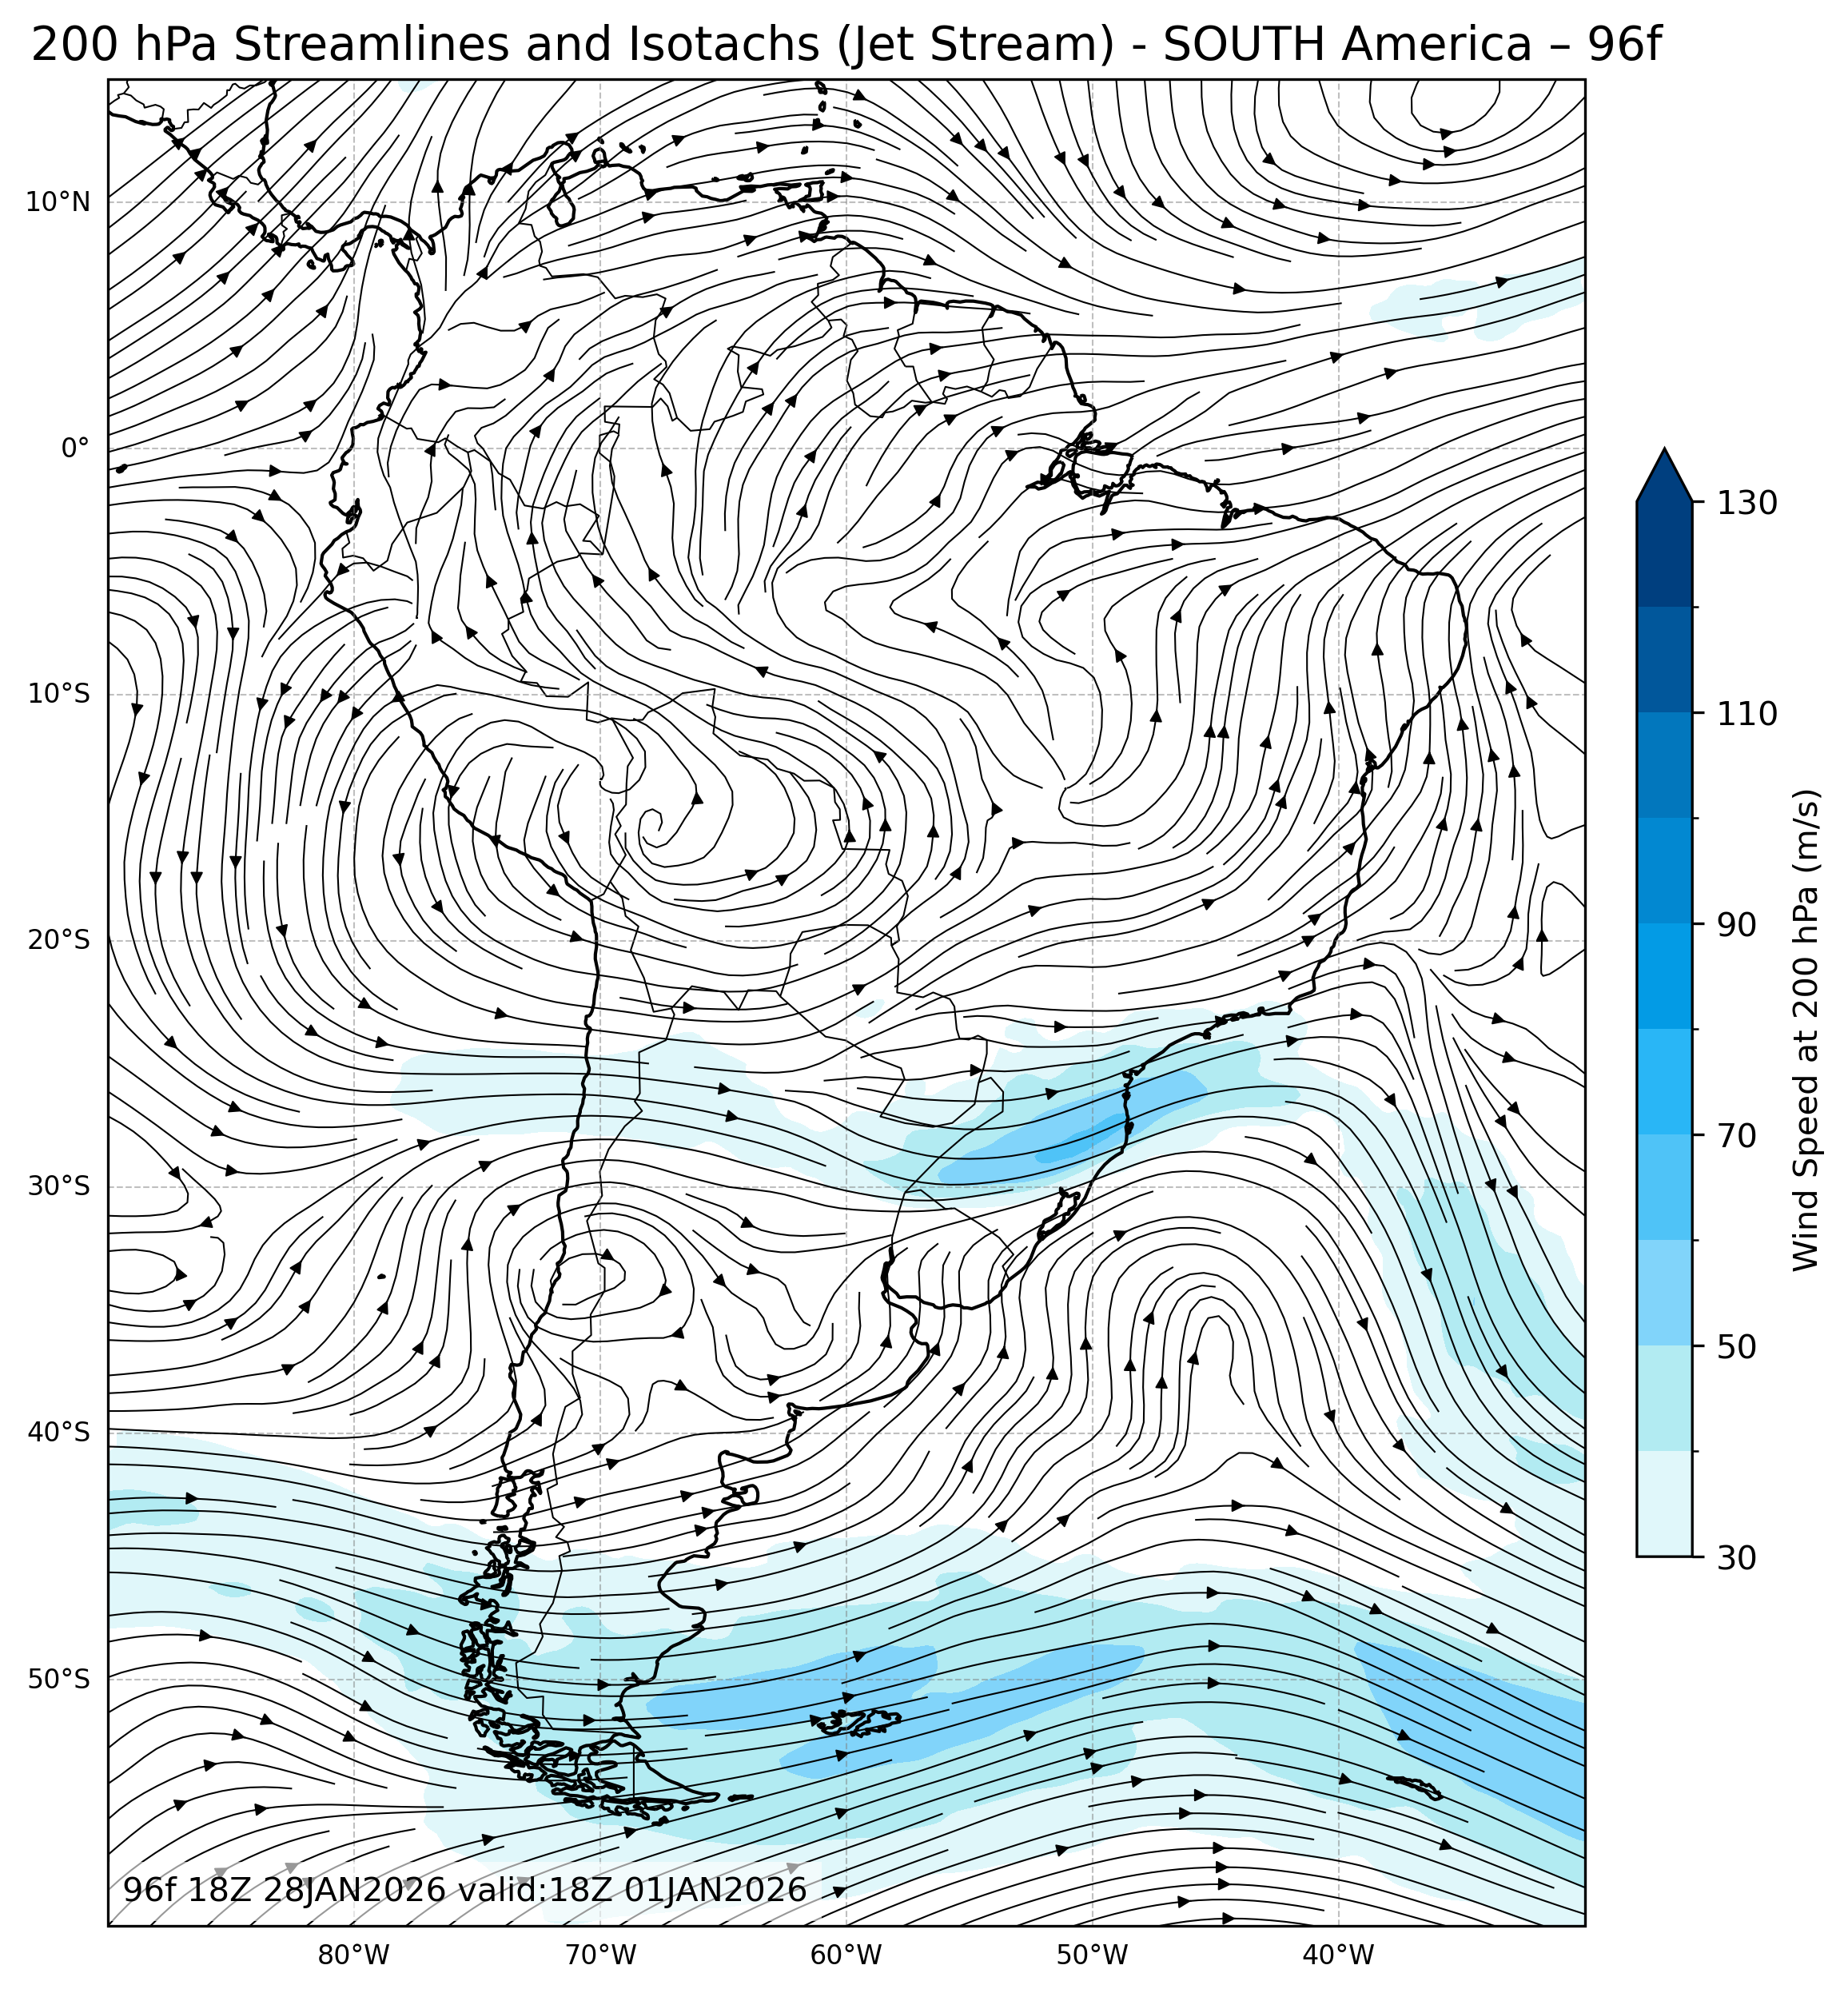
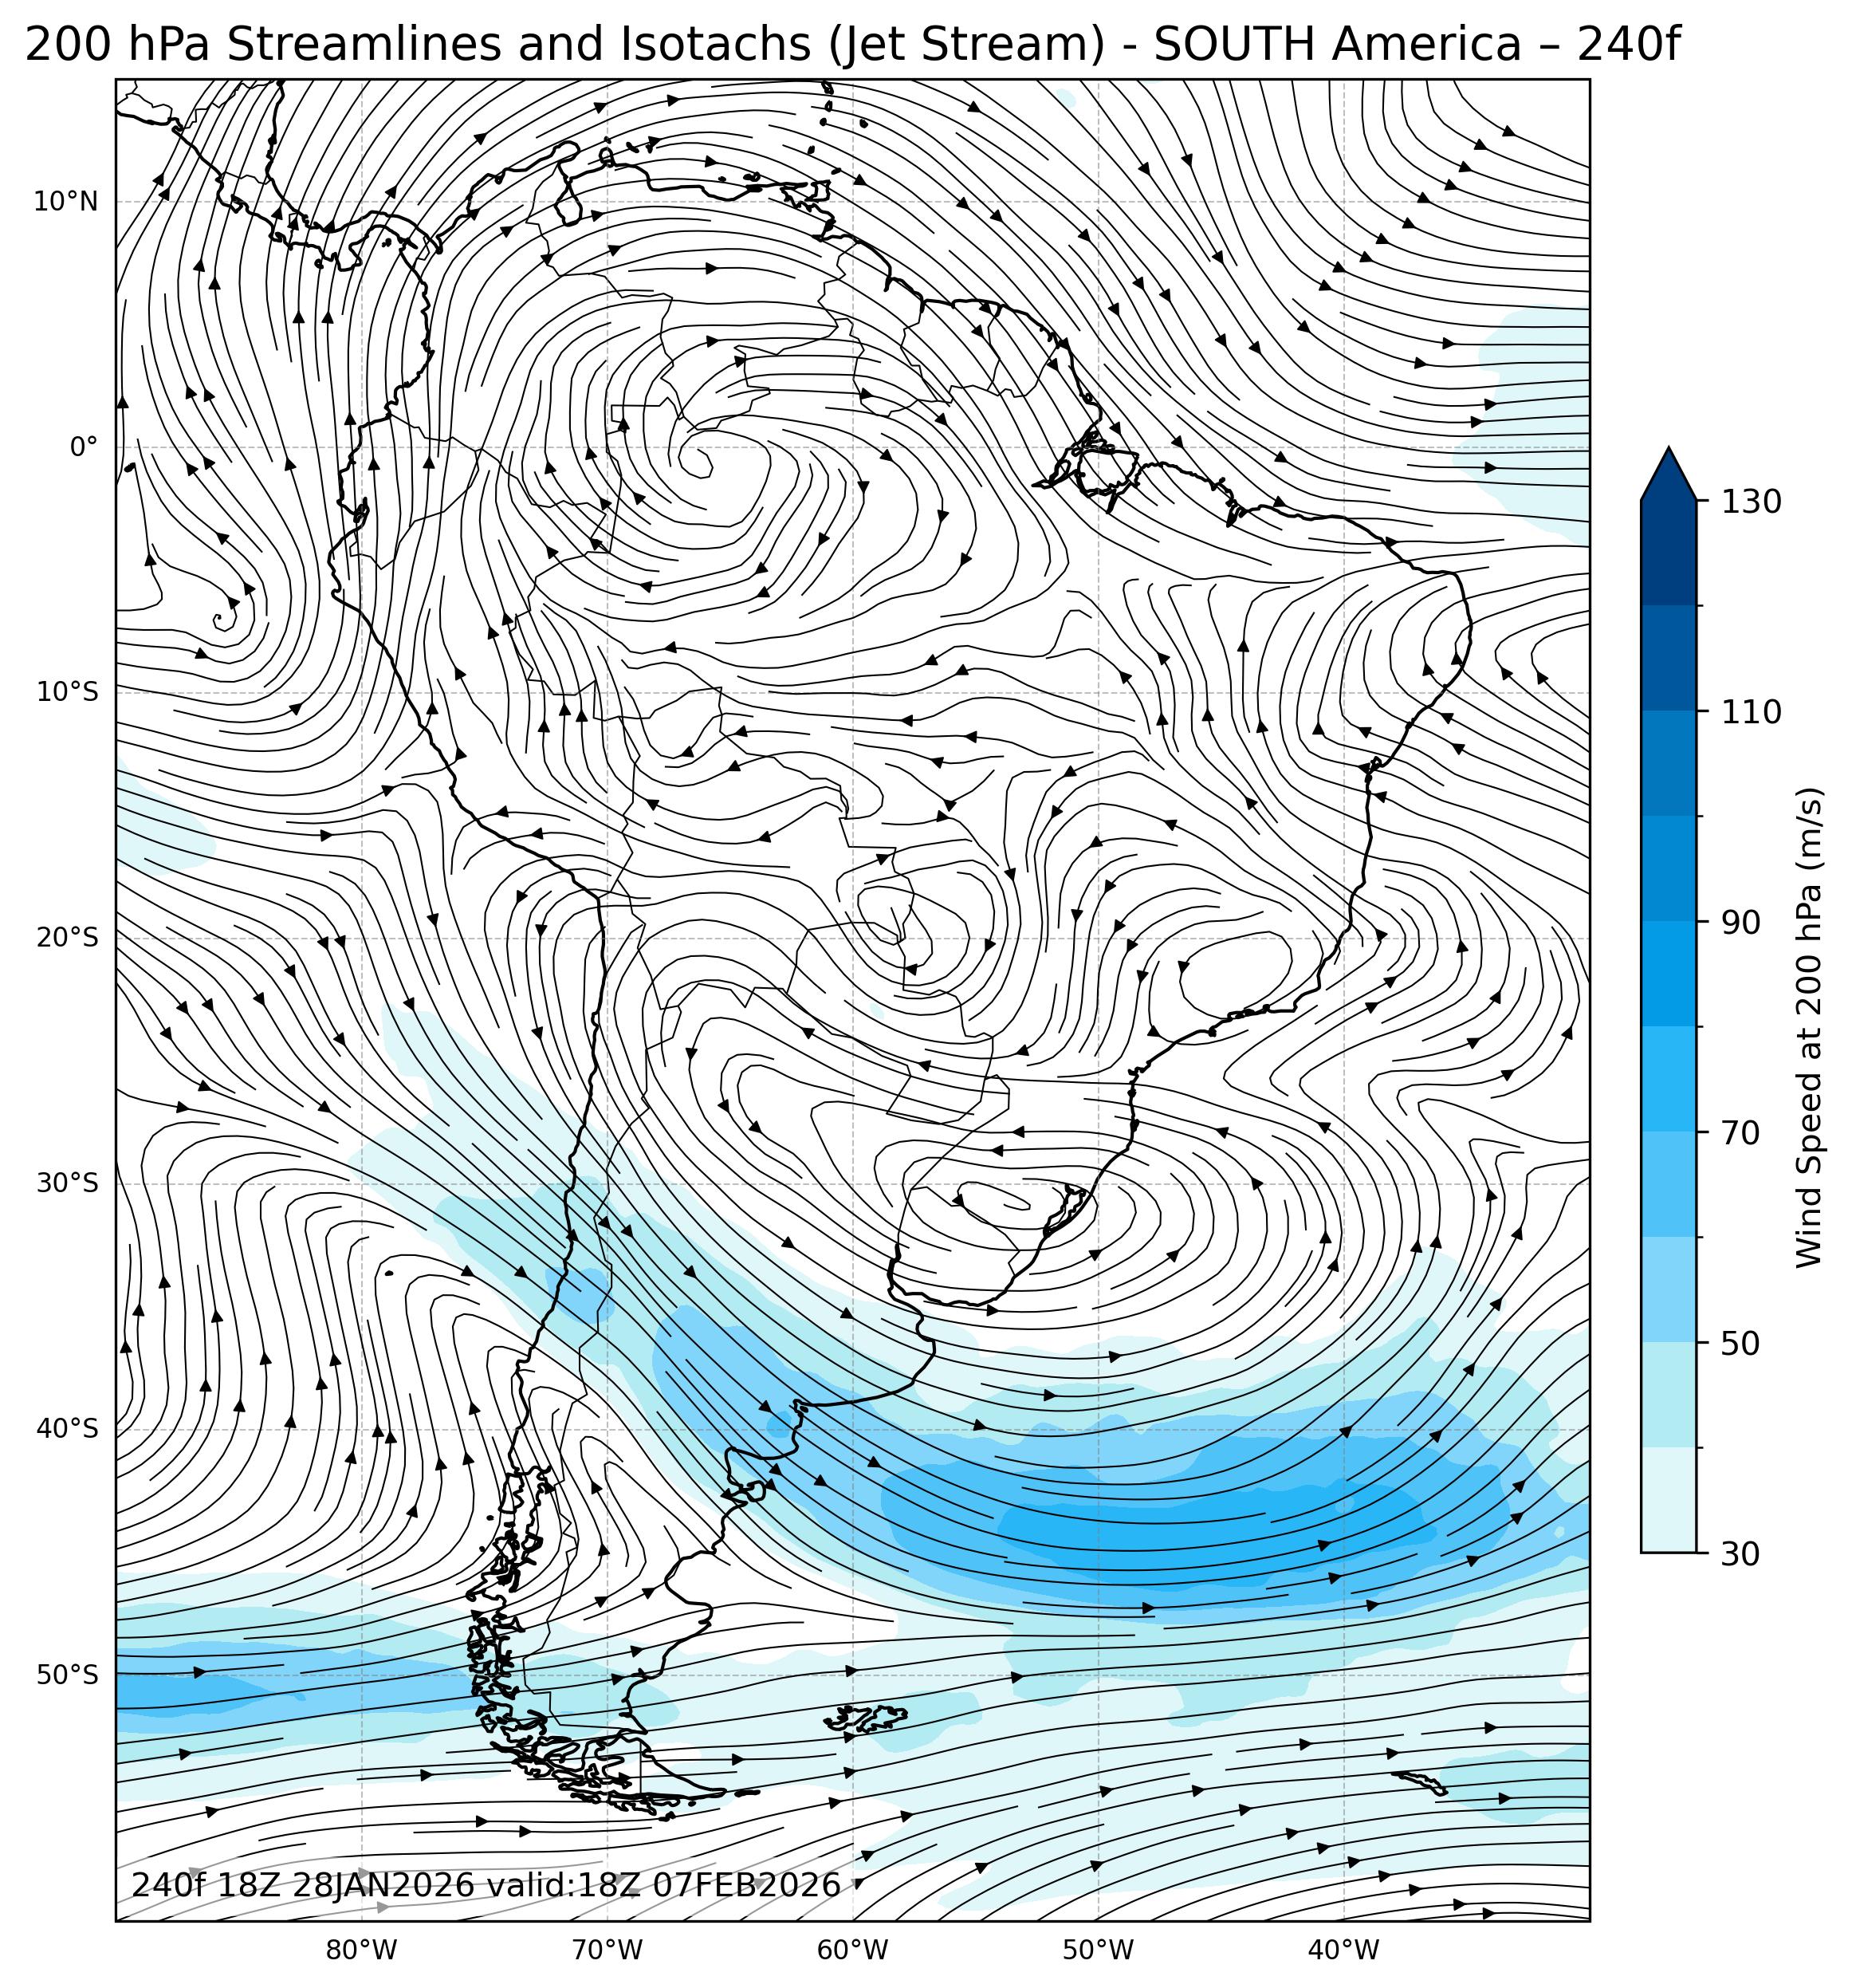
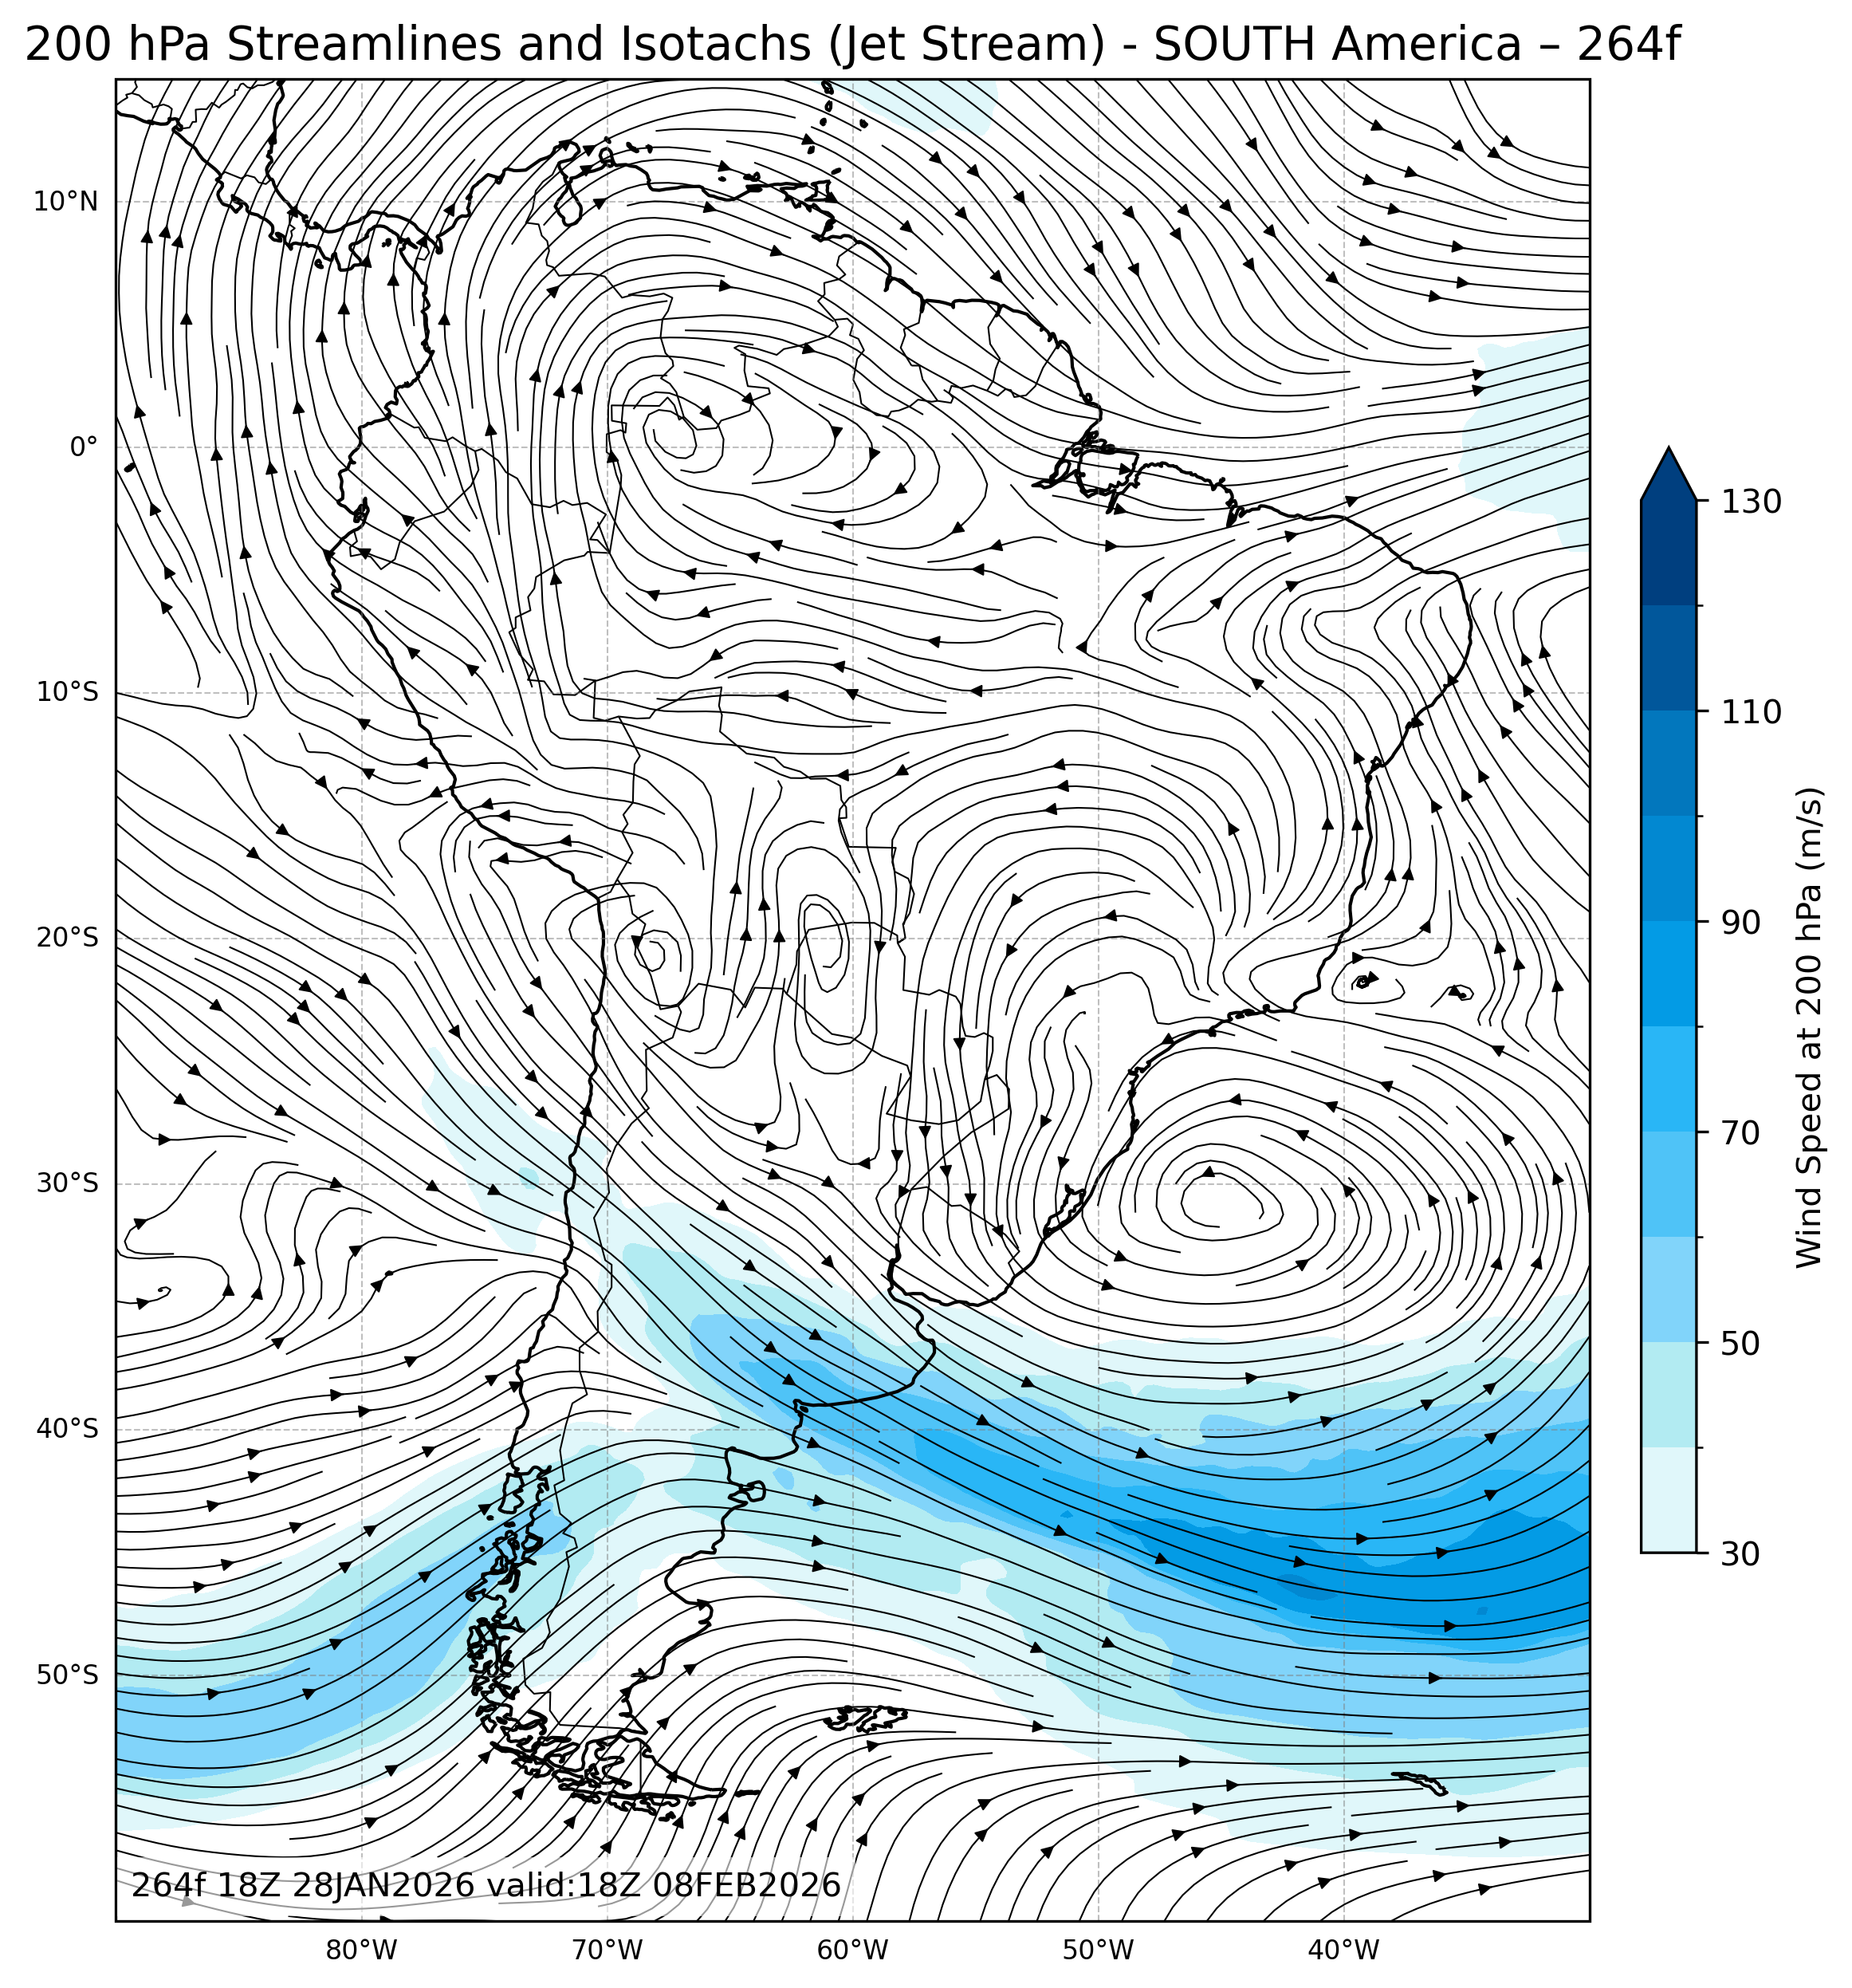
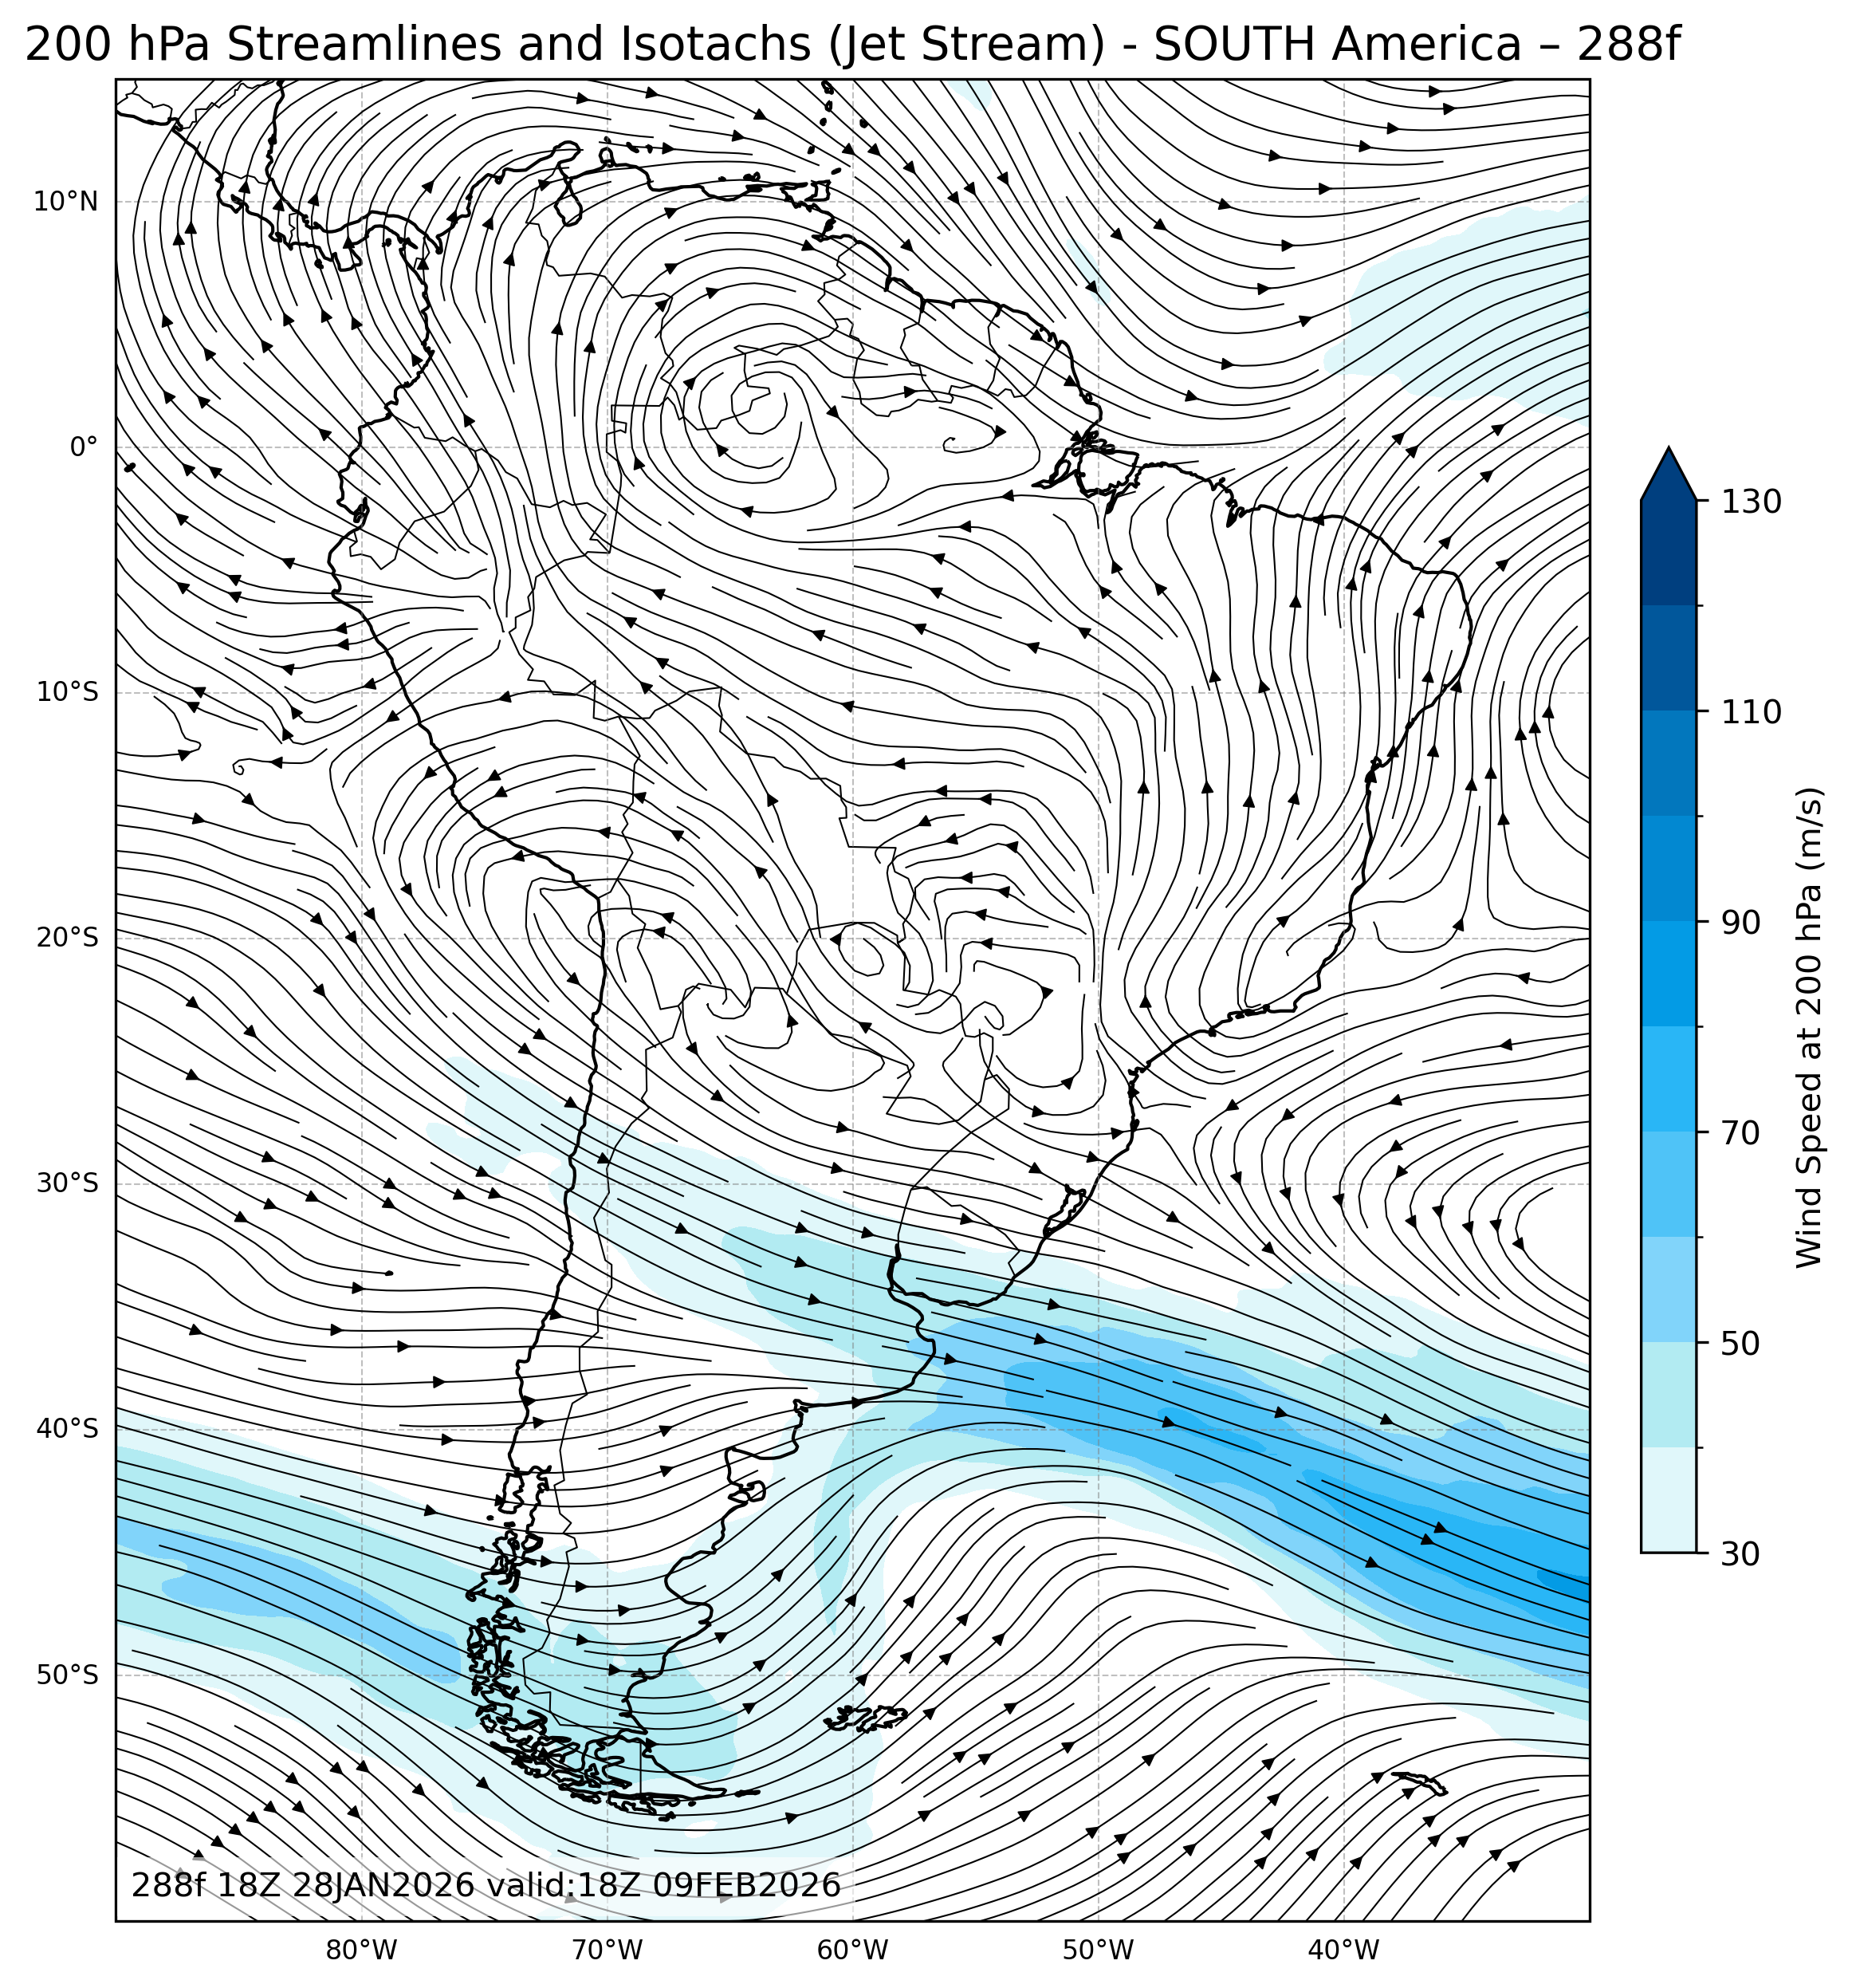
| 200mb Streamlines & Isotachs |
All Times |
🔍 | 🔍 | 🔍 | 🔍 | 🔍 |
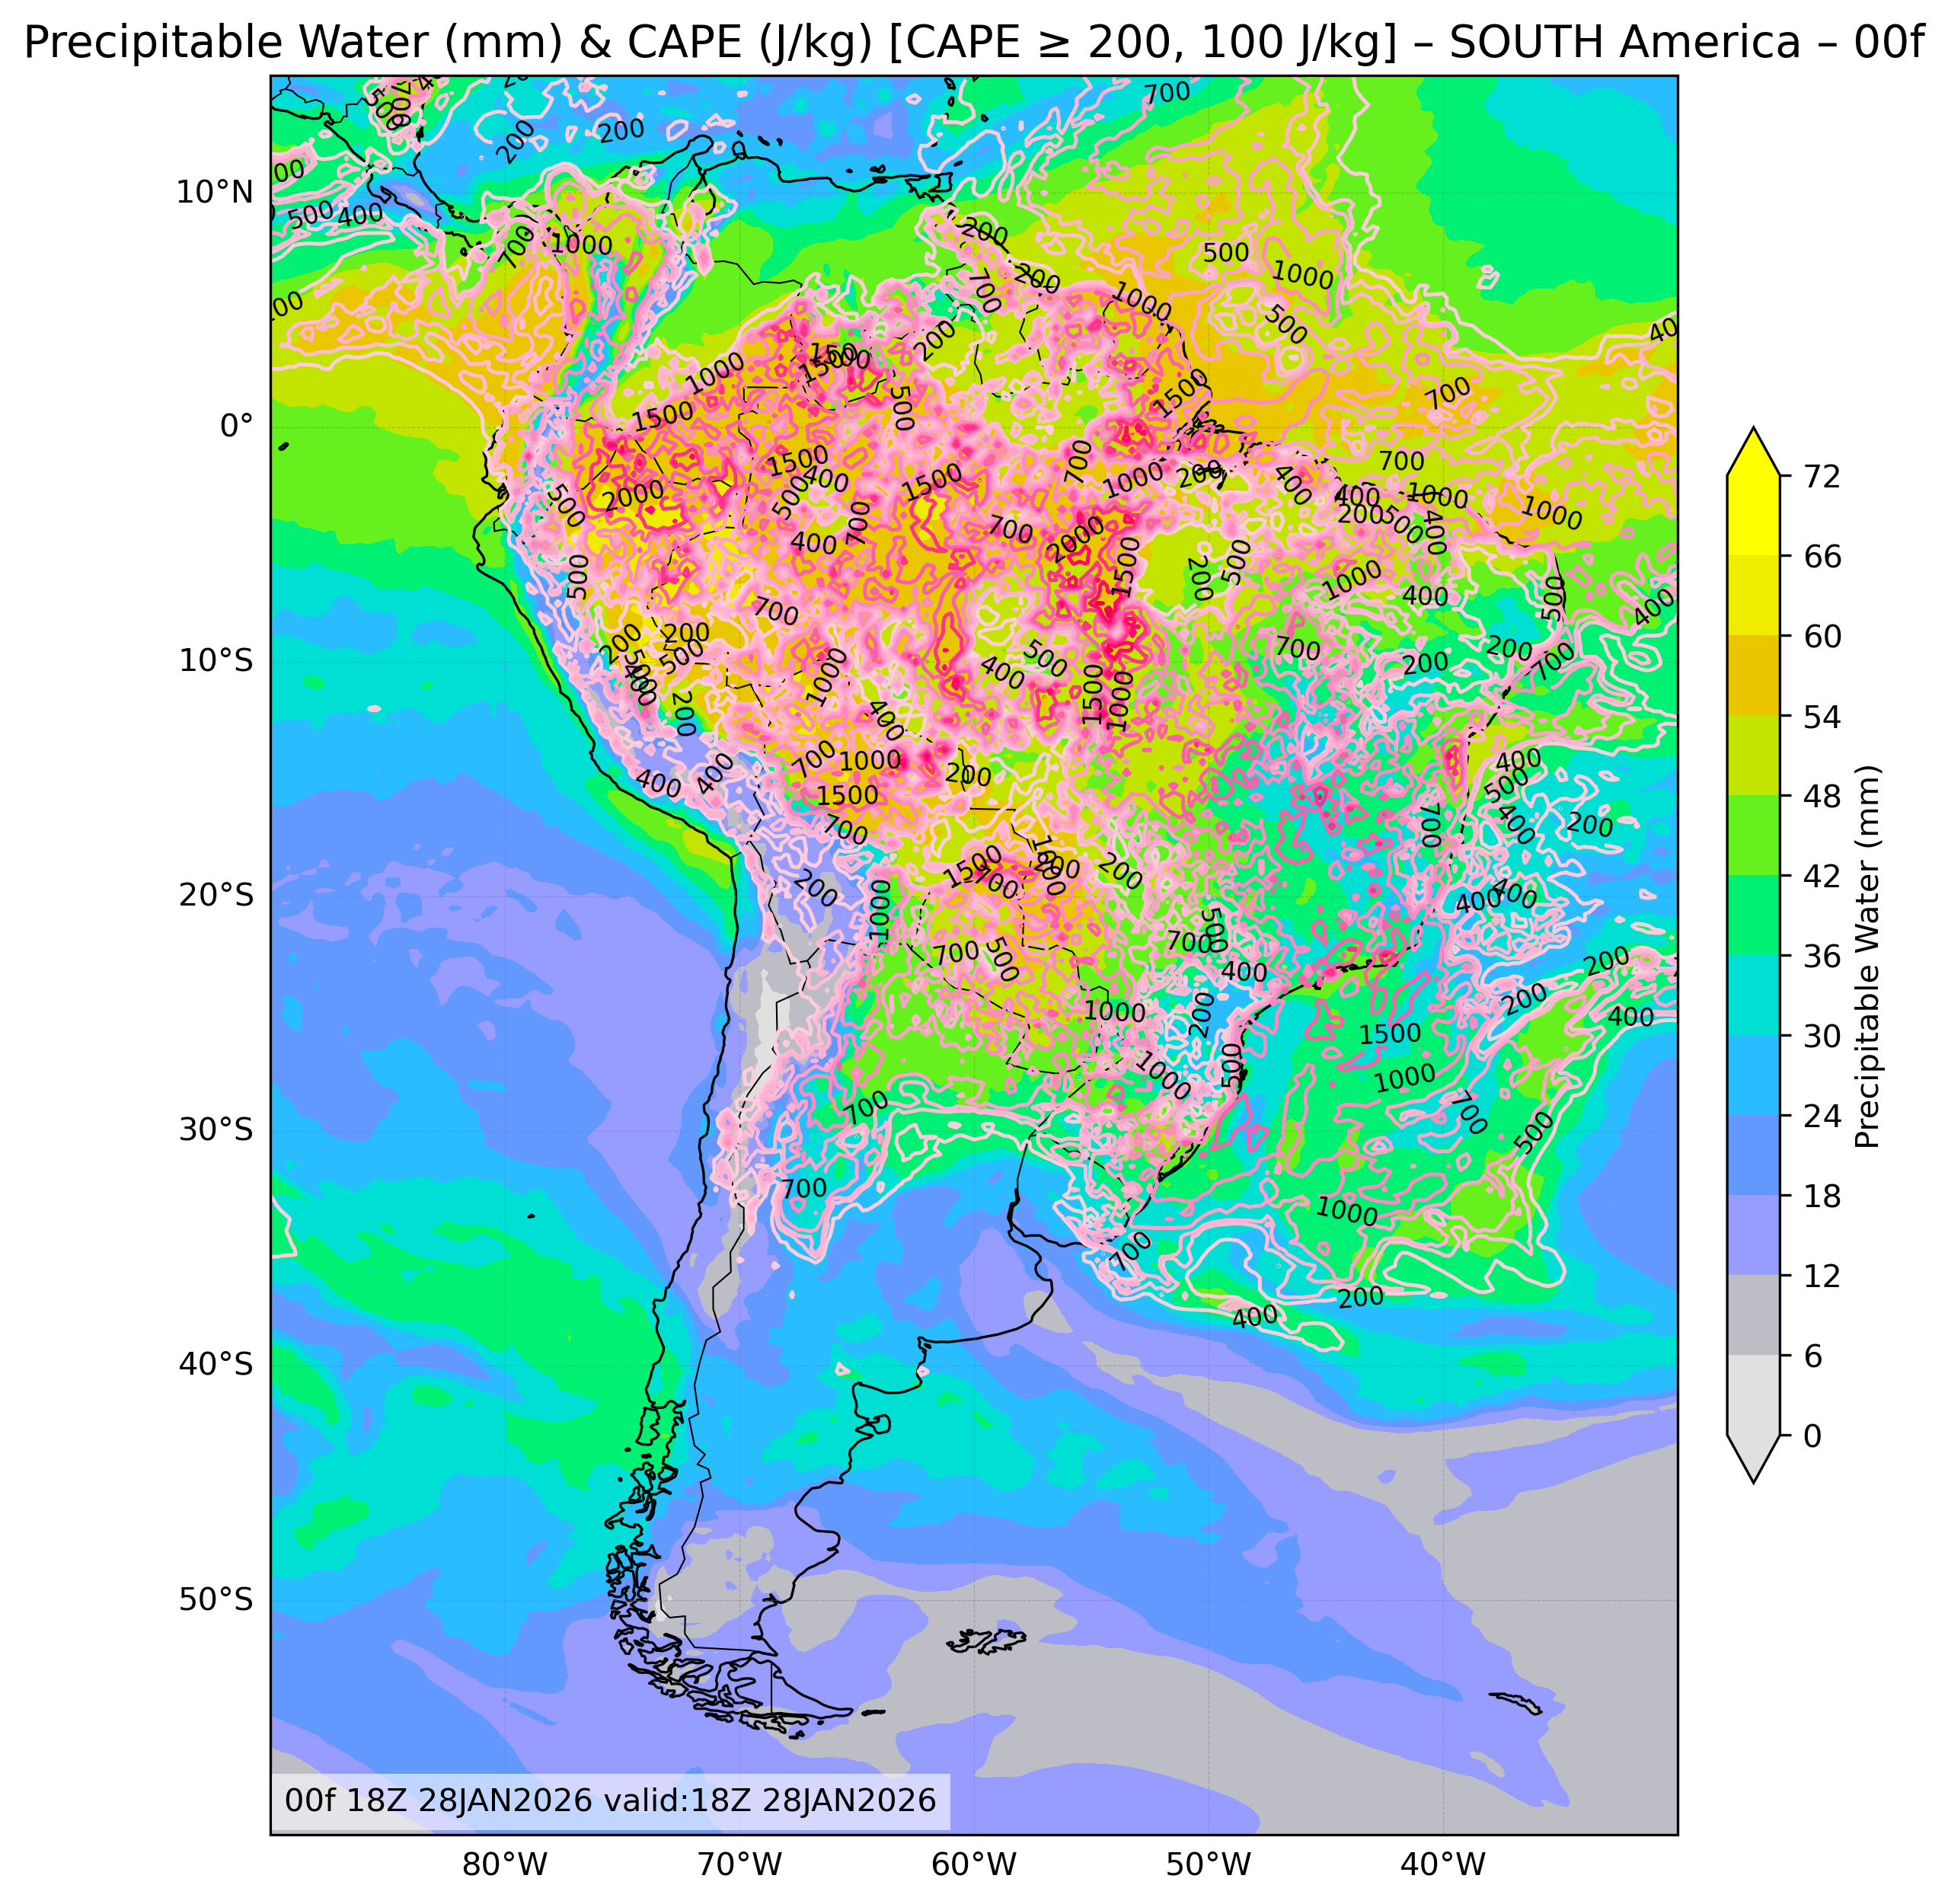
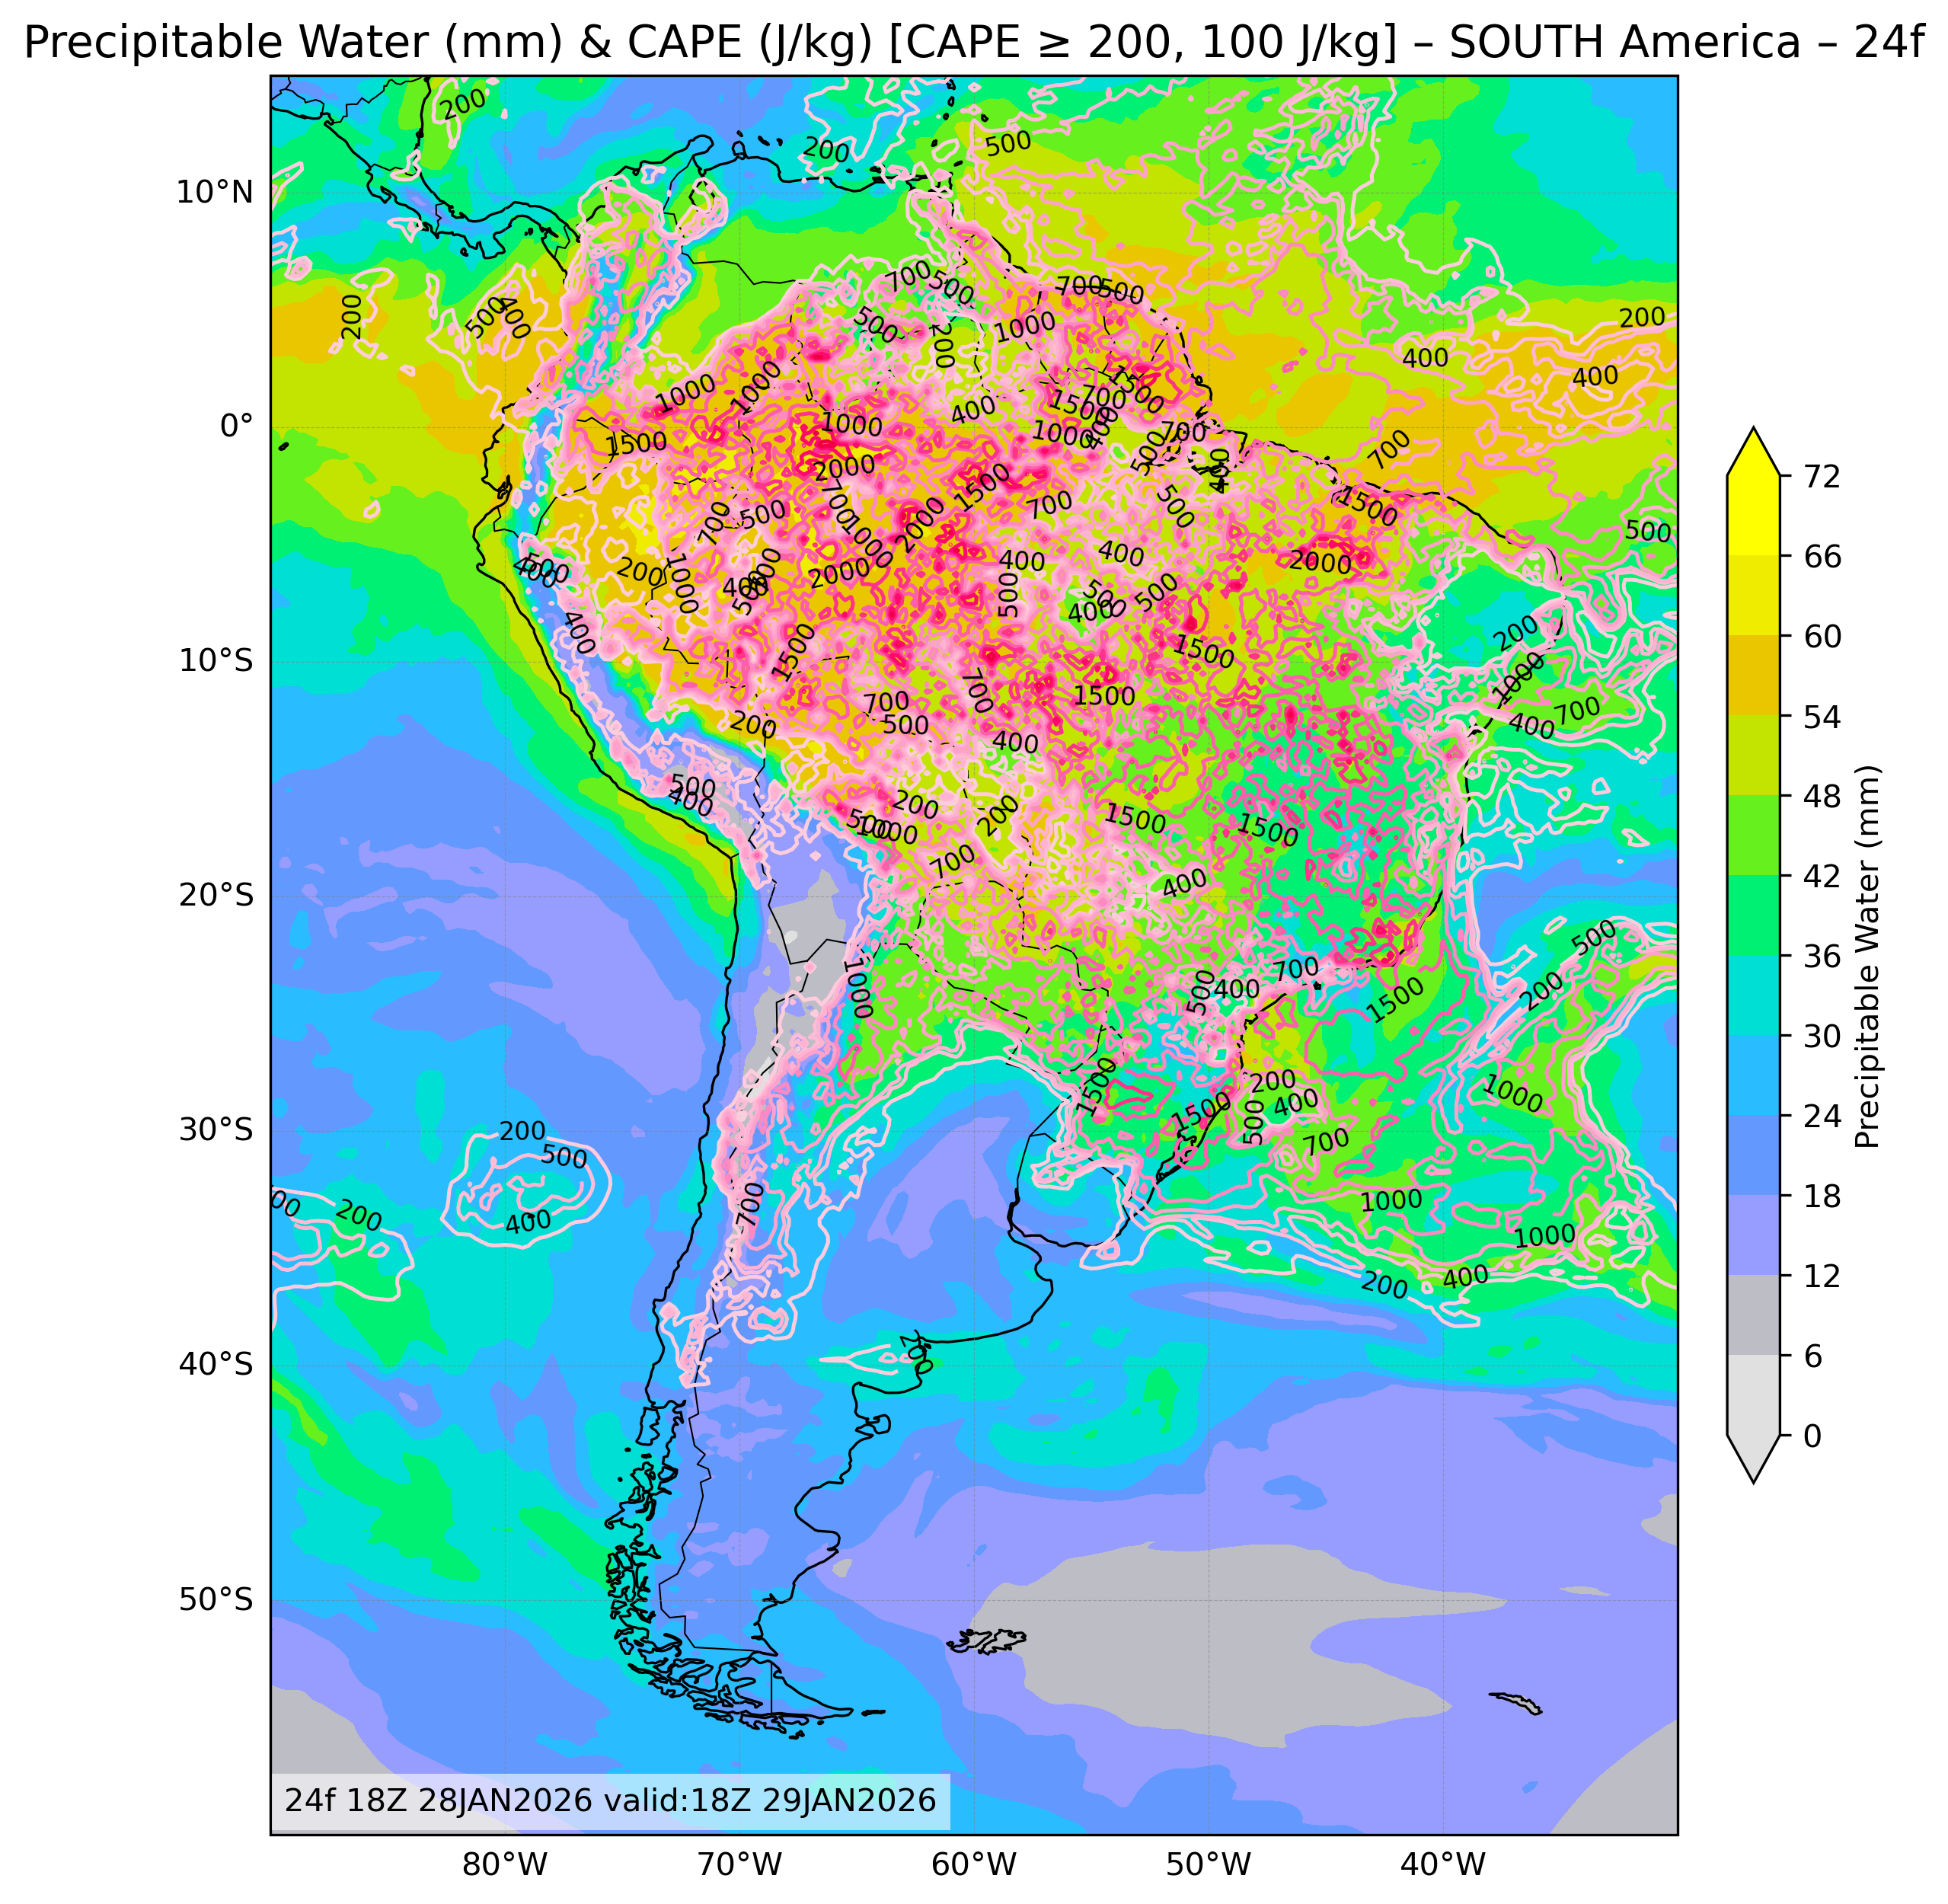
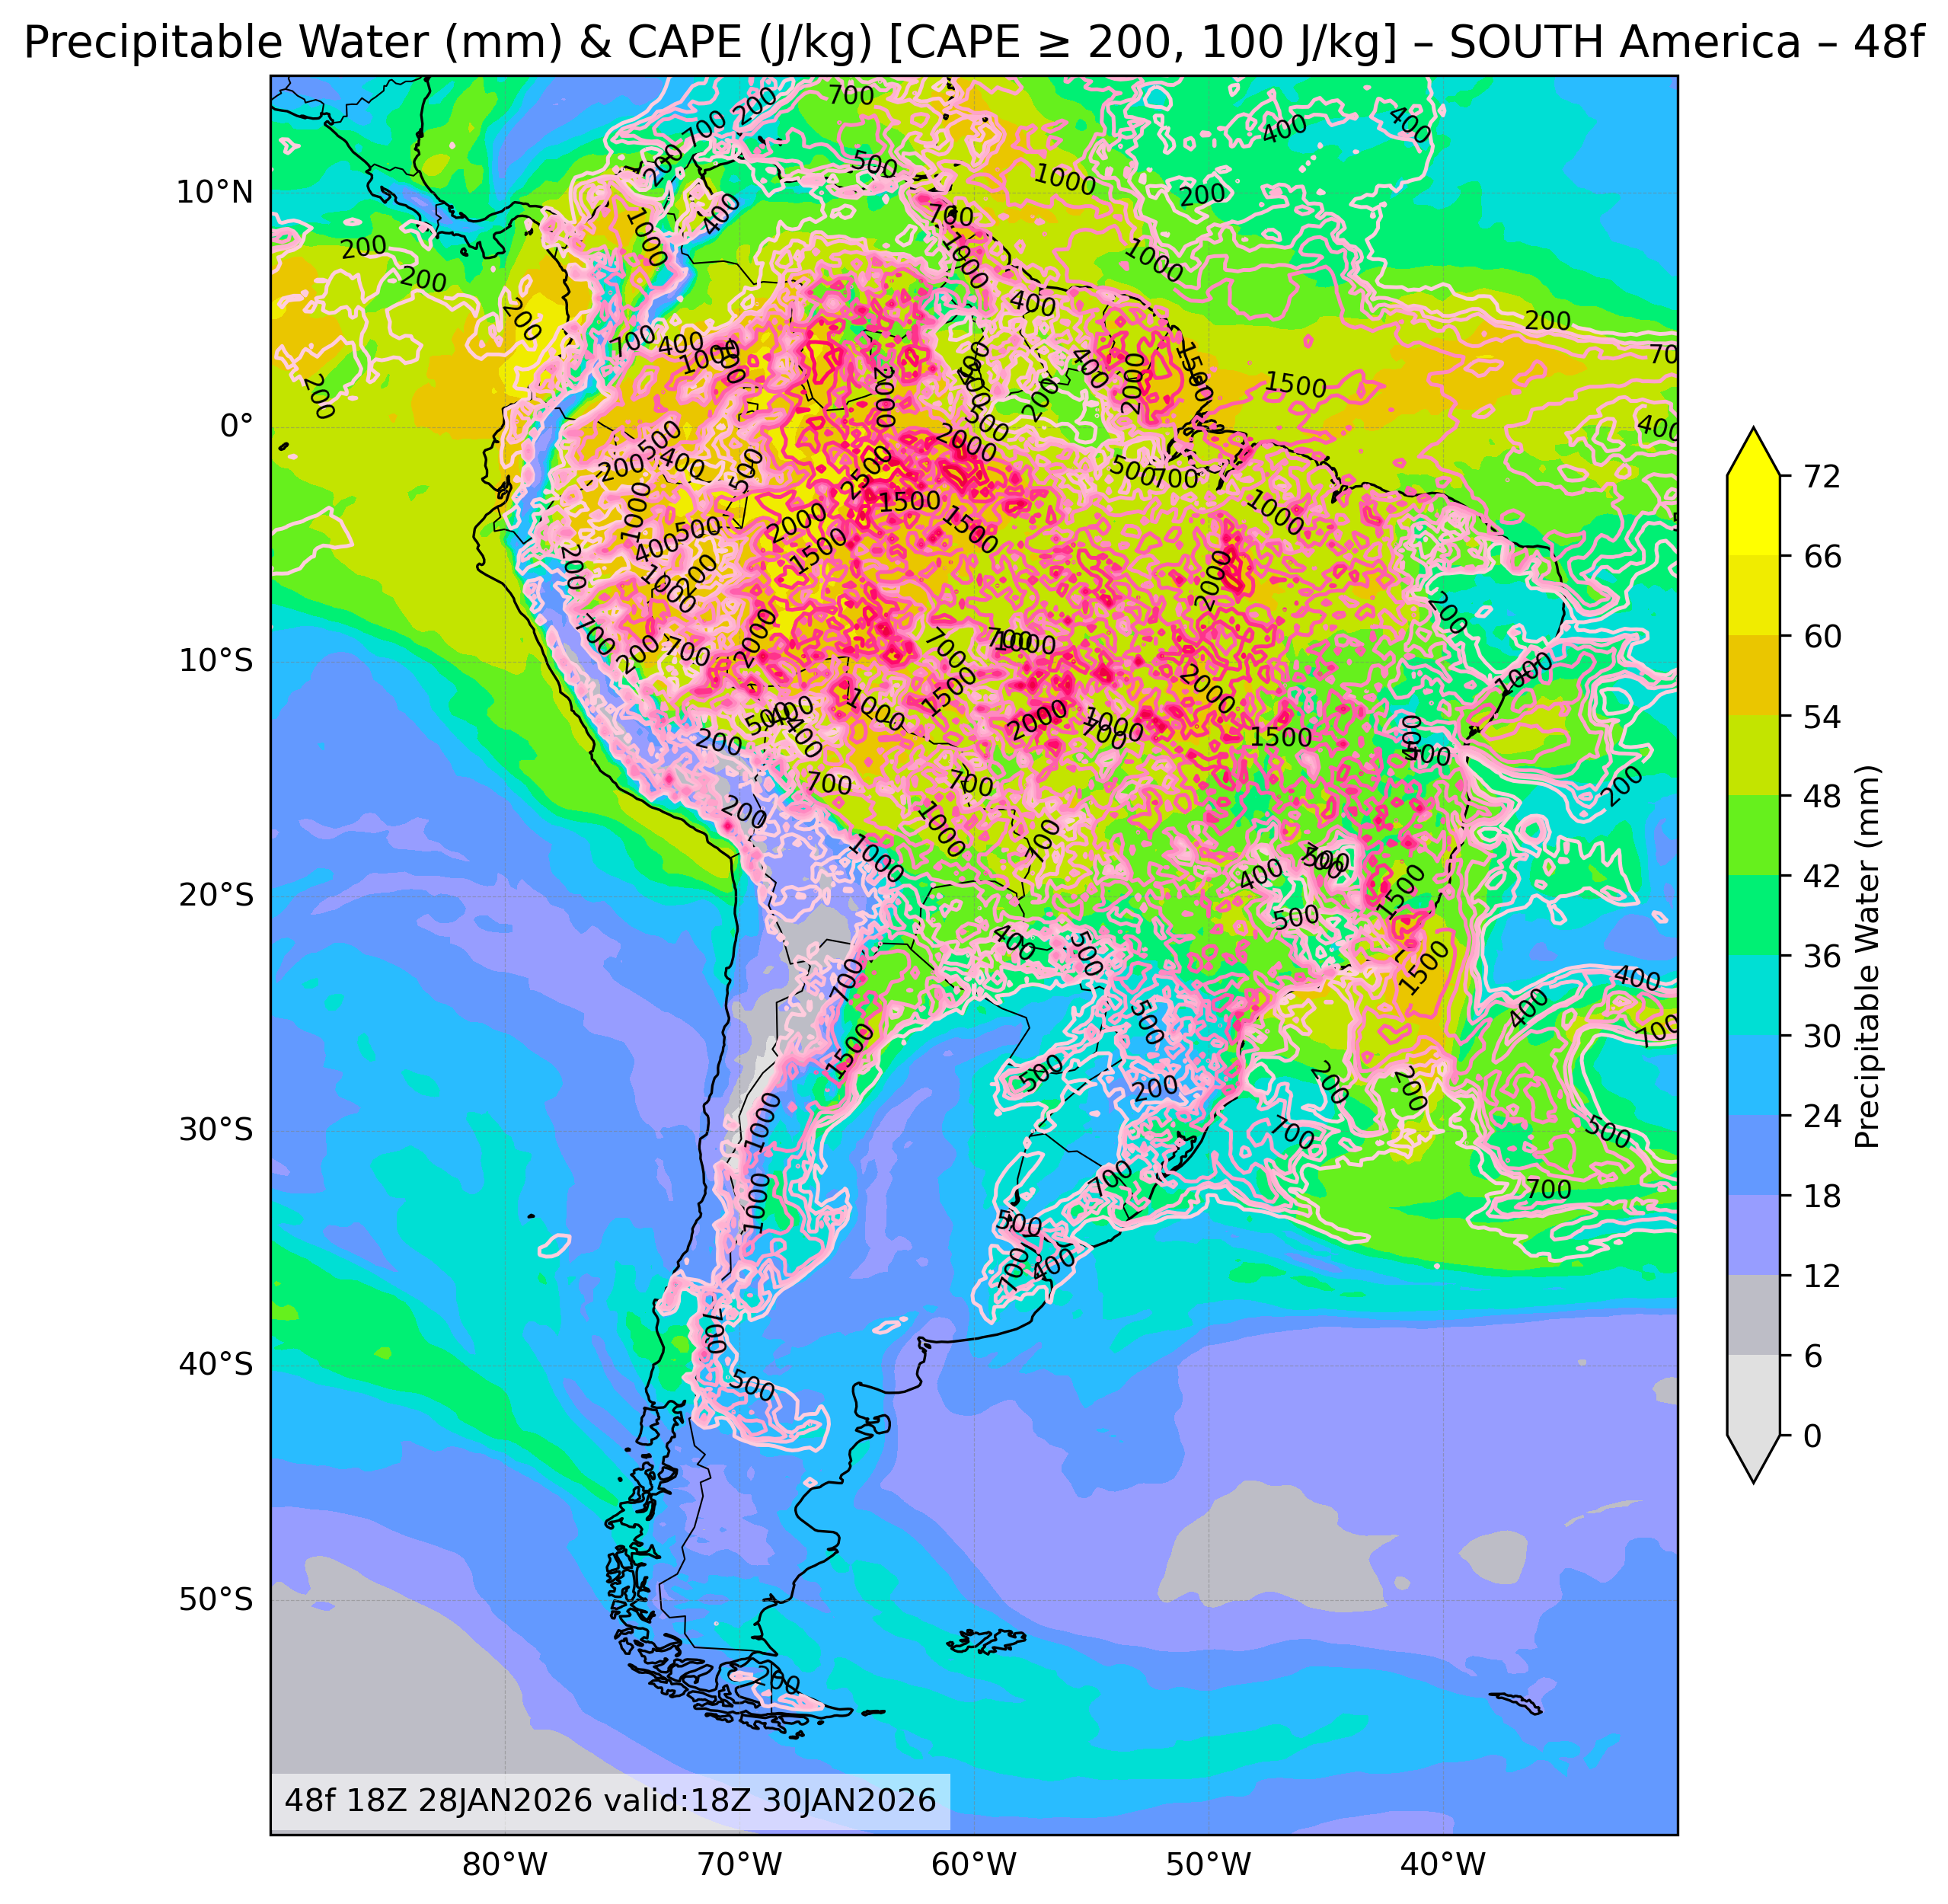
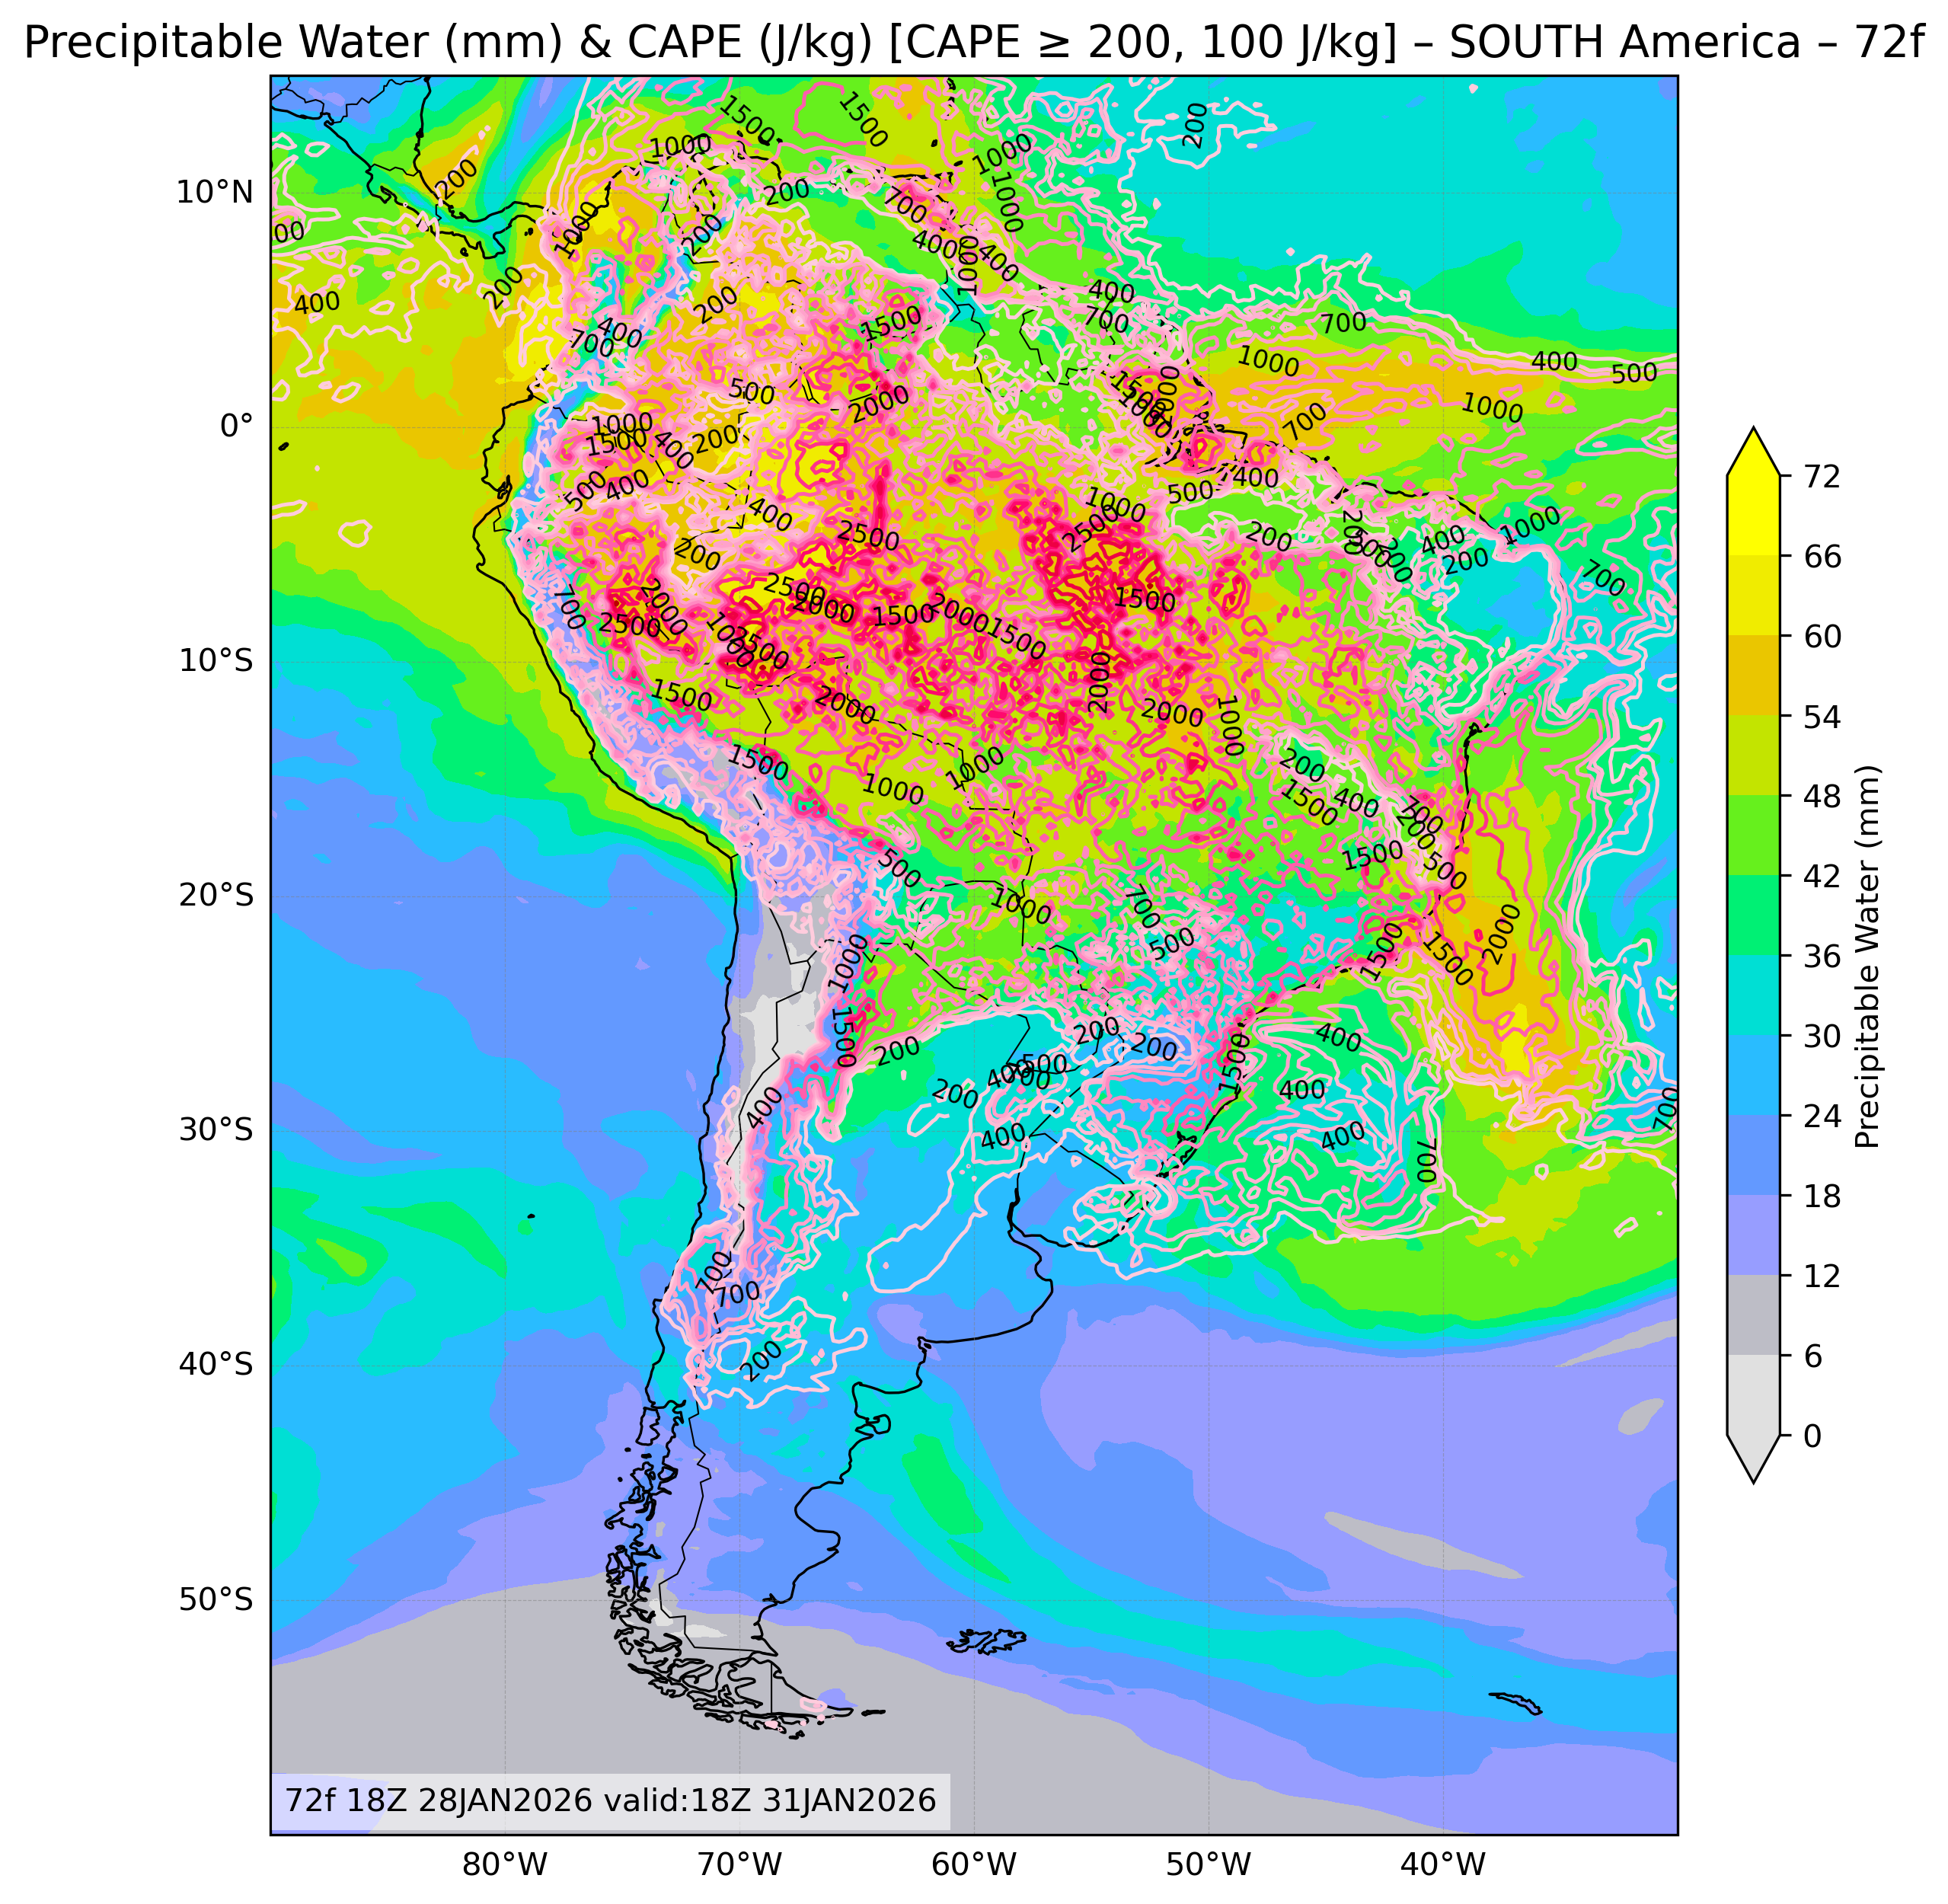
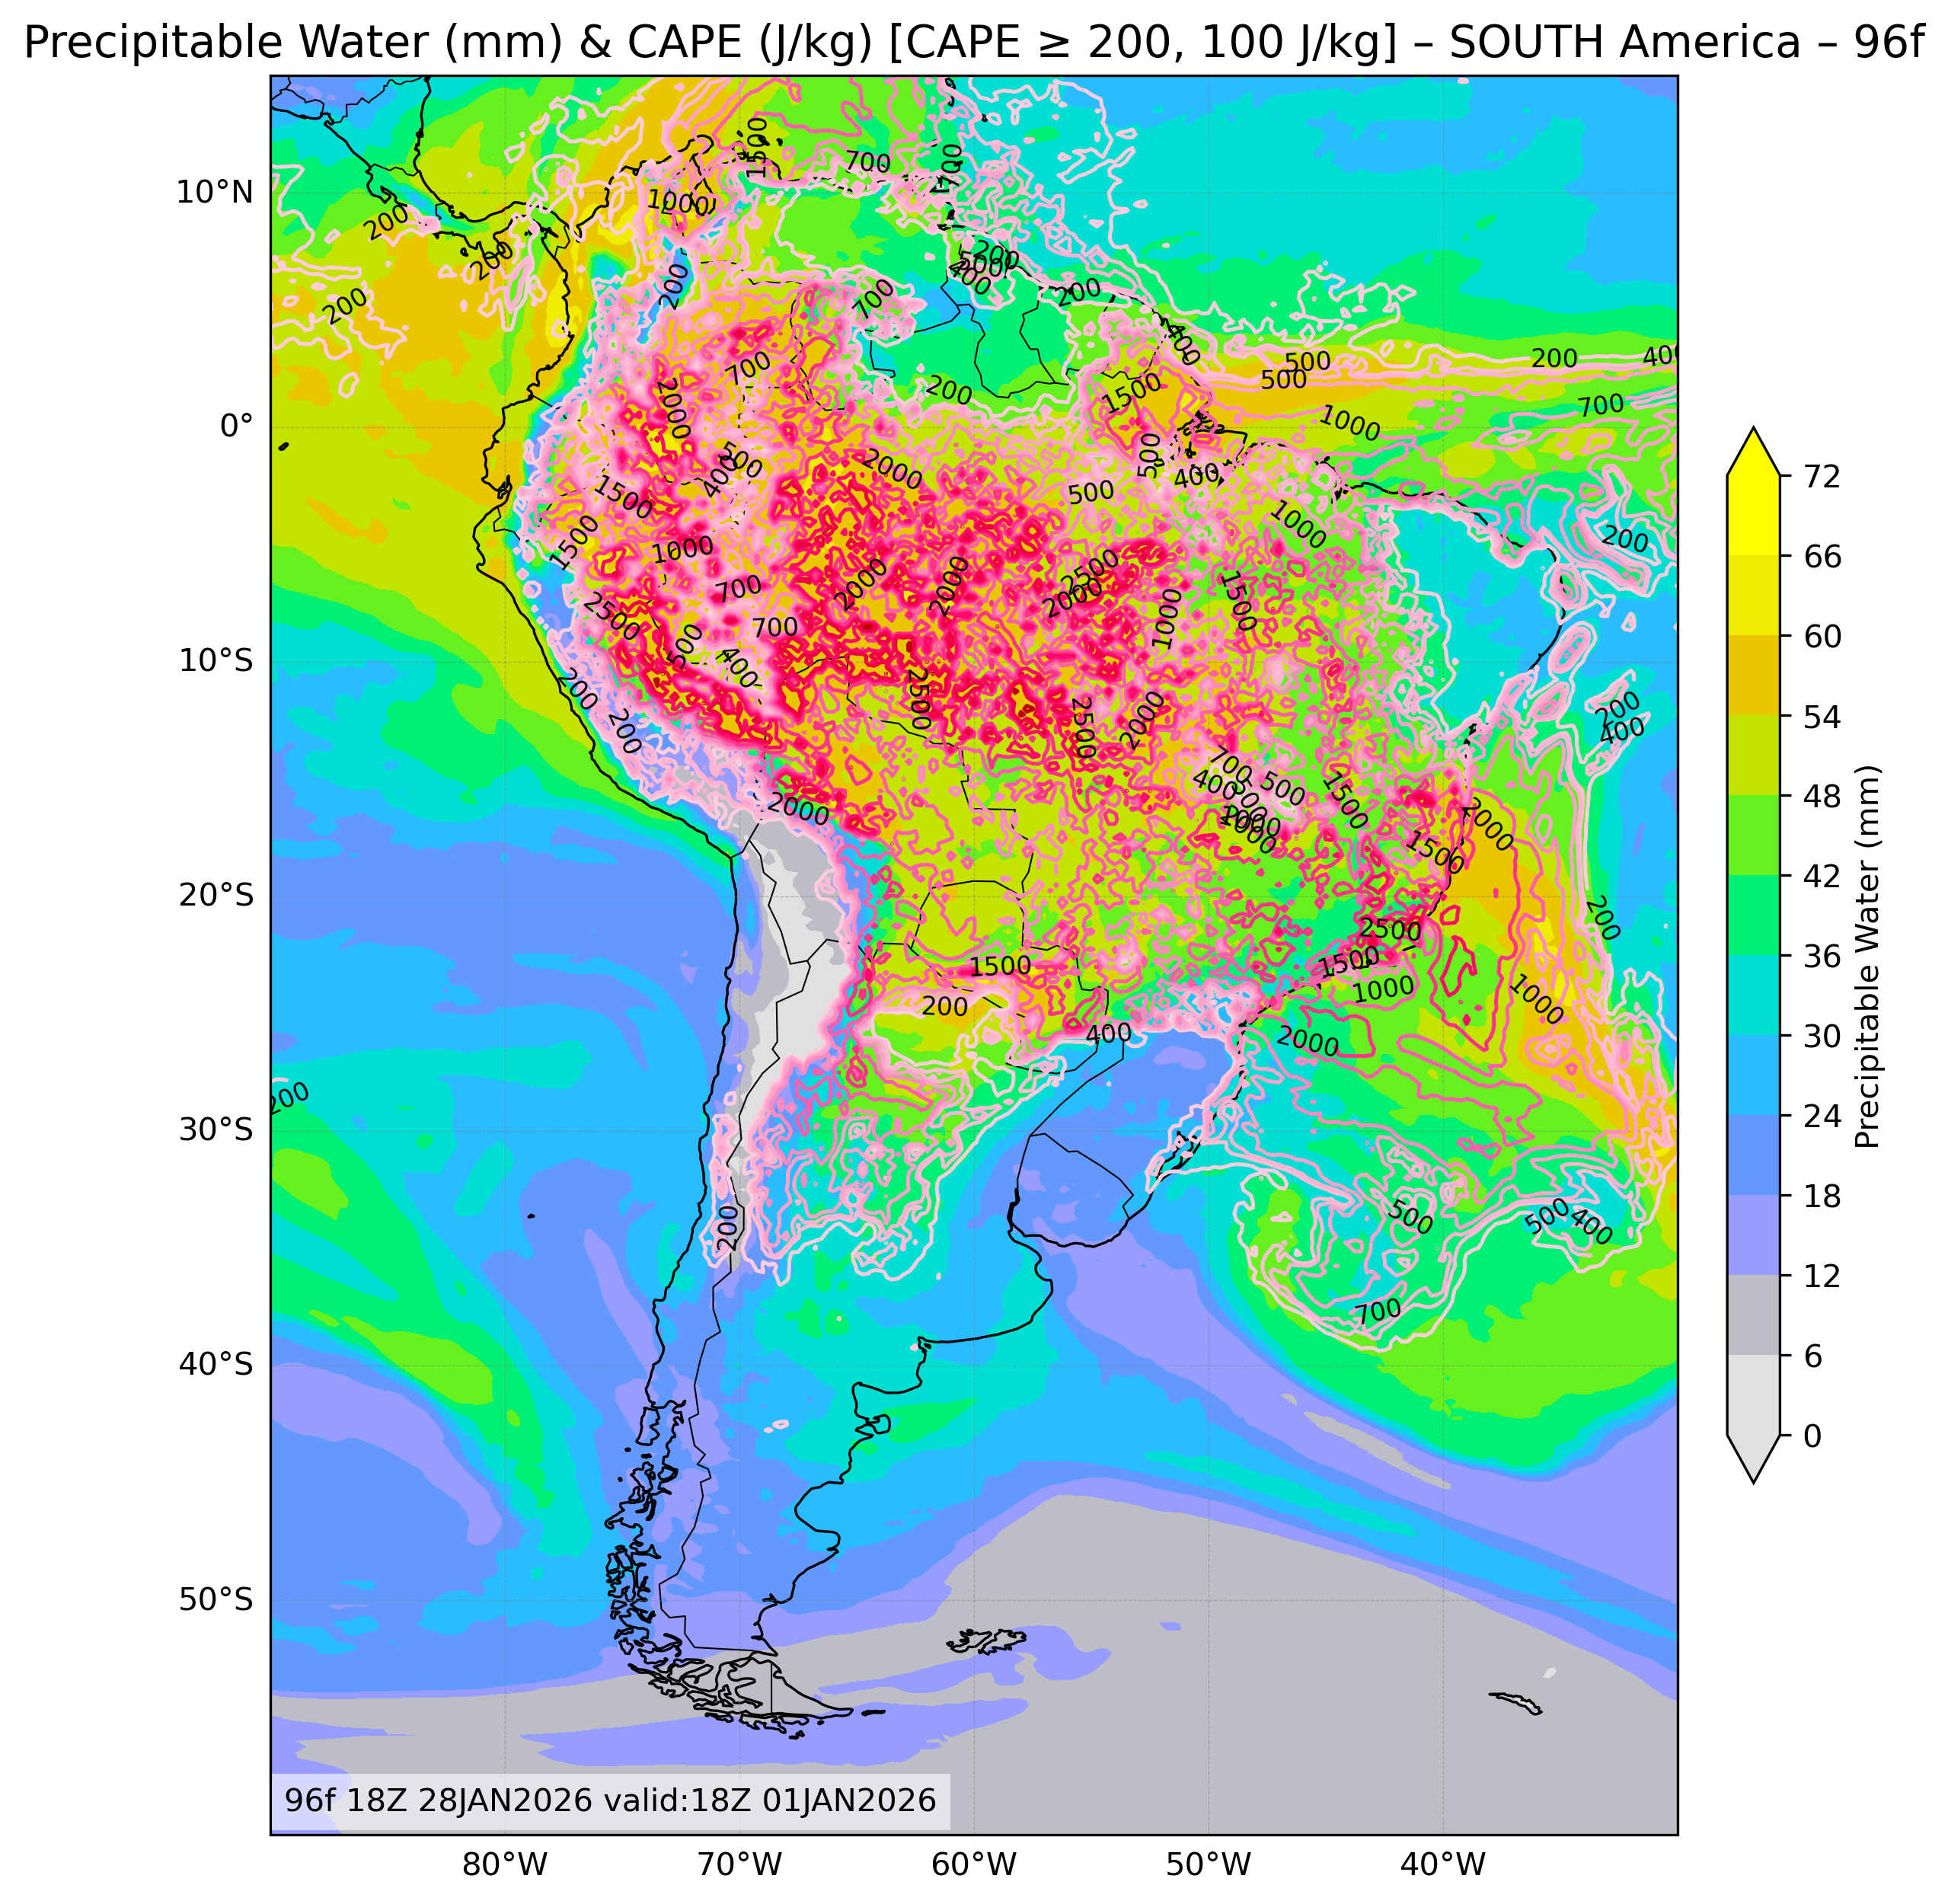
| Precipitable Water & Convective Available Potential Energy |
All Times |
🔍 | 🔍 | 🔍 | 🔍 | 🔍 |
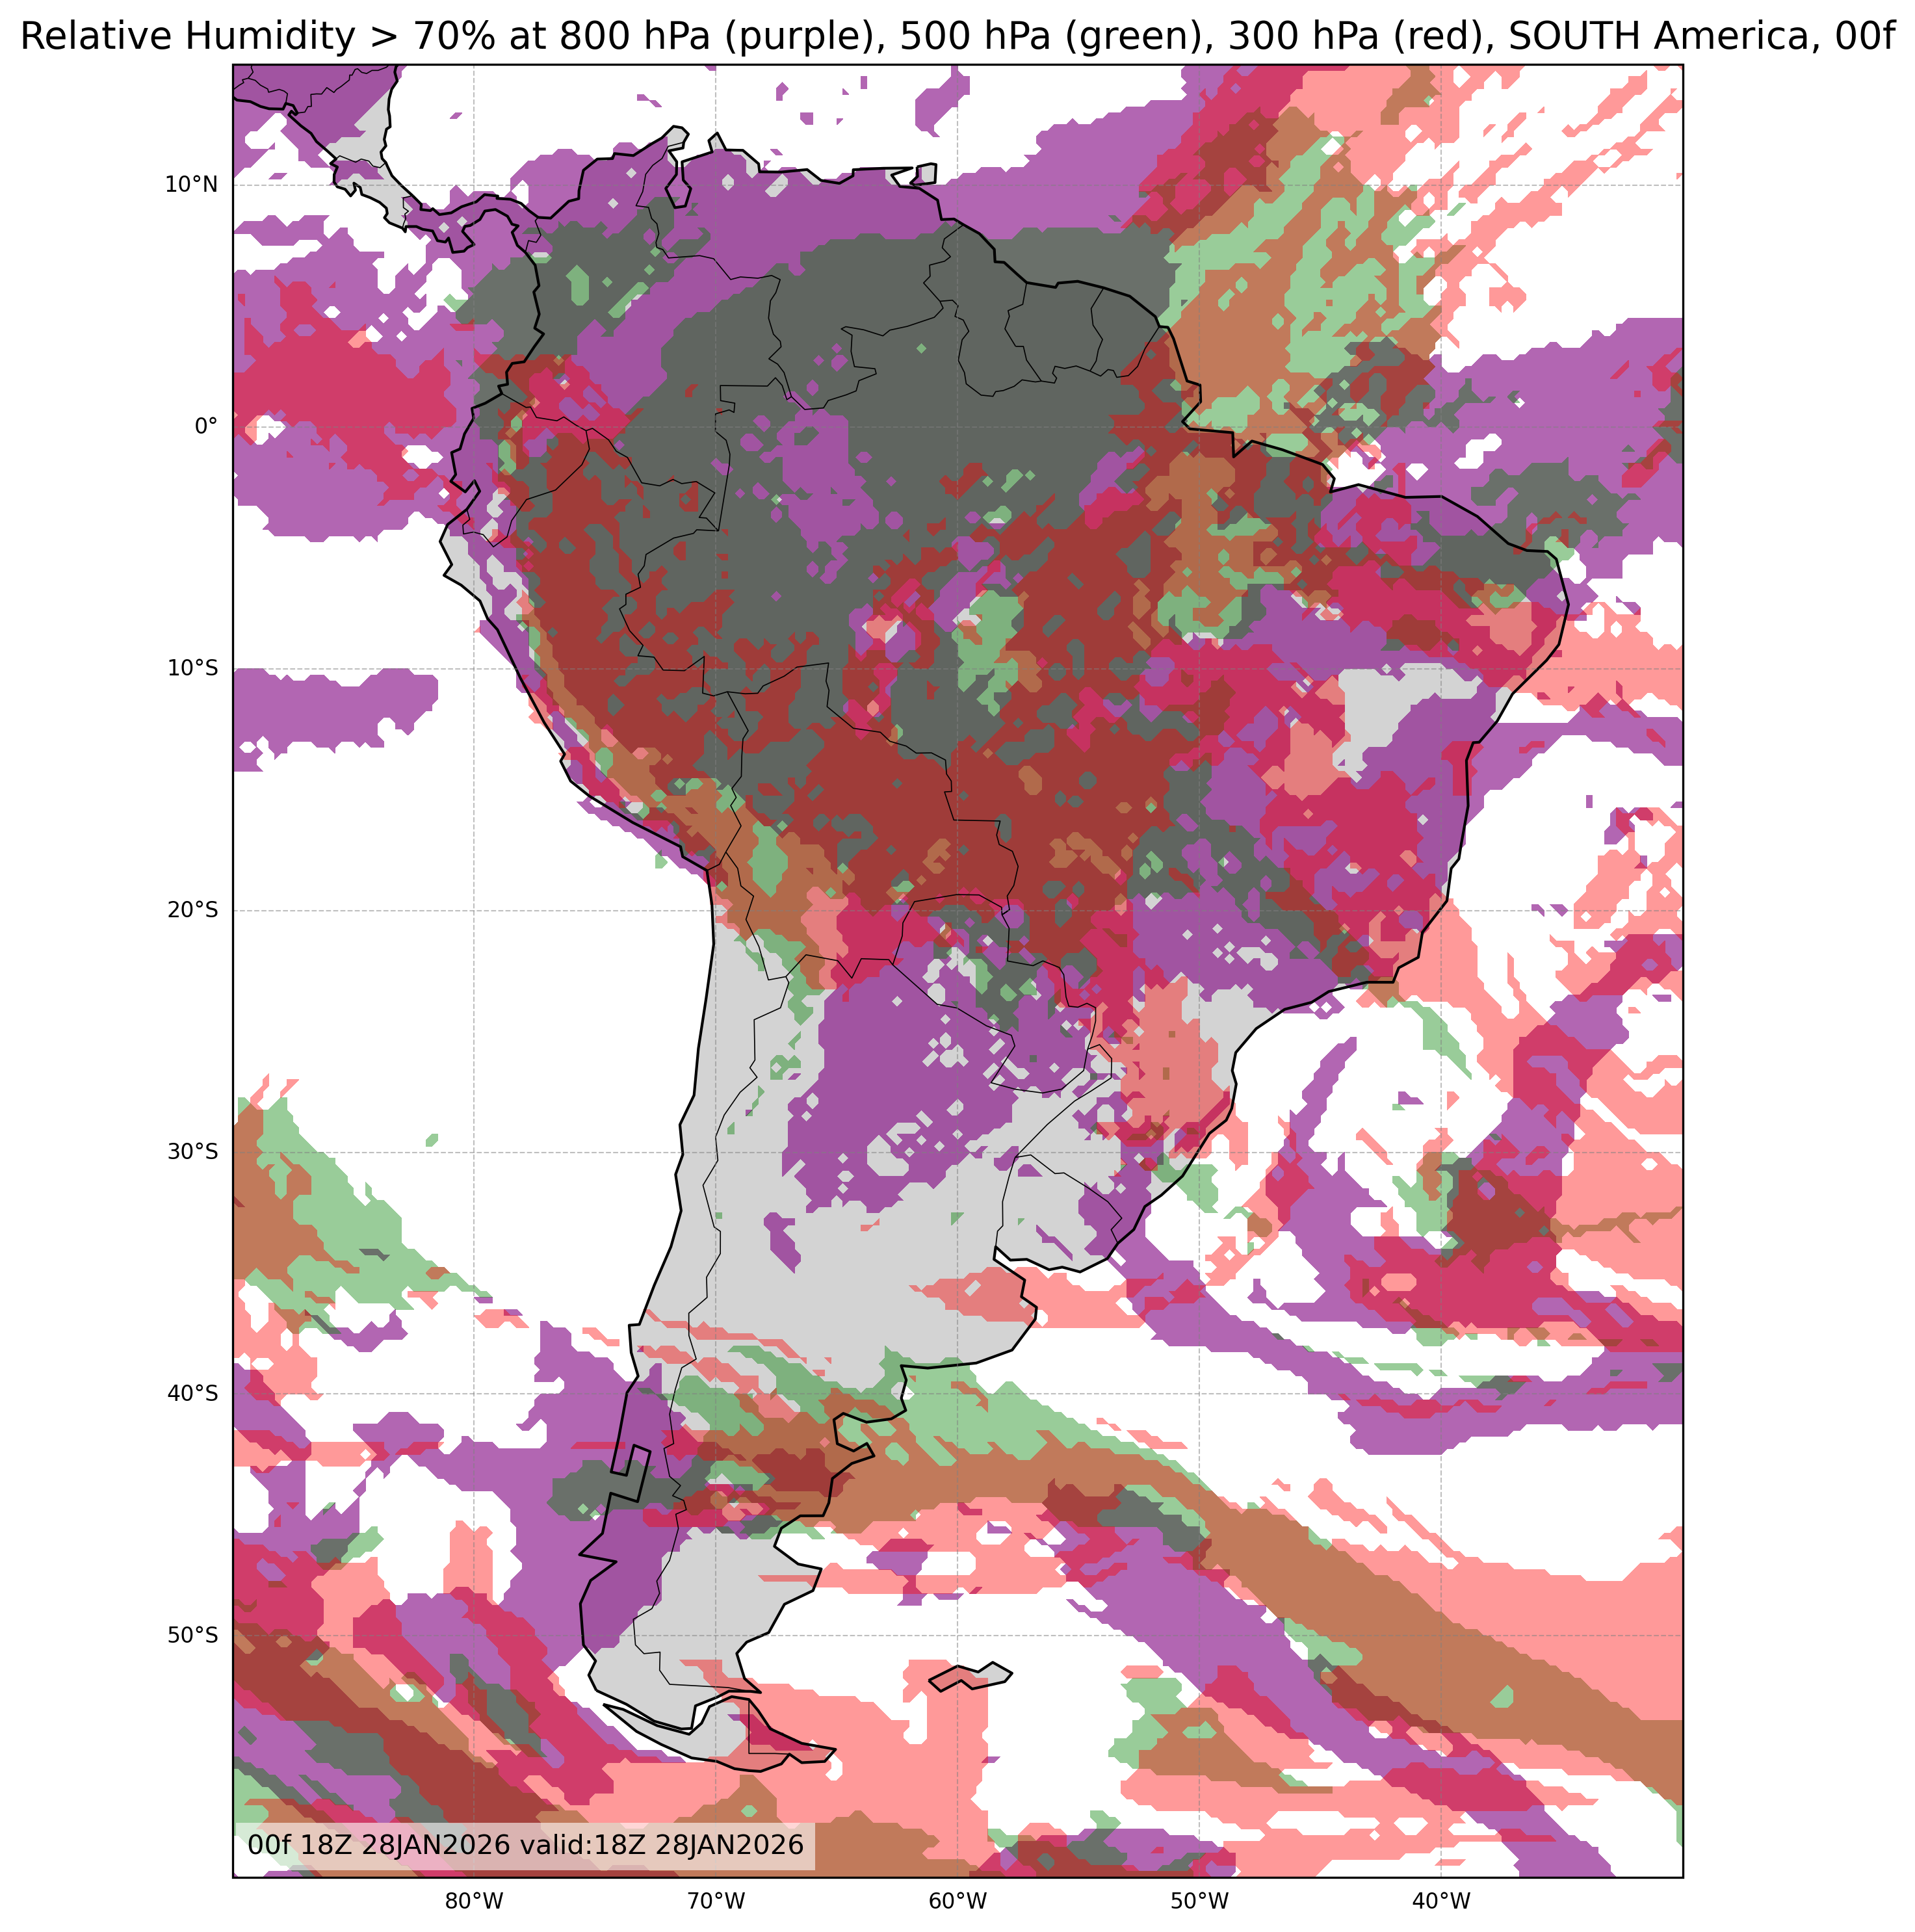
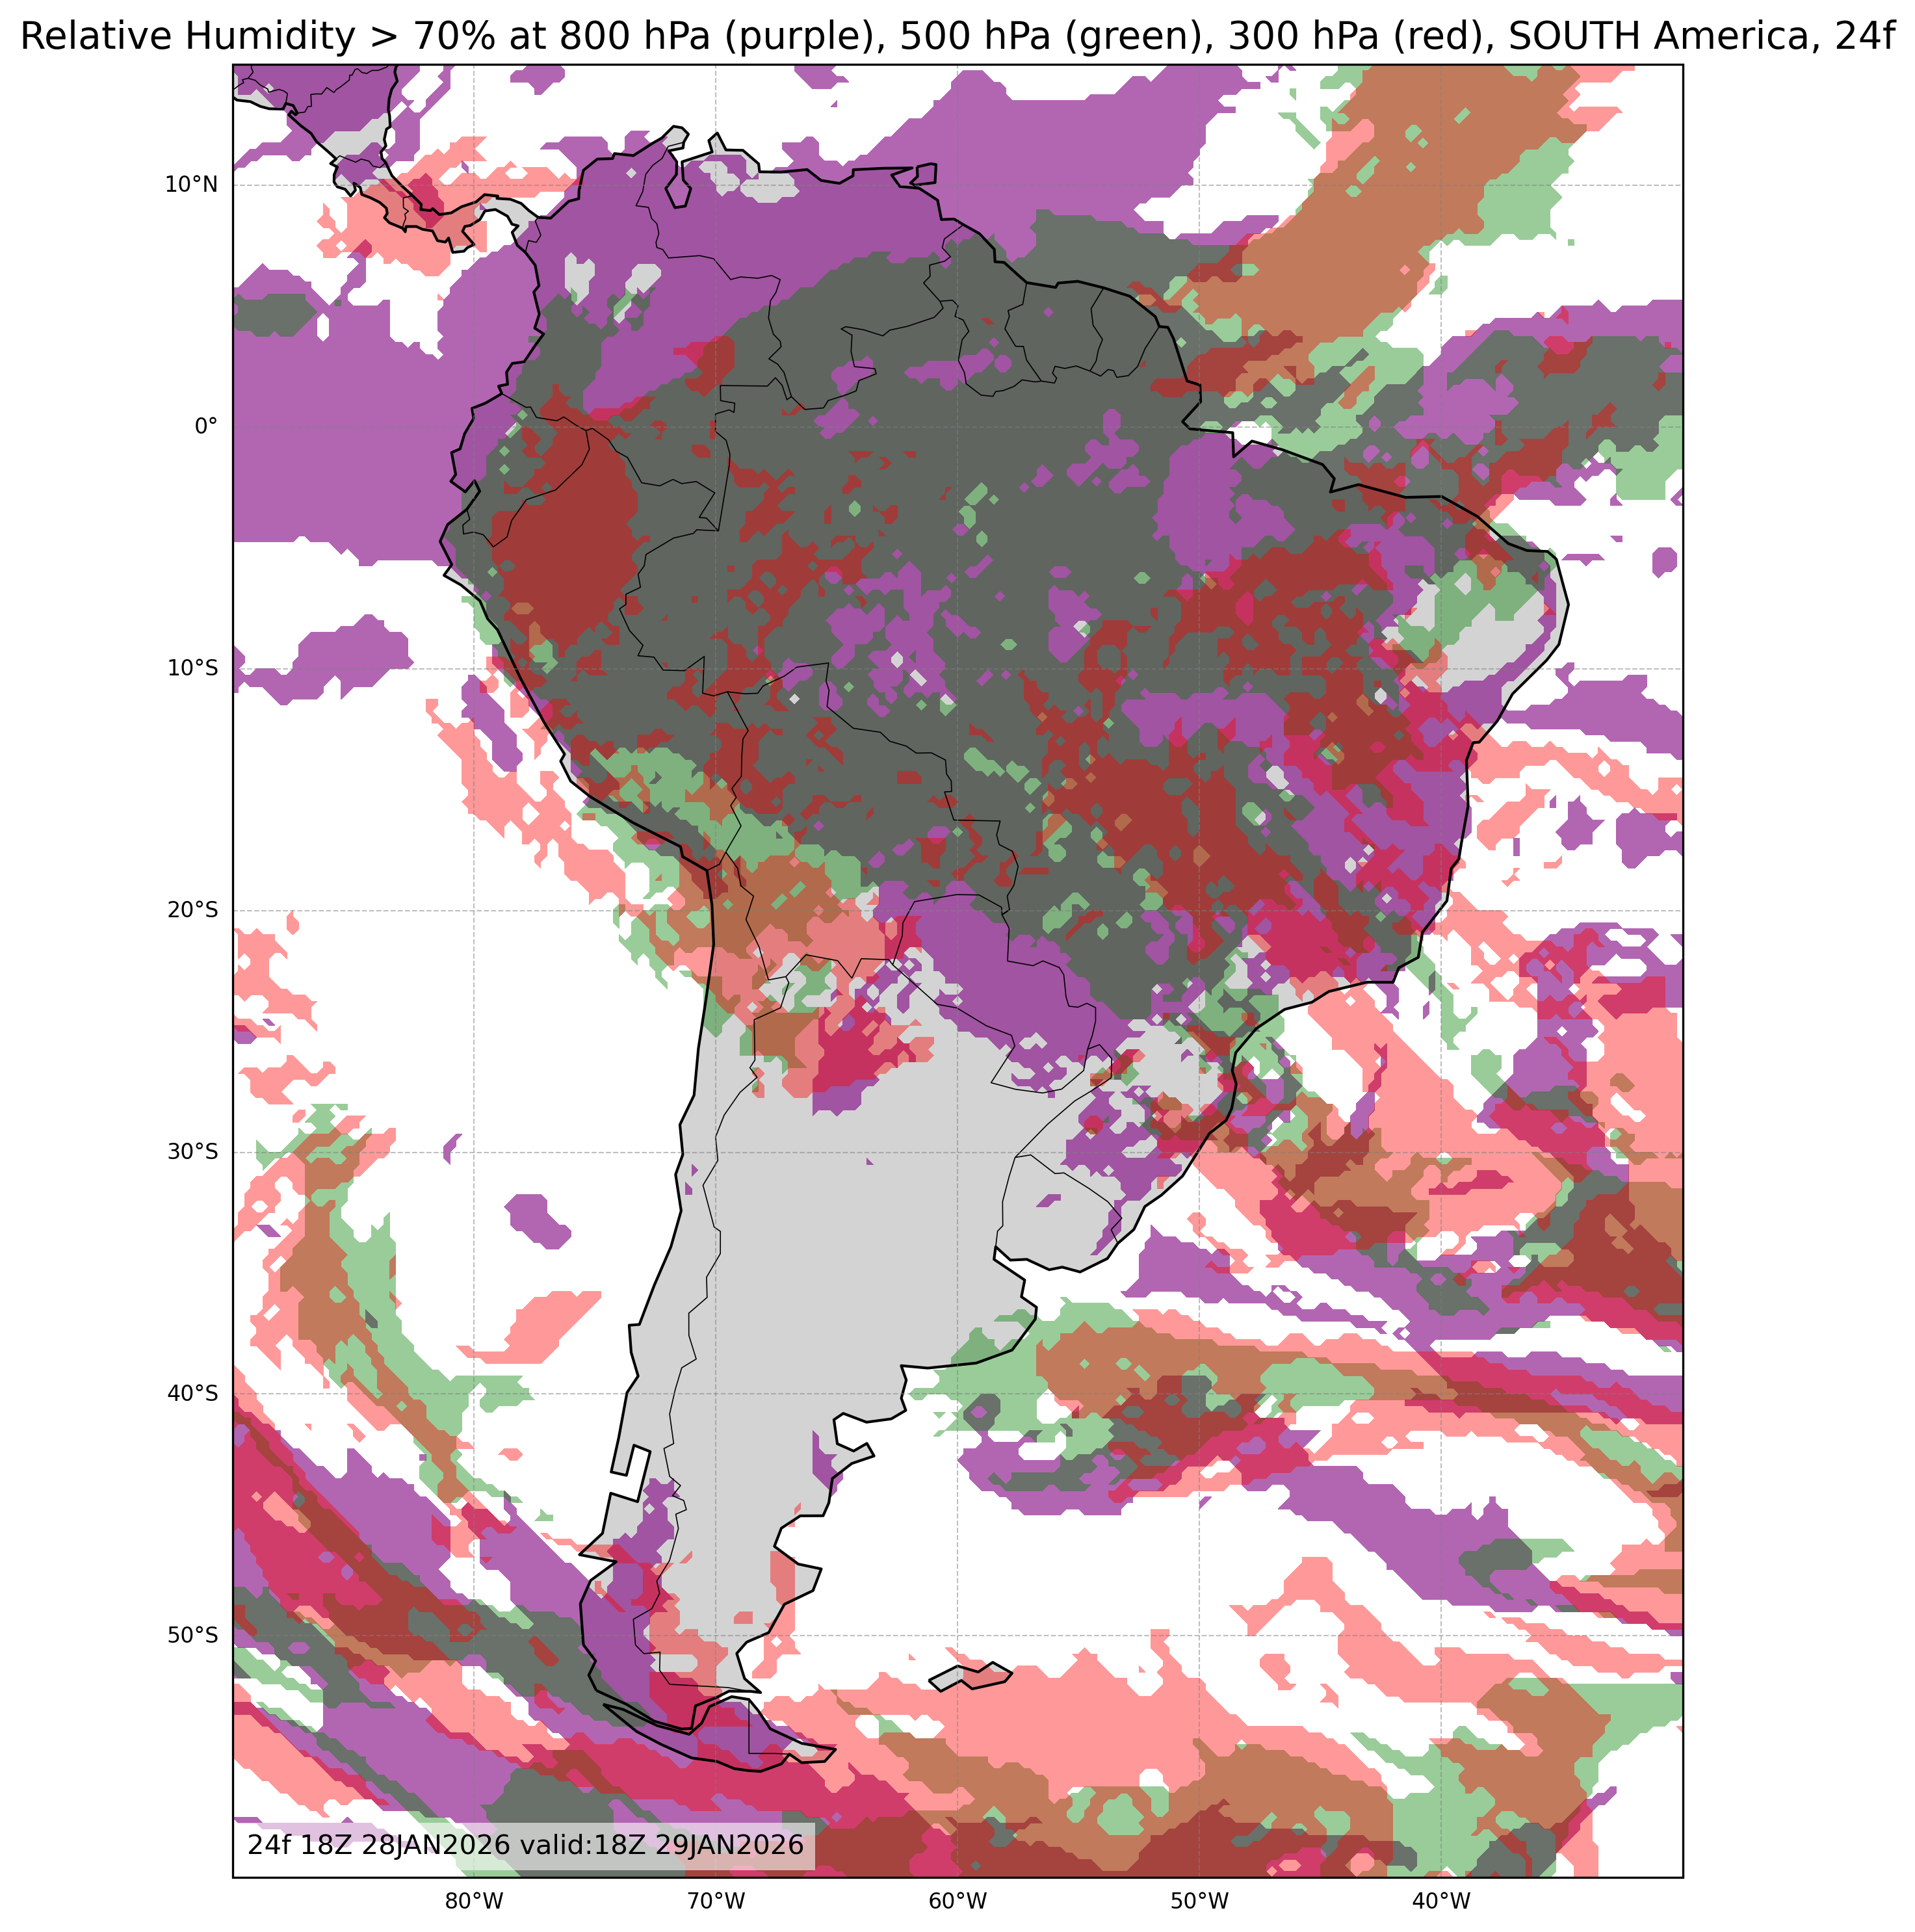
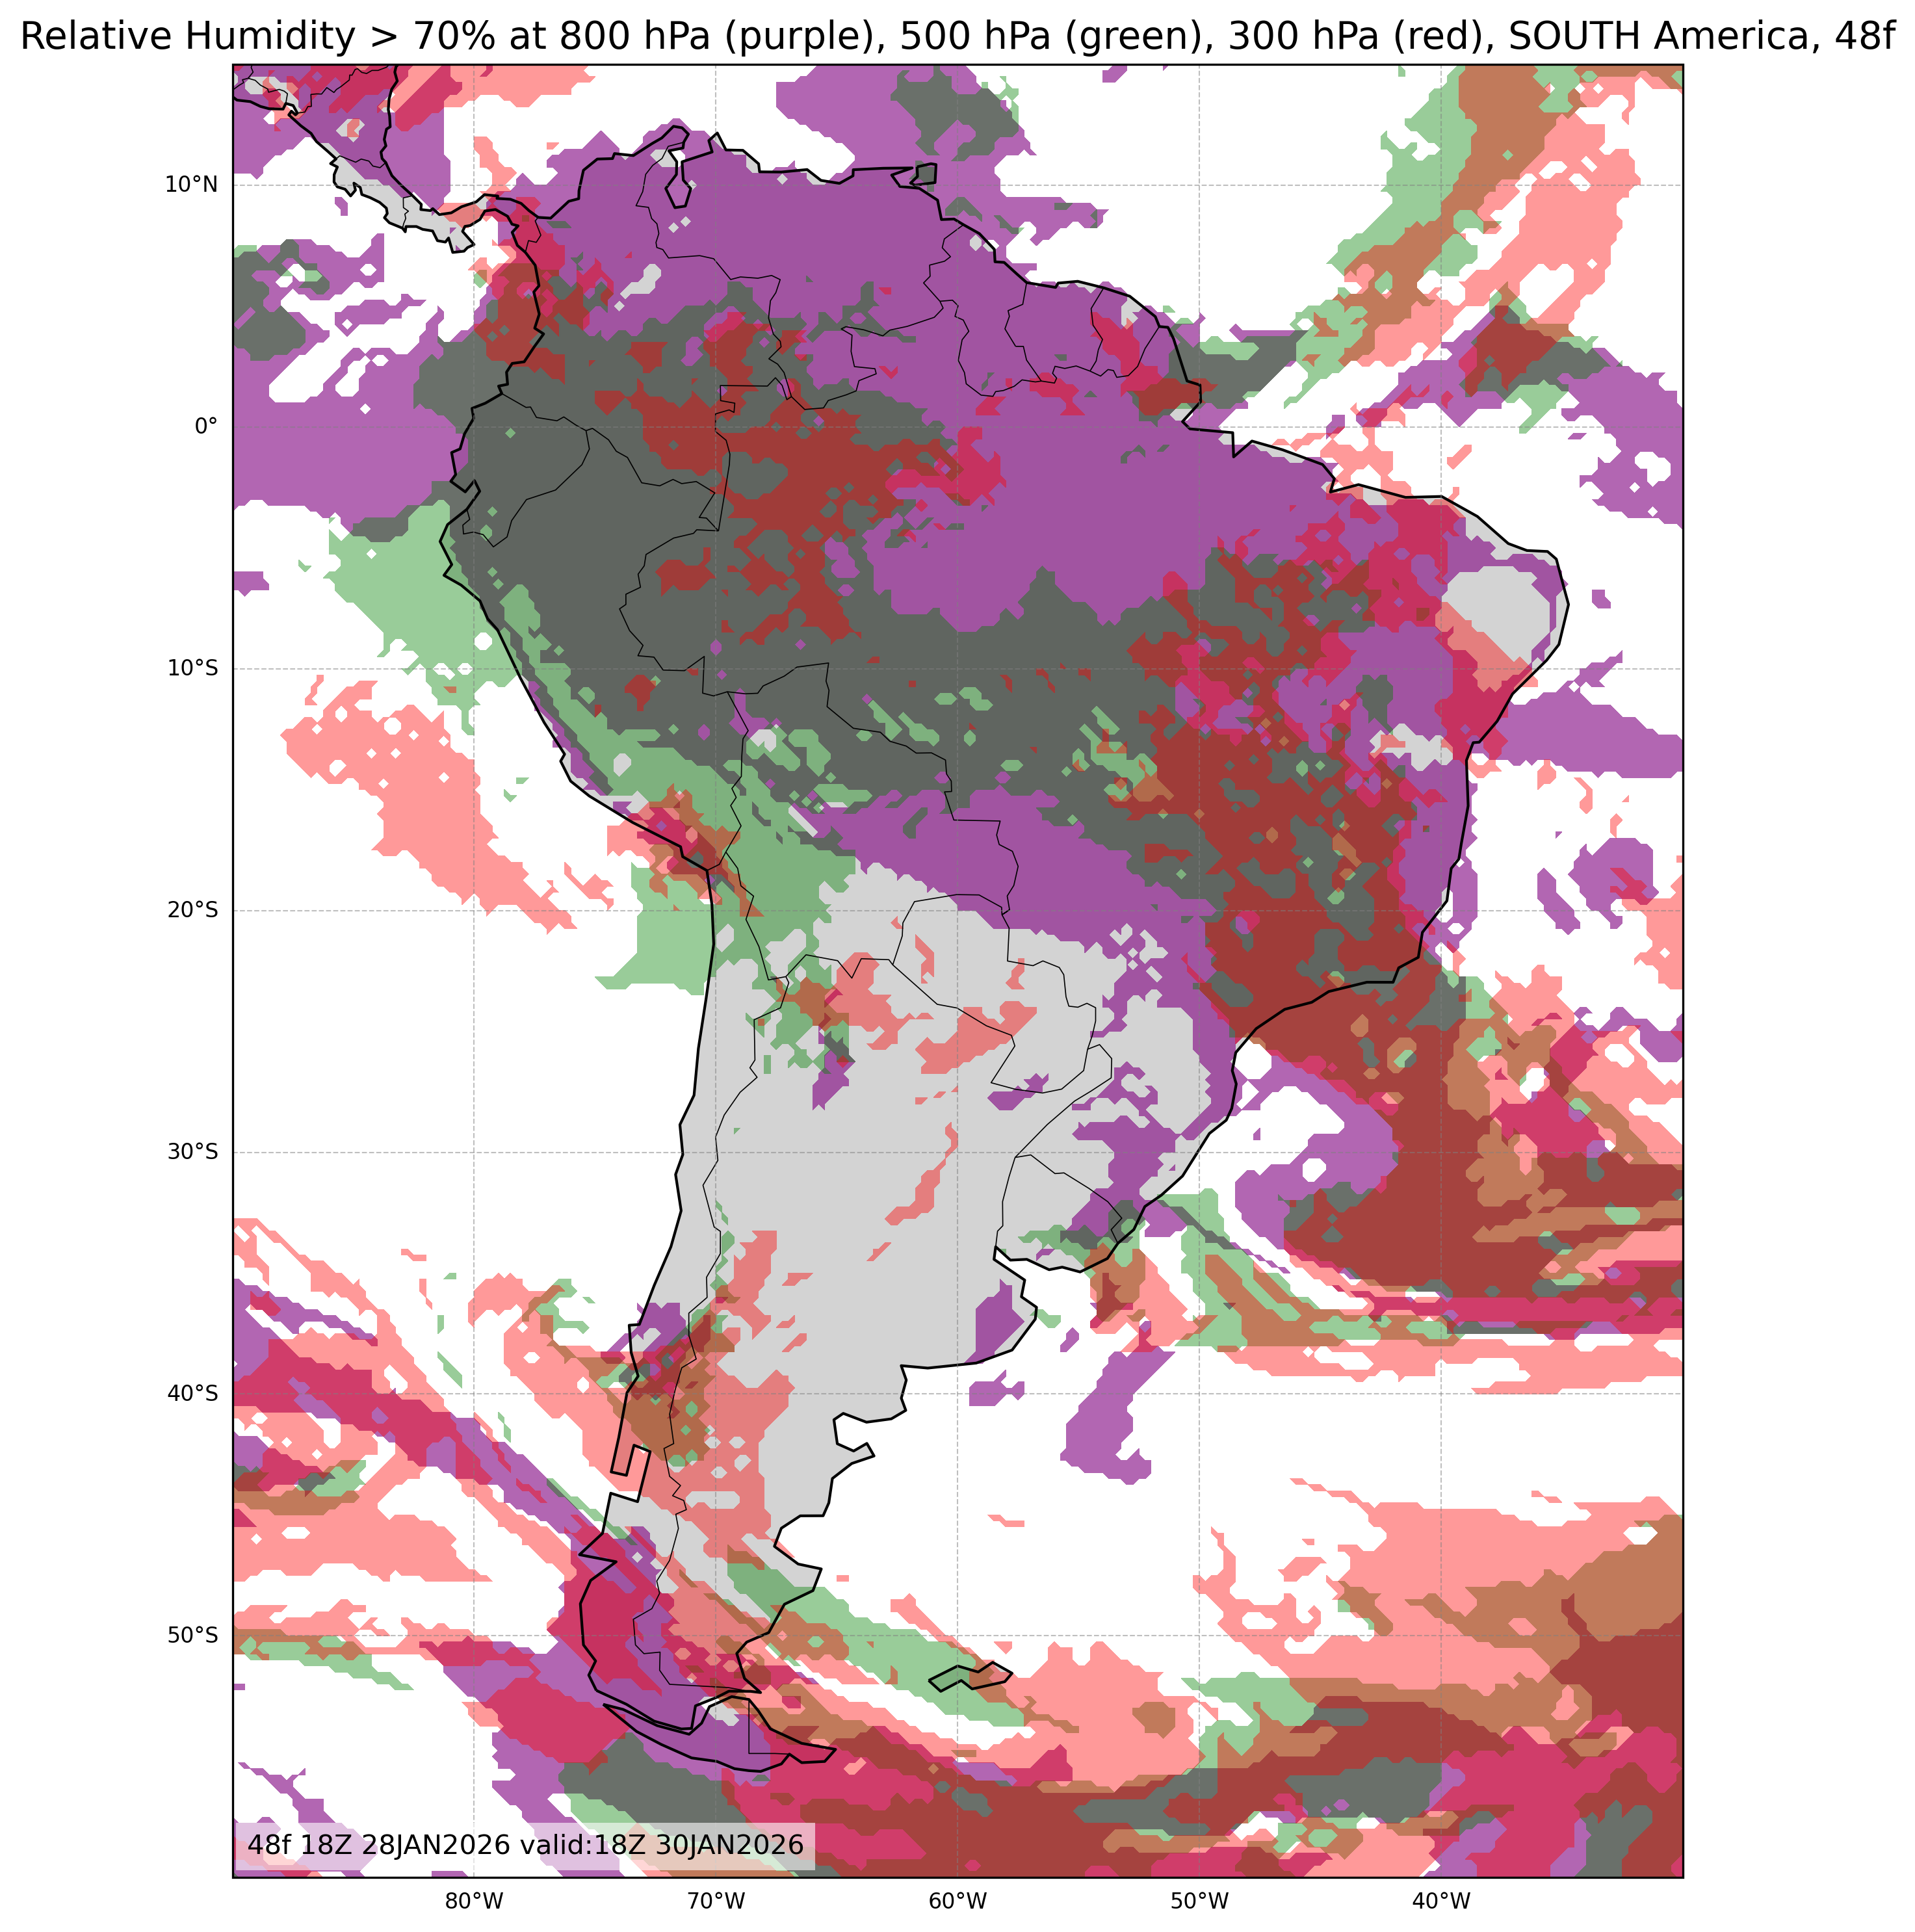
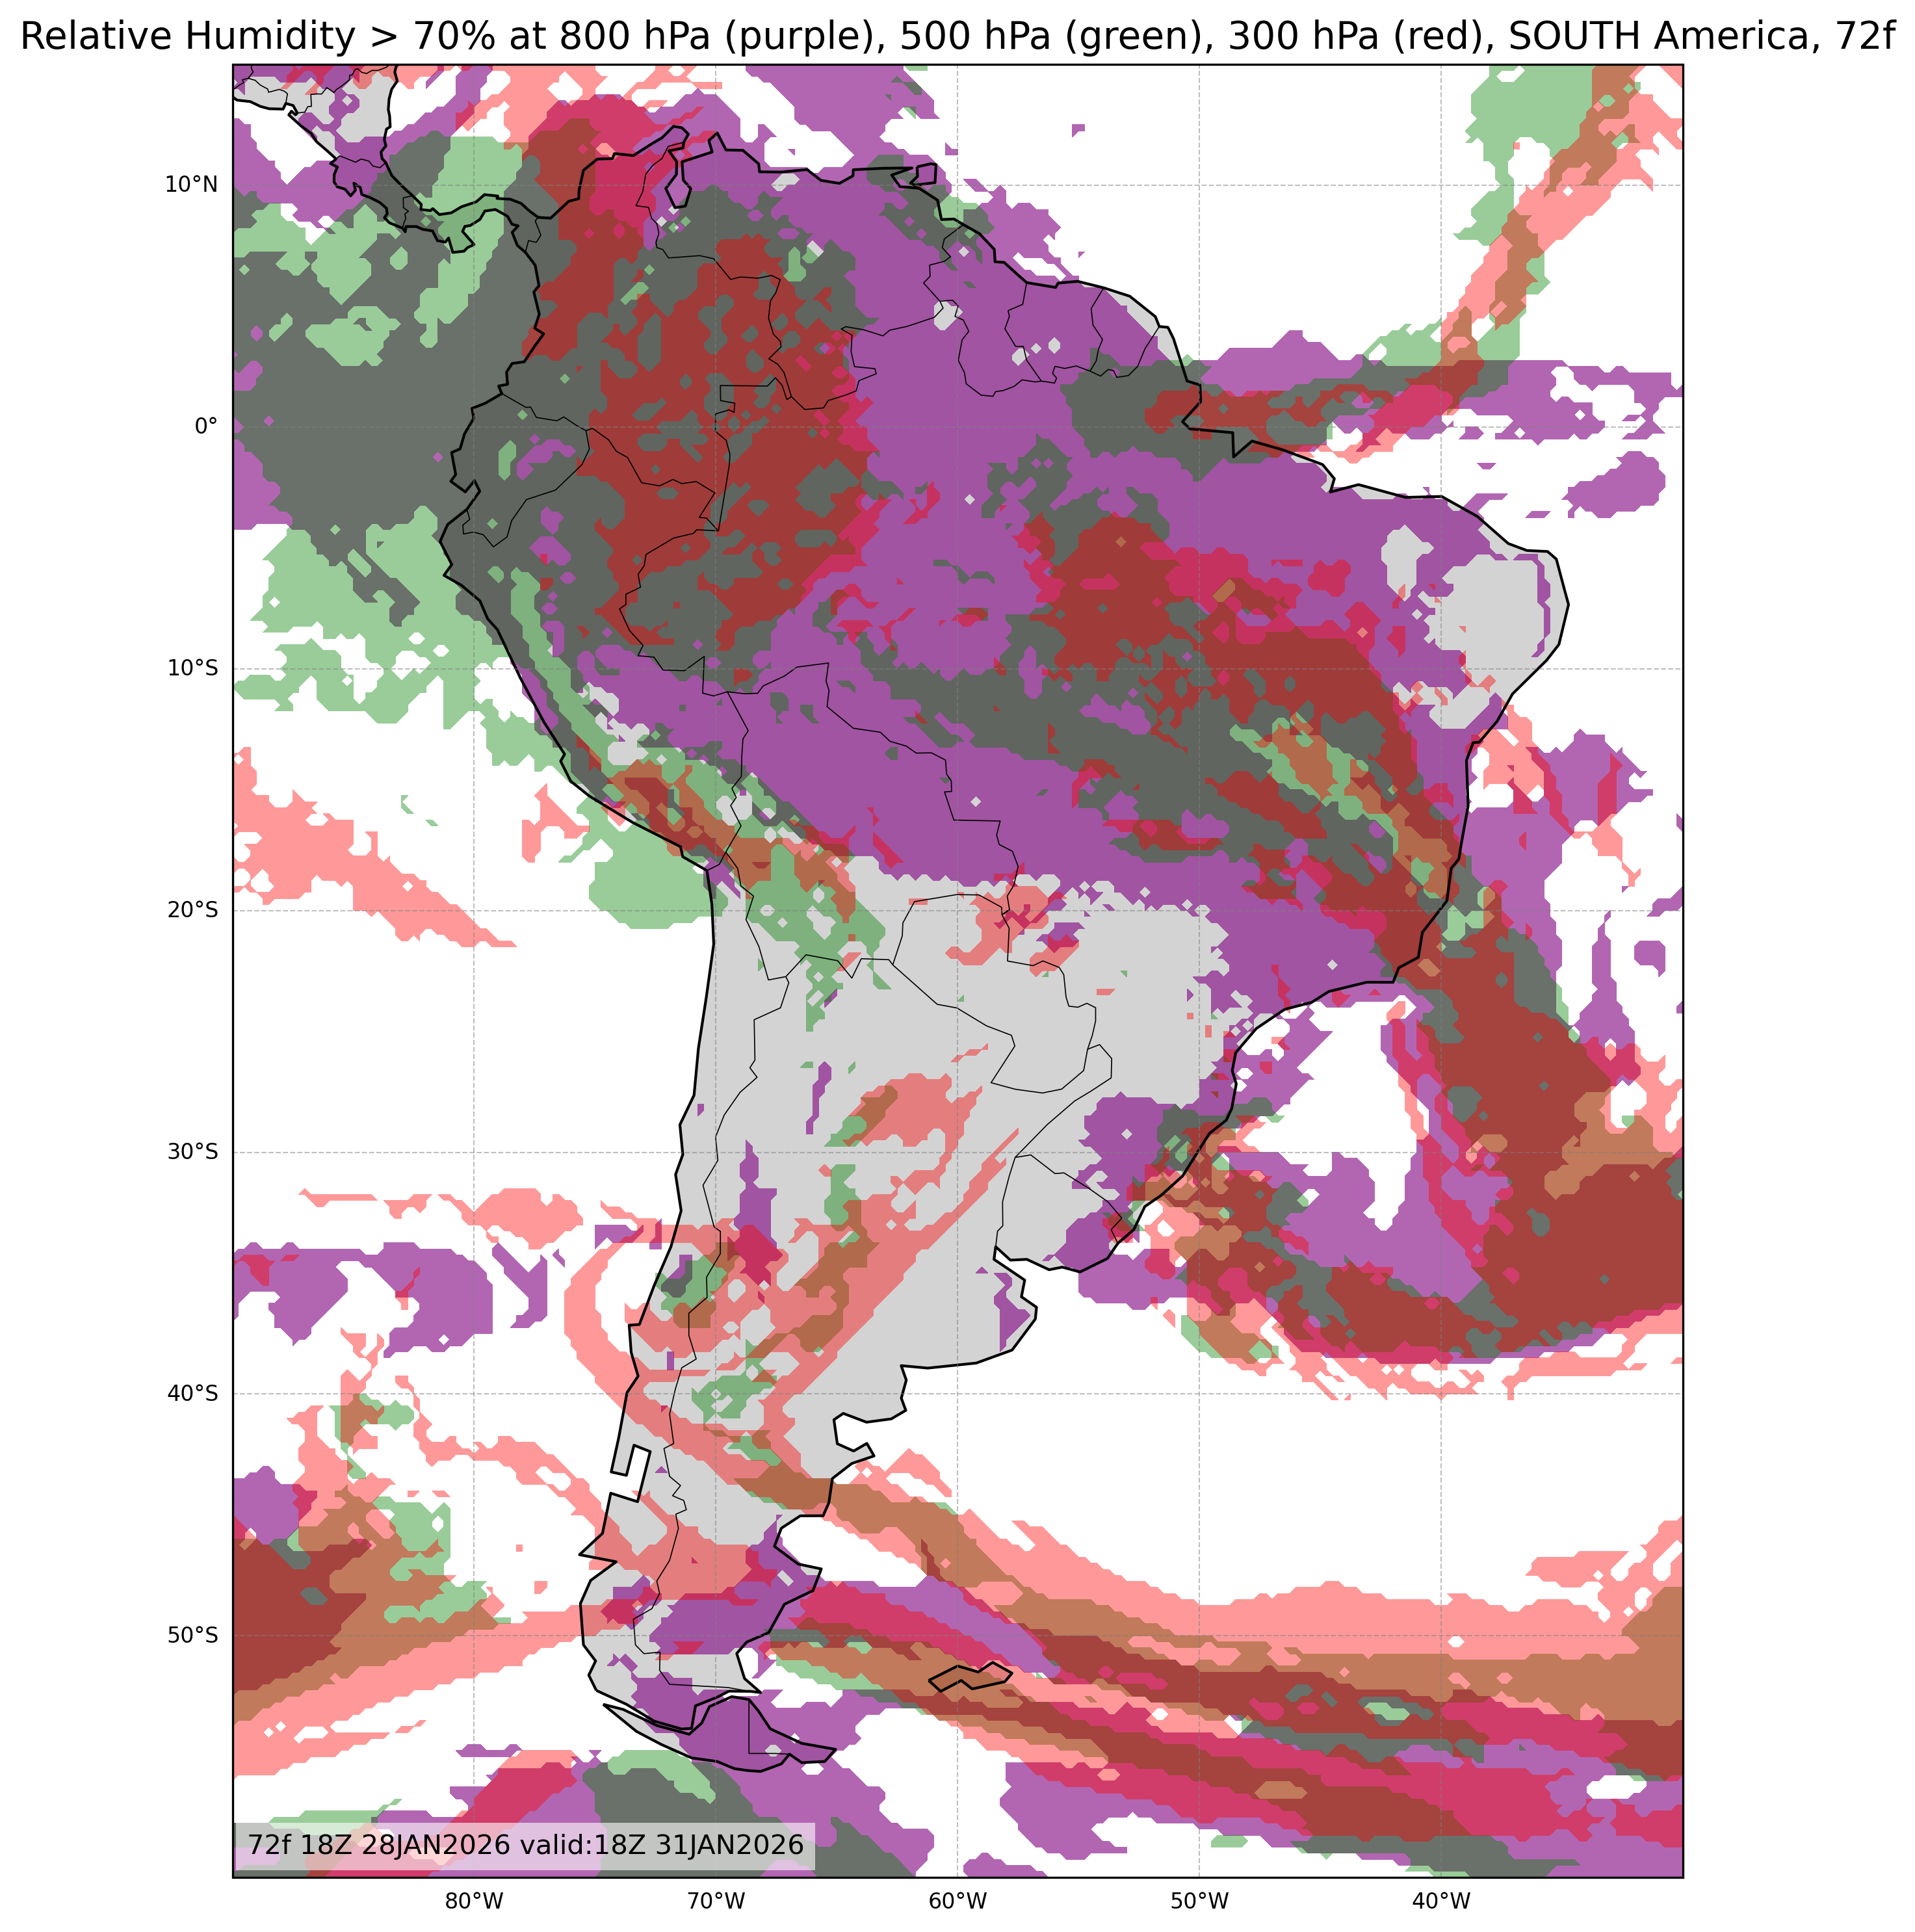
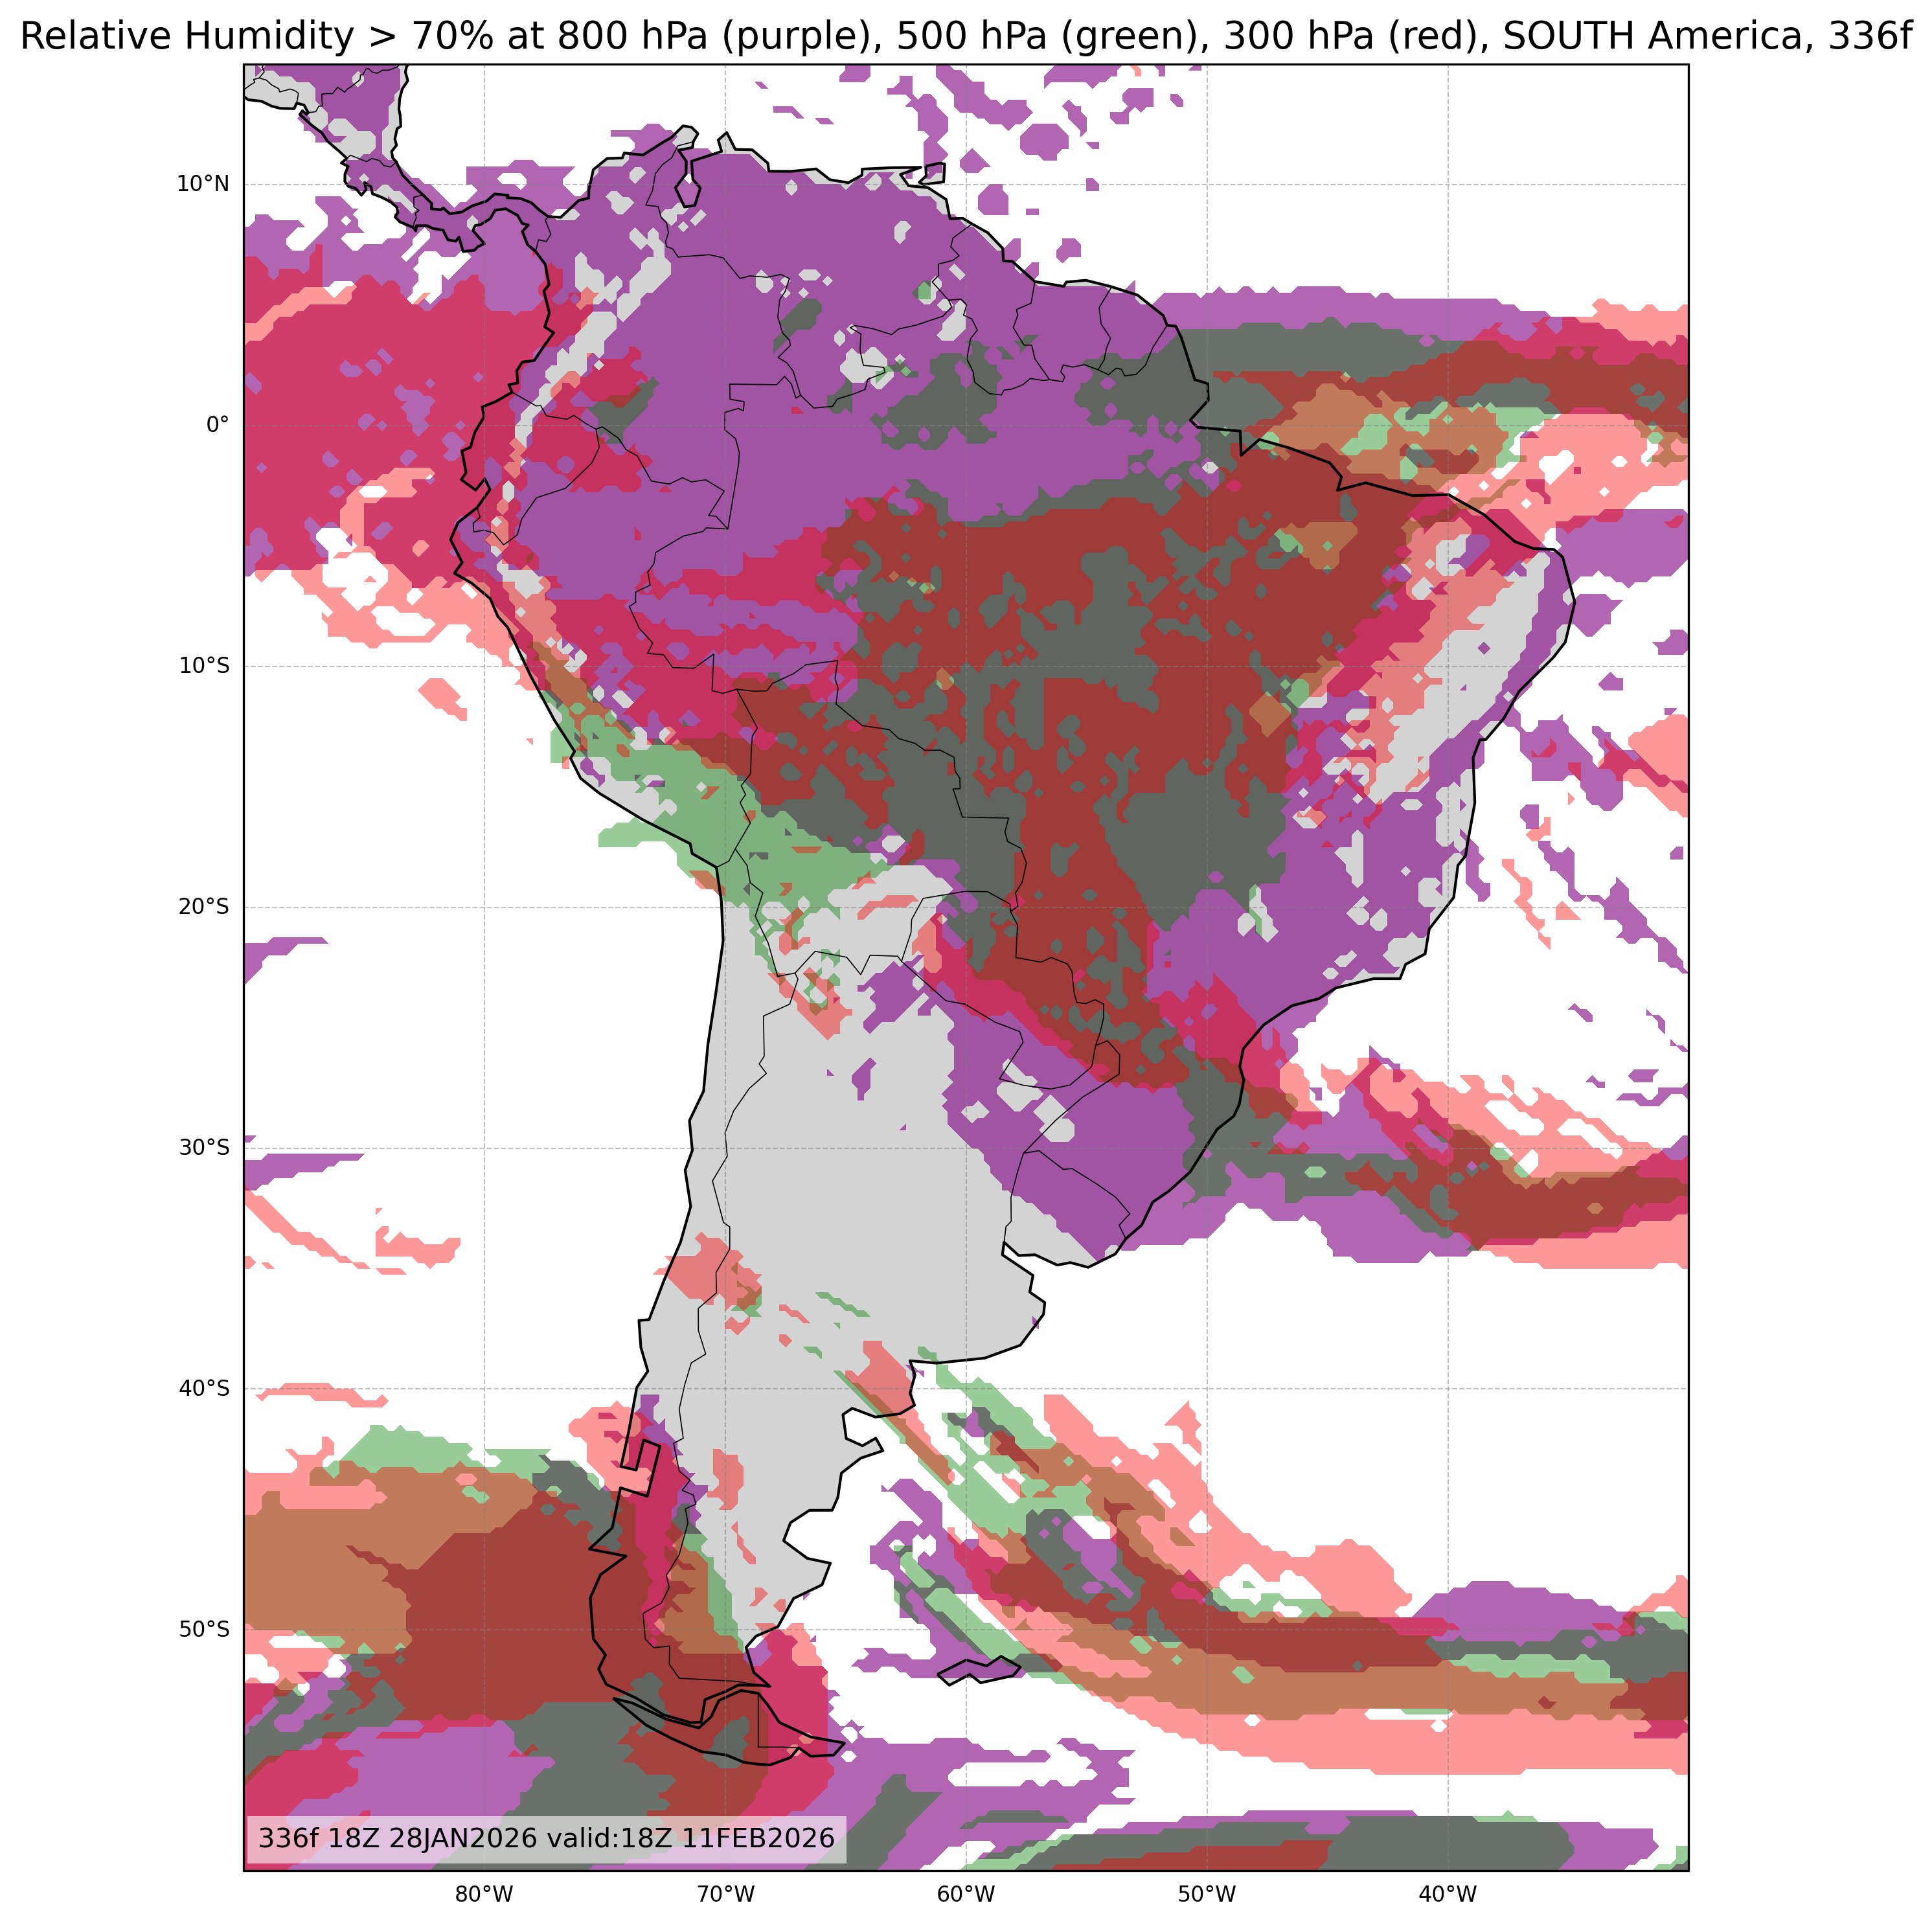
| Relative Humidity at 800, 500, & 300mb or Low, Middle, & High Cloud Cover |
All Times |
🔍 | 🔍 | 🔍 | 🔍 | 🔍 |
| Weather Map Images | Time: | Day 5 120 Hours |
Day 6 144 Hours |
Day 7 168 Hours |
Day 8 192 Hours |
Day 9 216 Hours |
| Field: | All Fields |
All Fields |
All Fields |
All Fields |
All Fields |
|
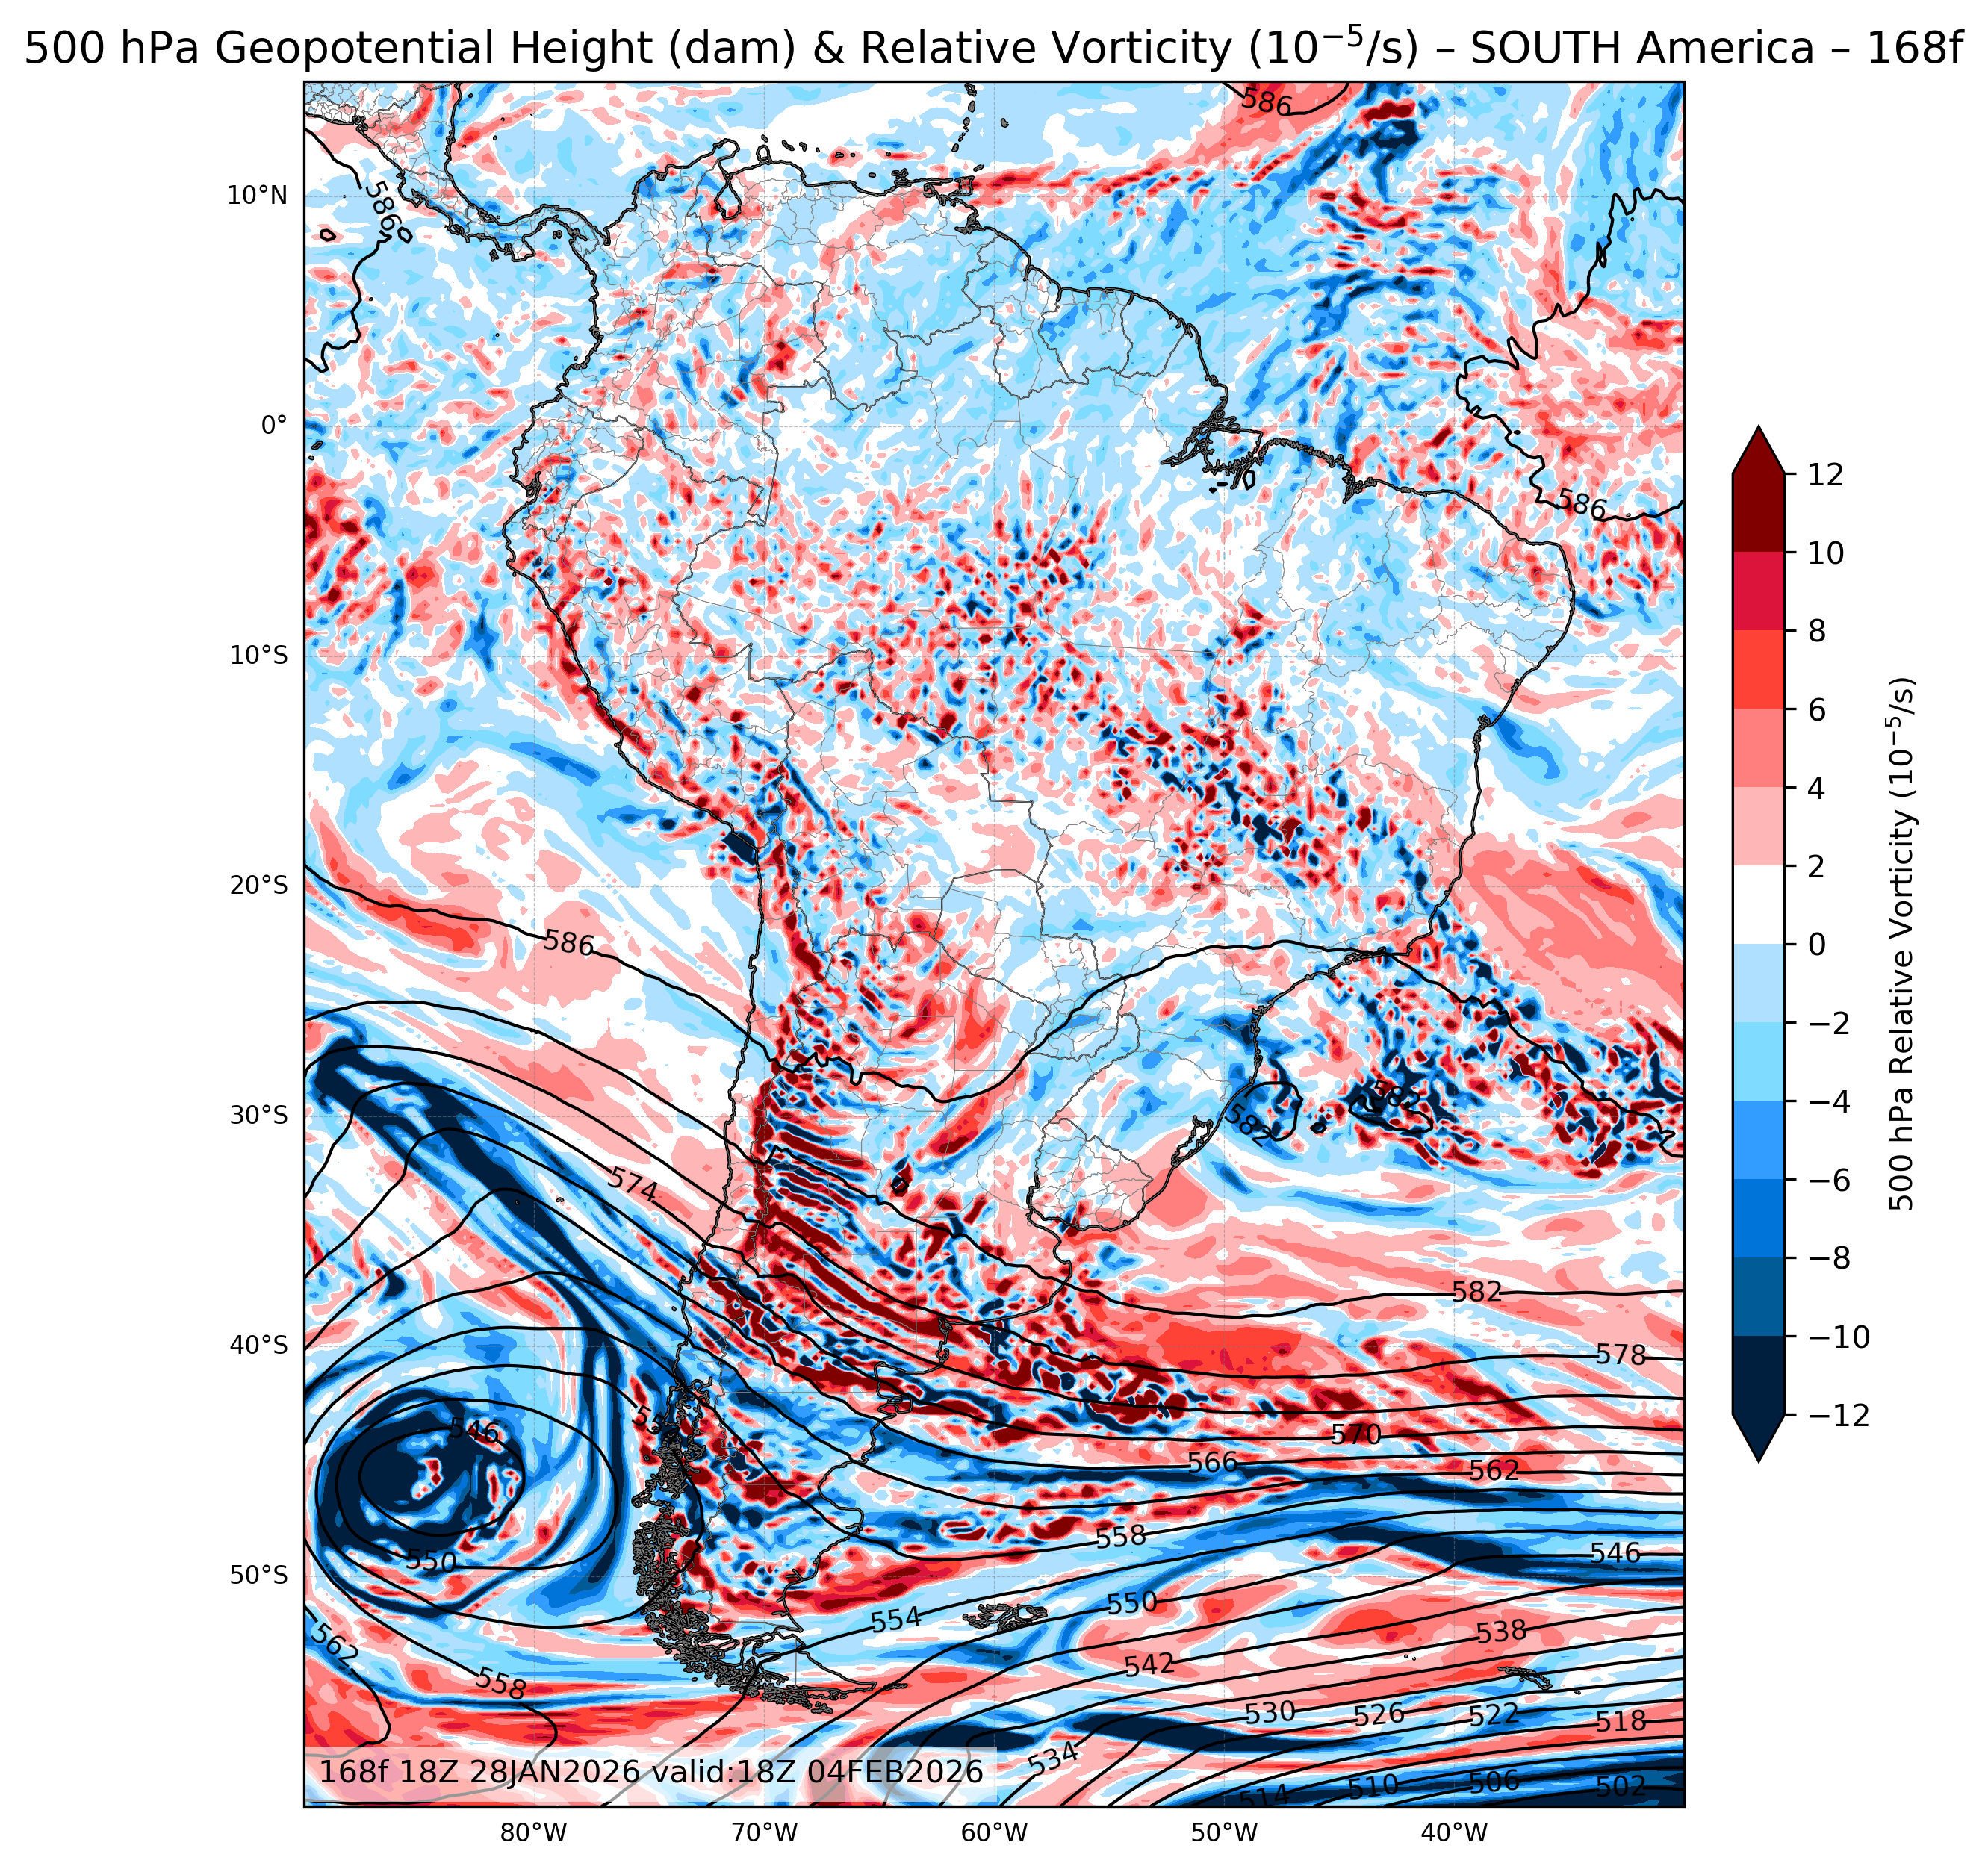
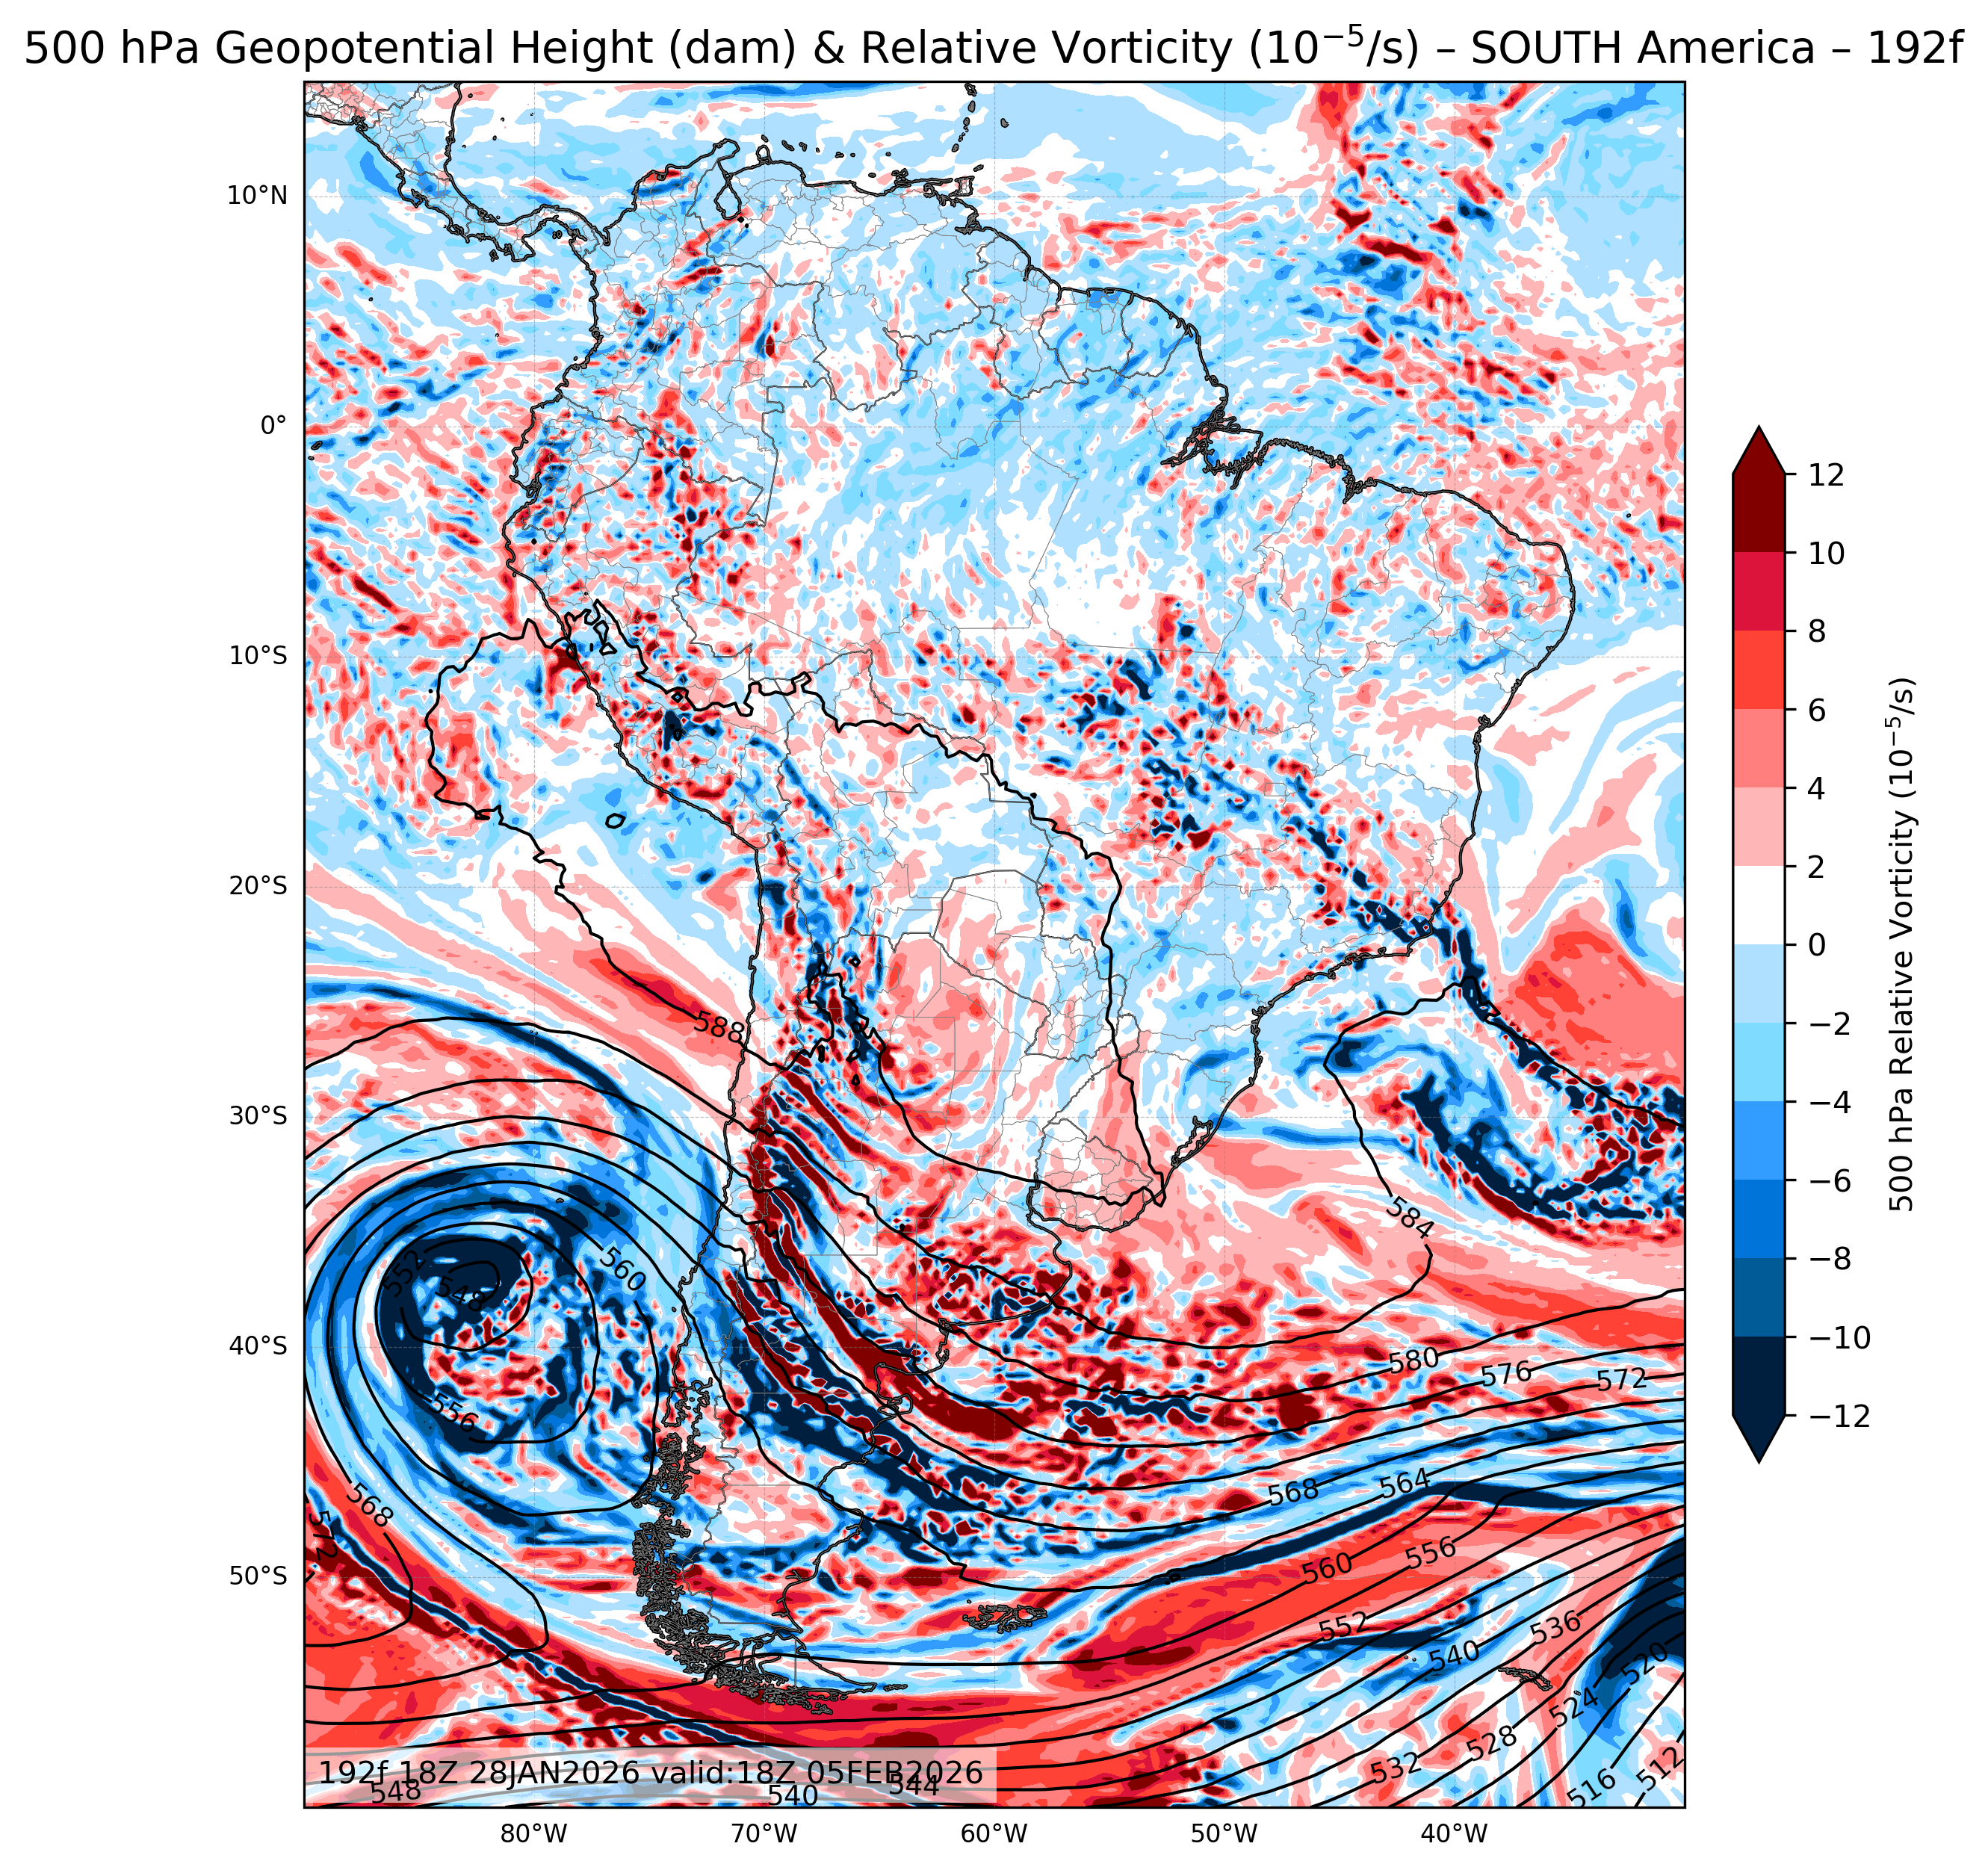
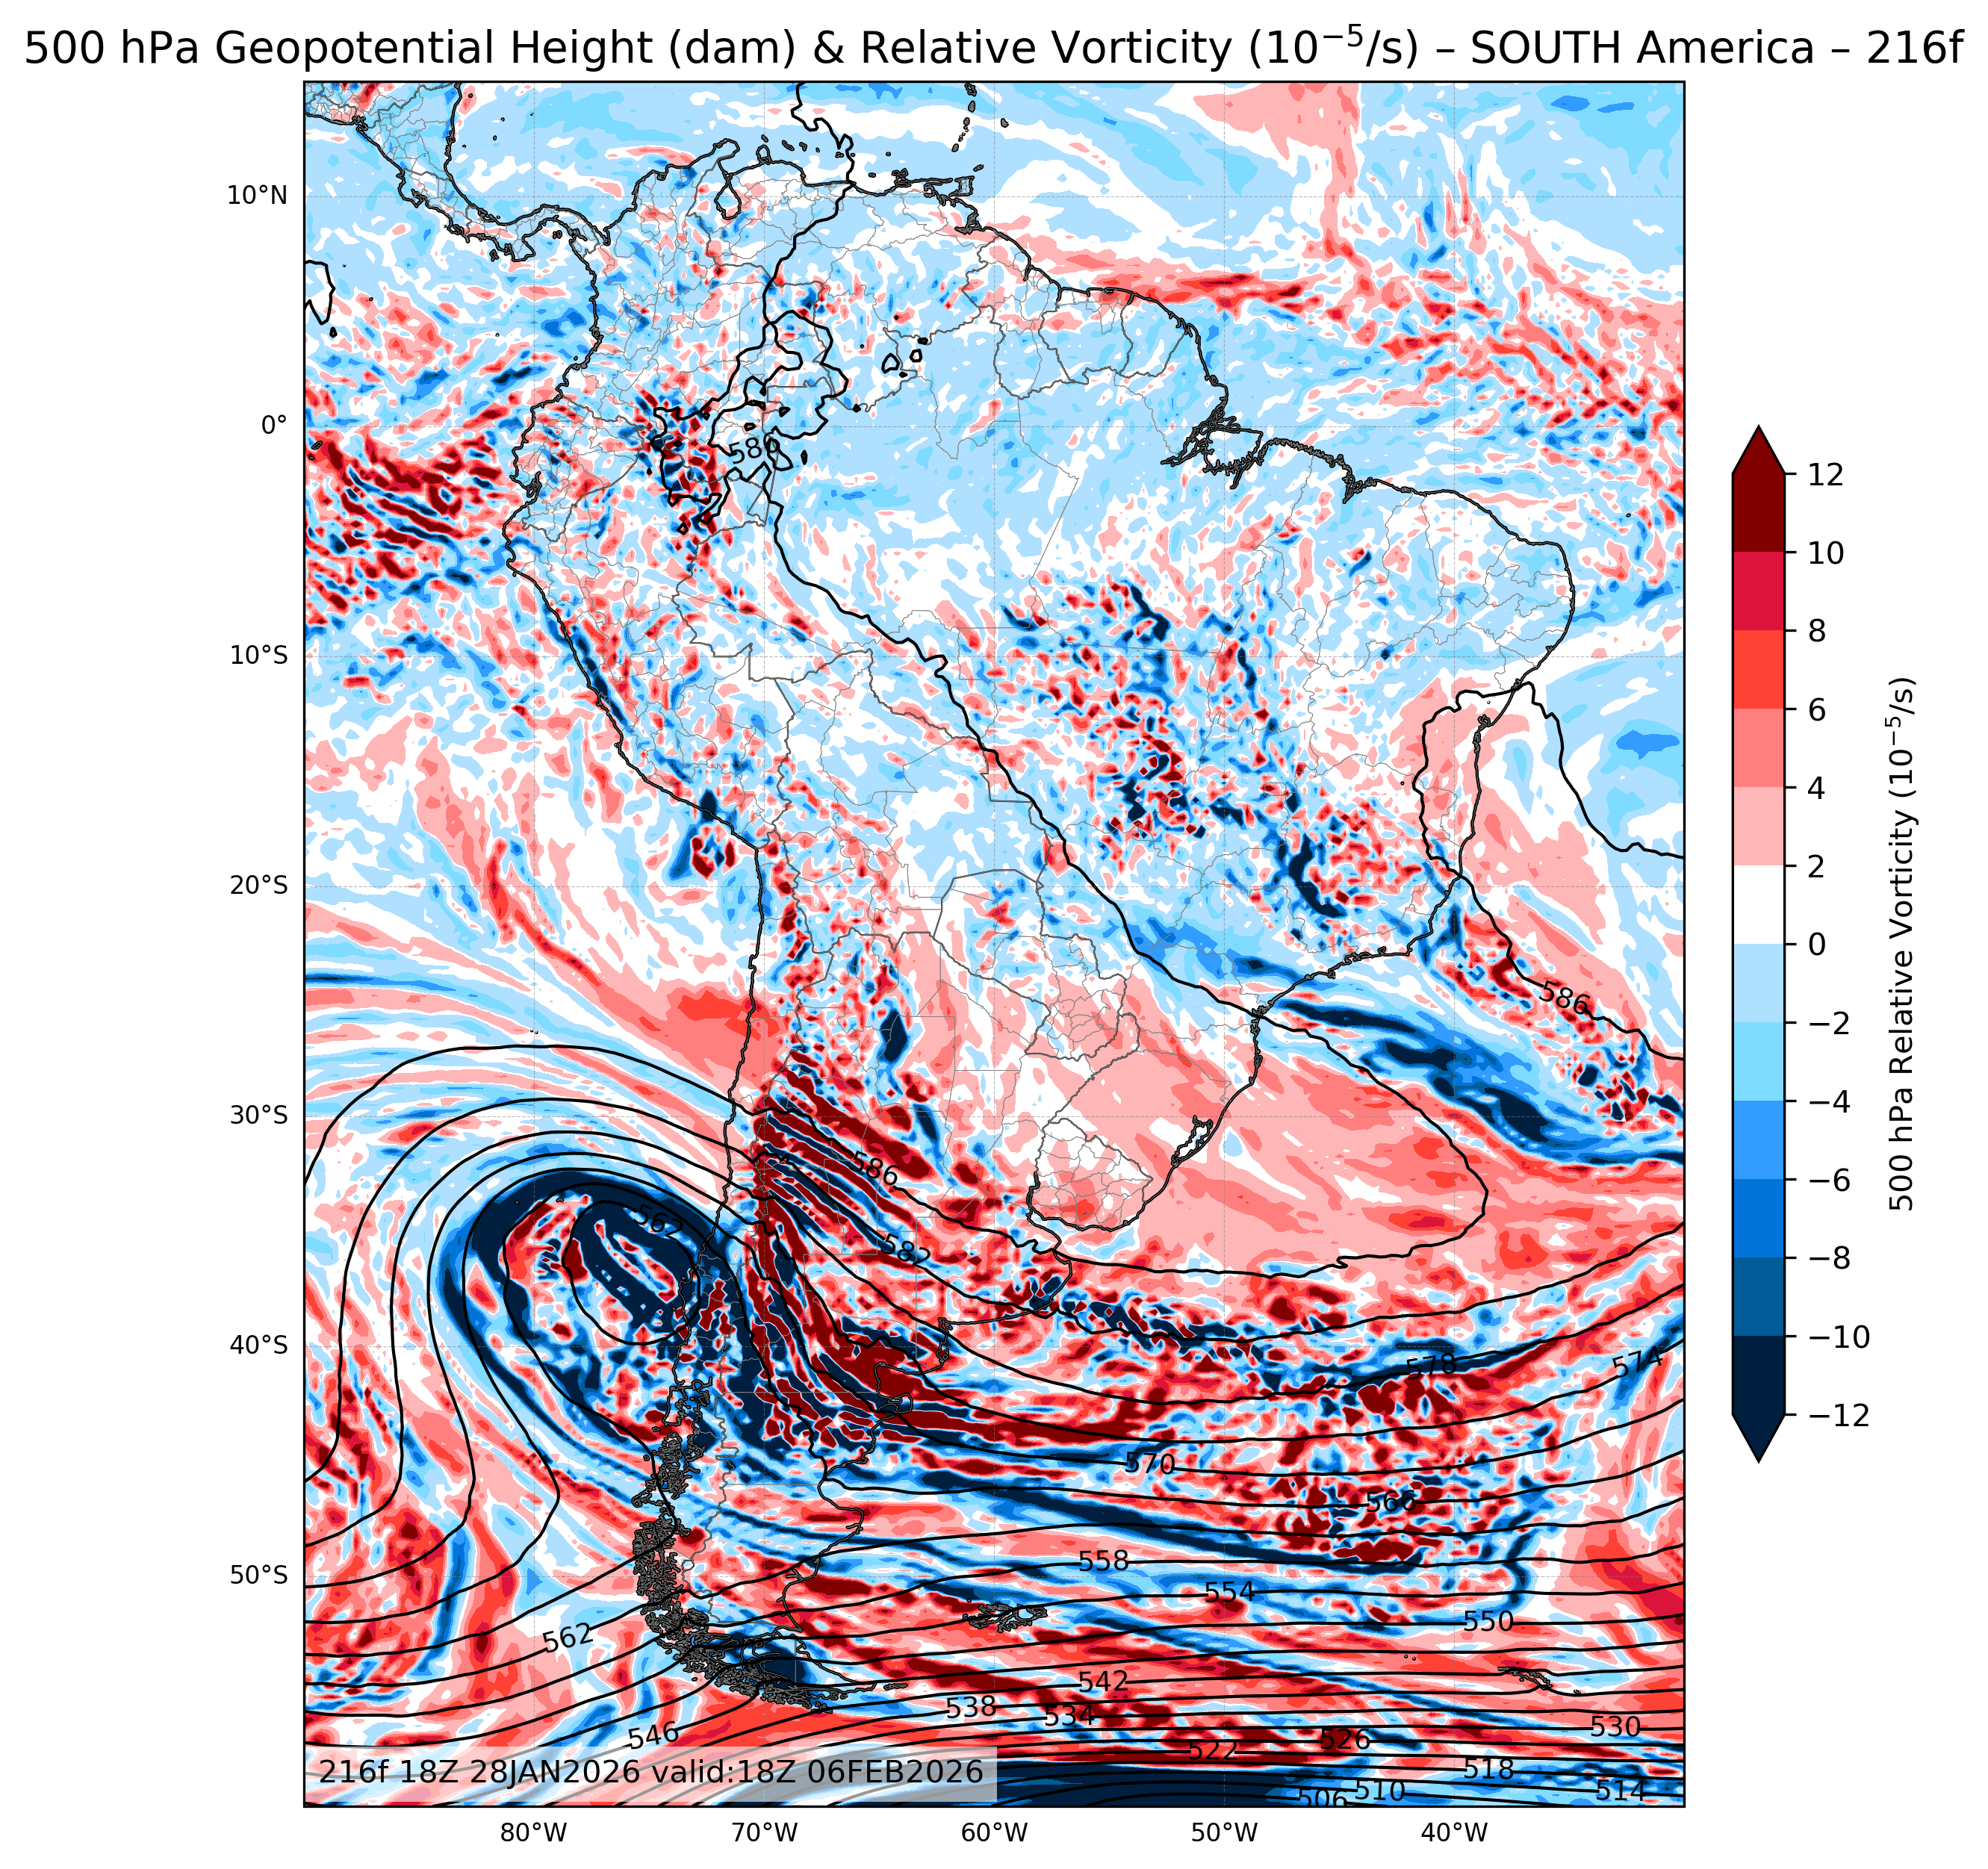
| 500mb Geopotential Height & Vorticity |
All Times |
🔍 | 🔍 | 🔍 | 🔍 | 🔍 |
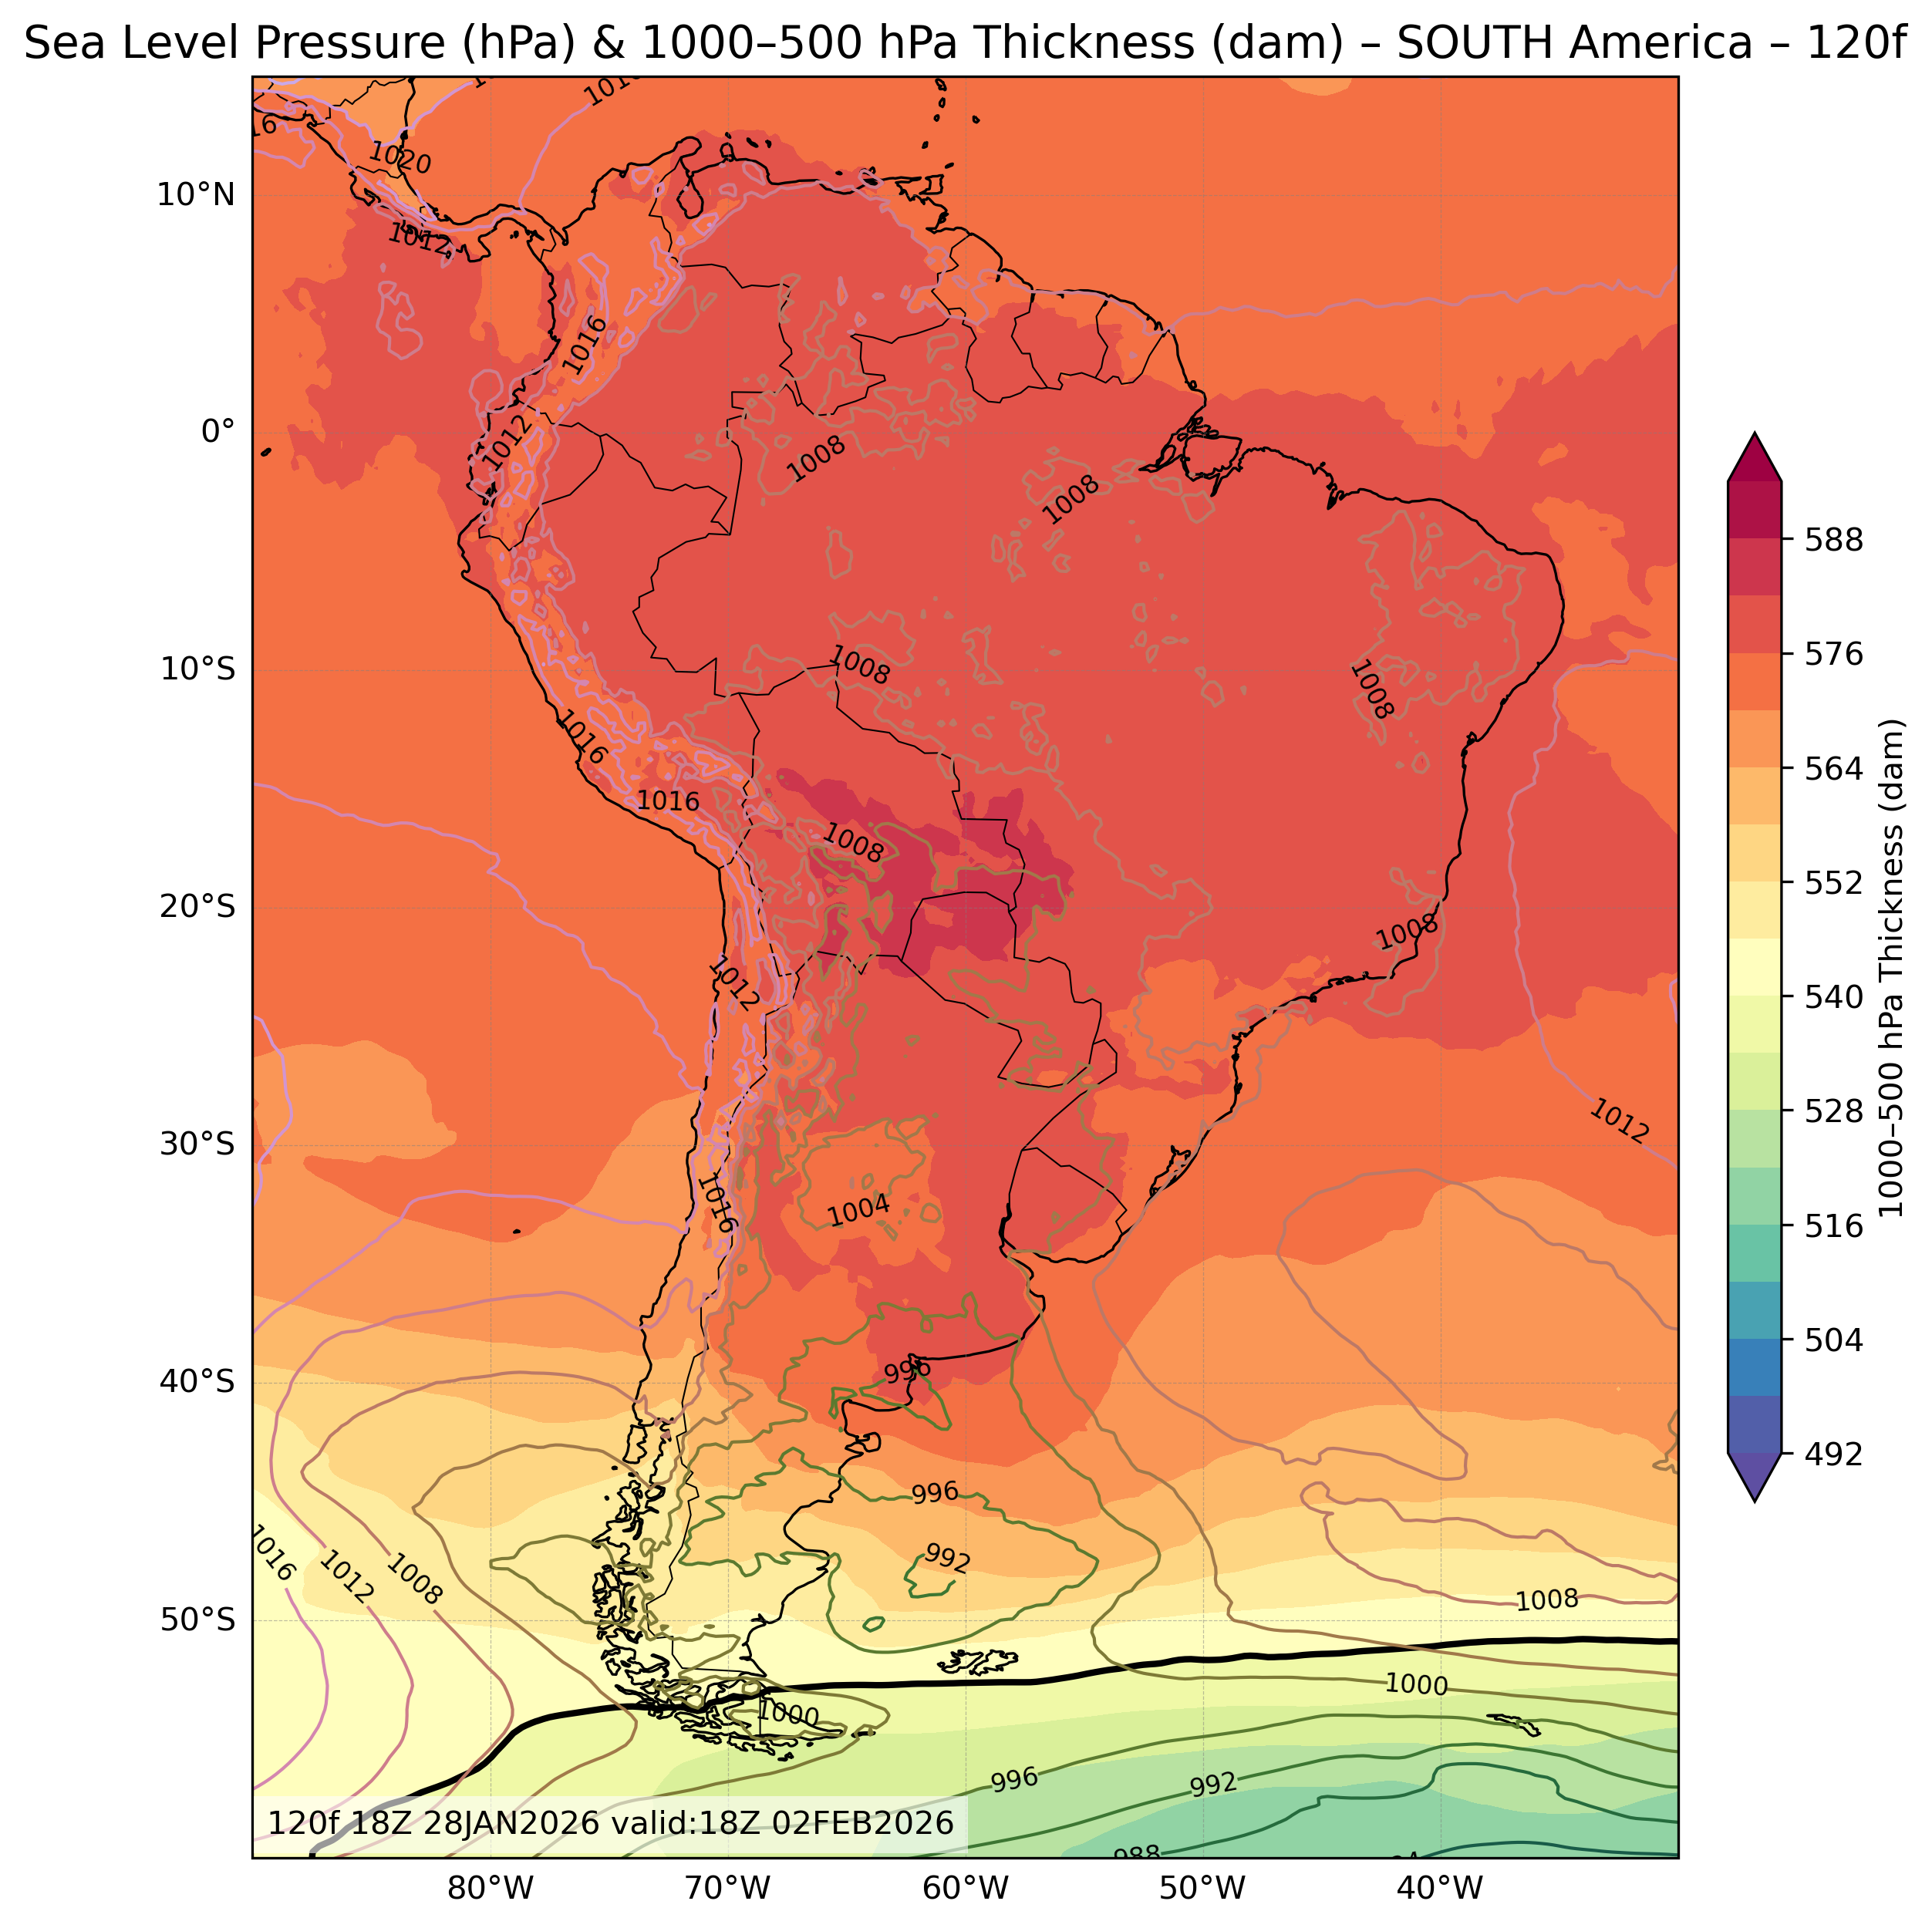
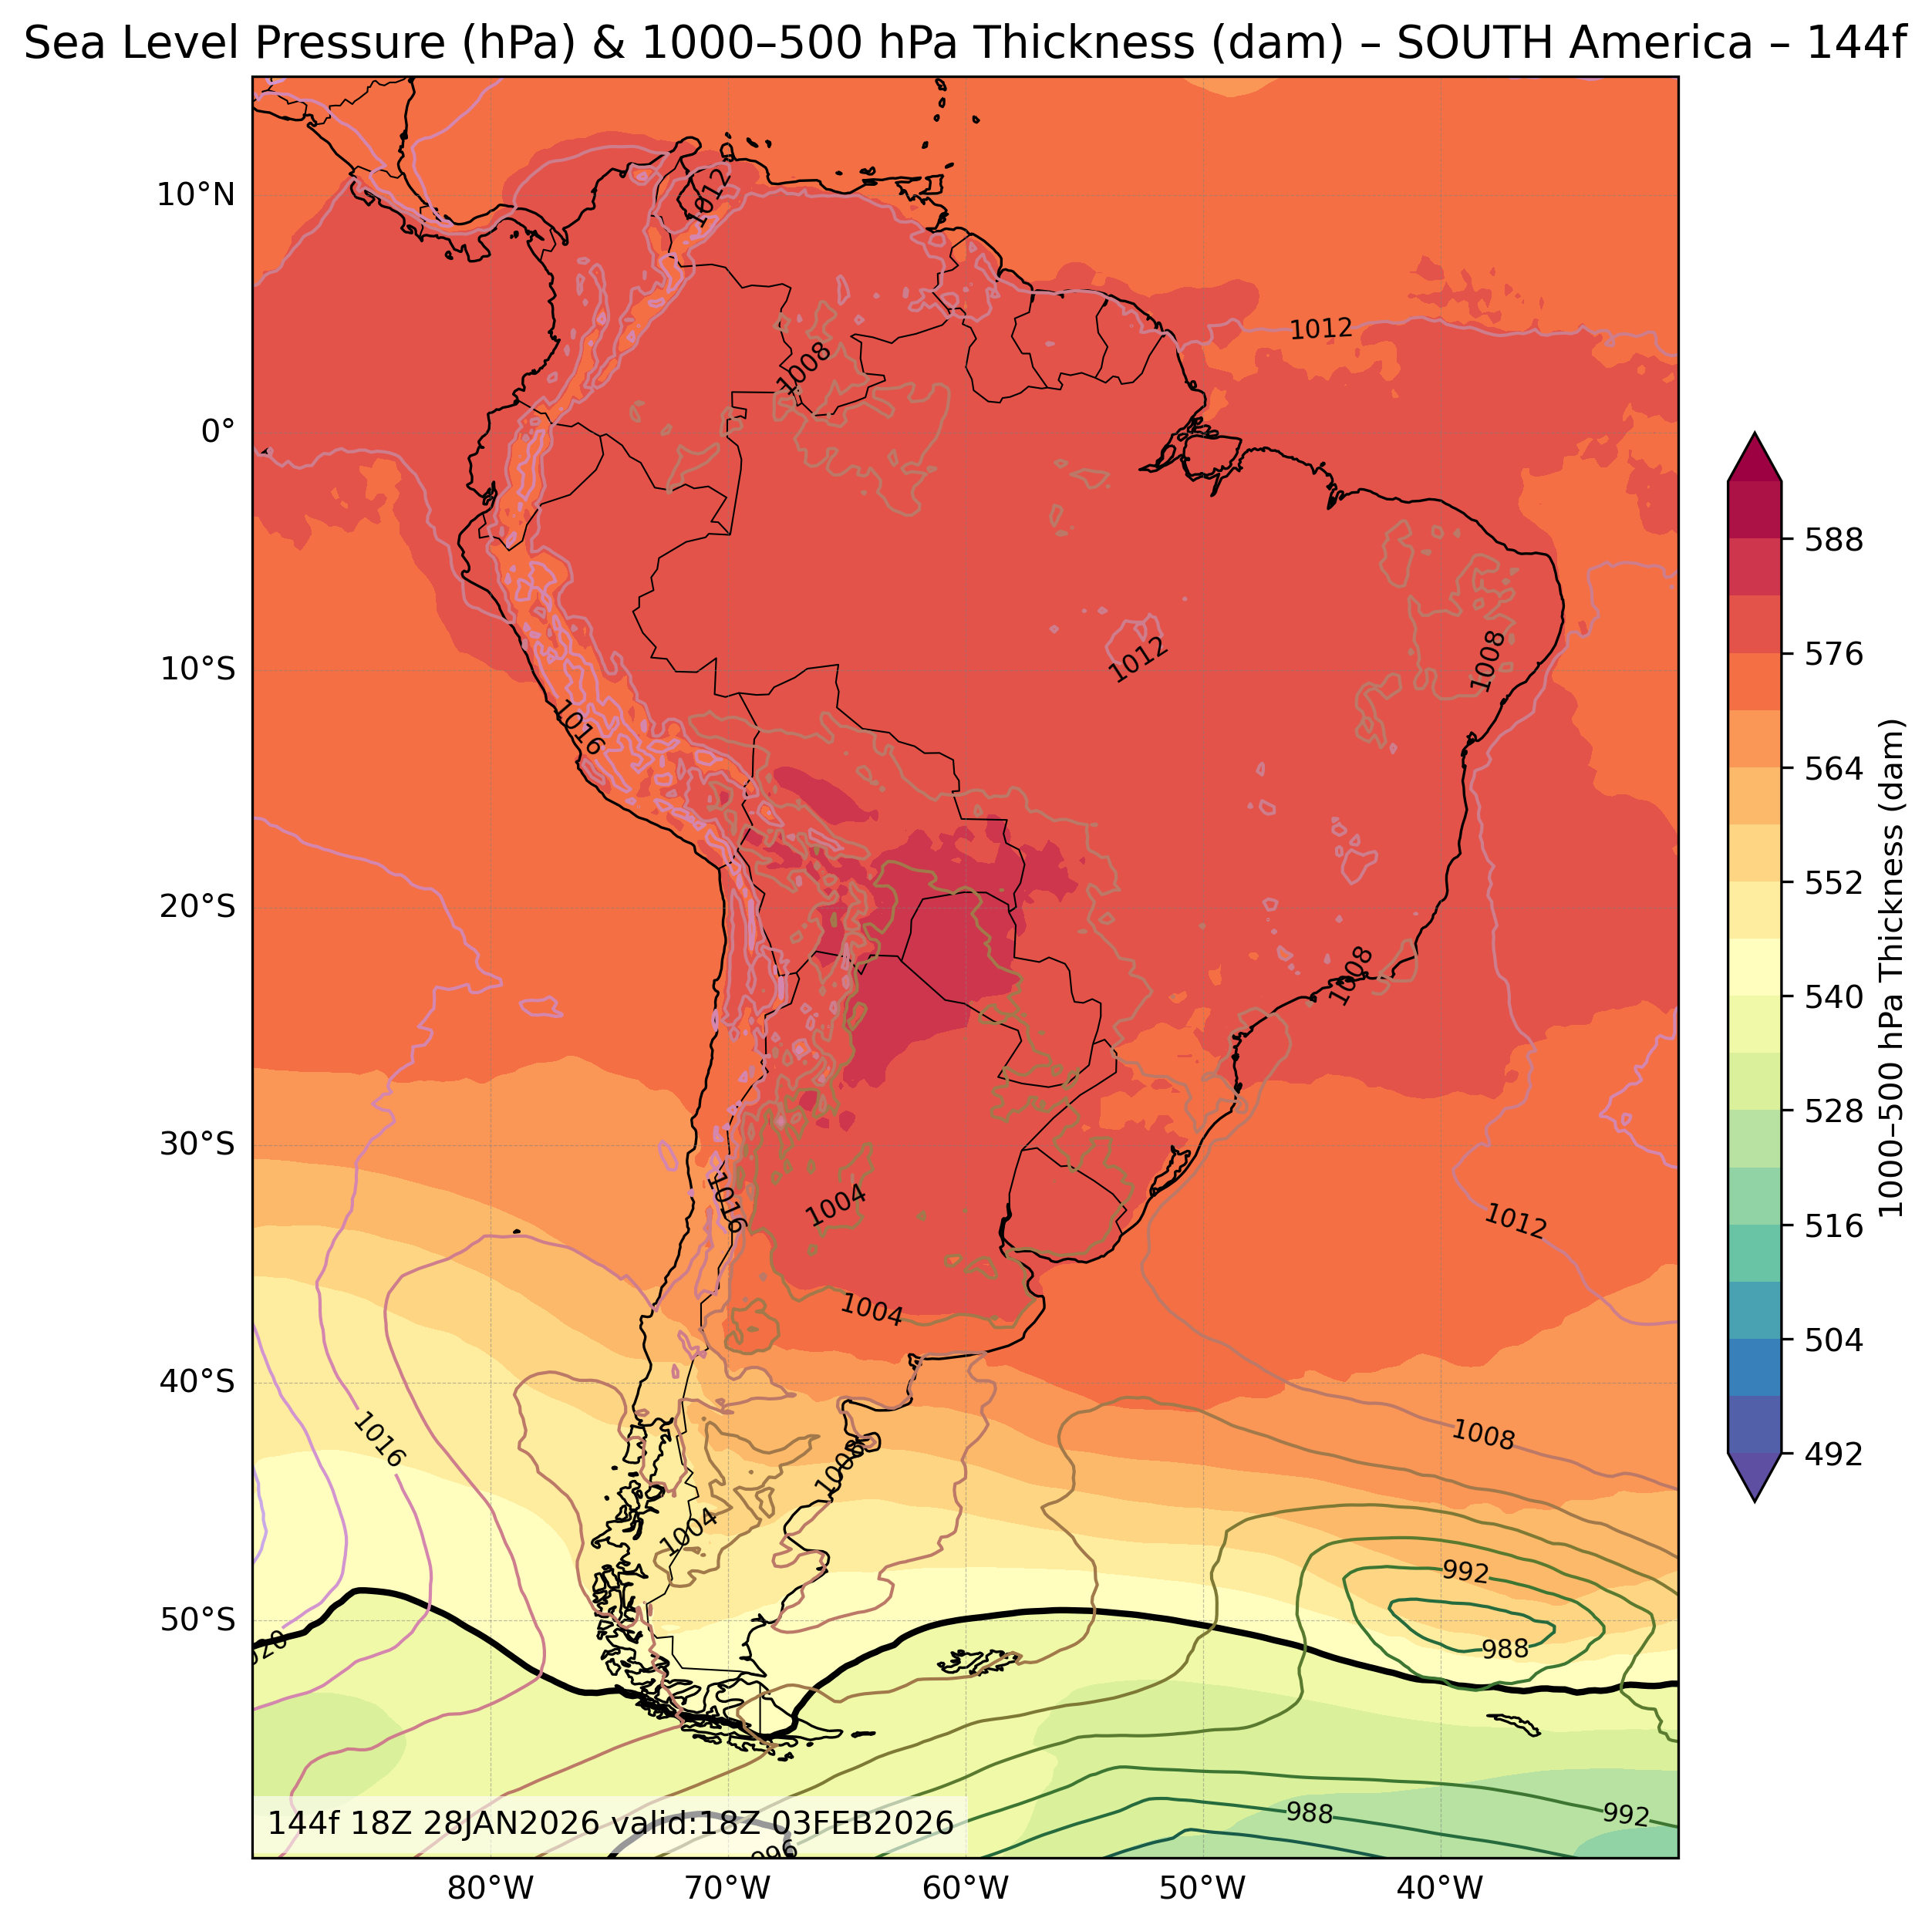
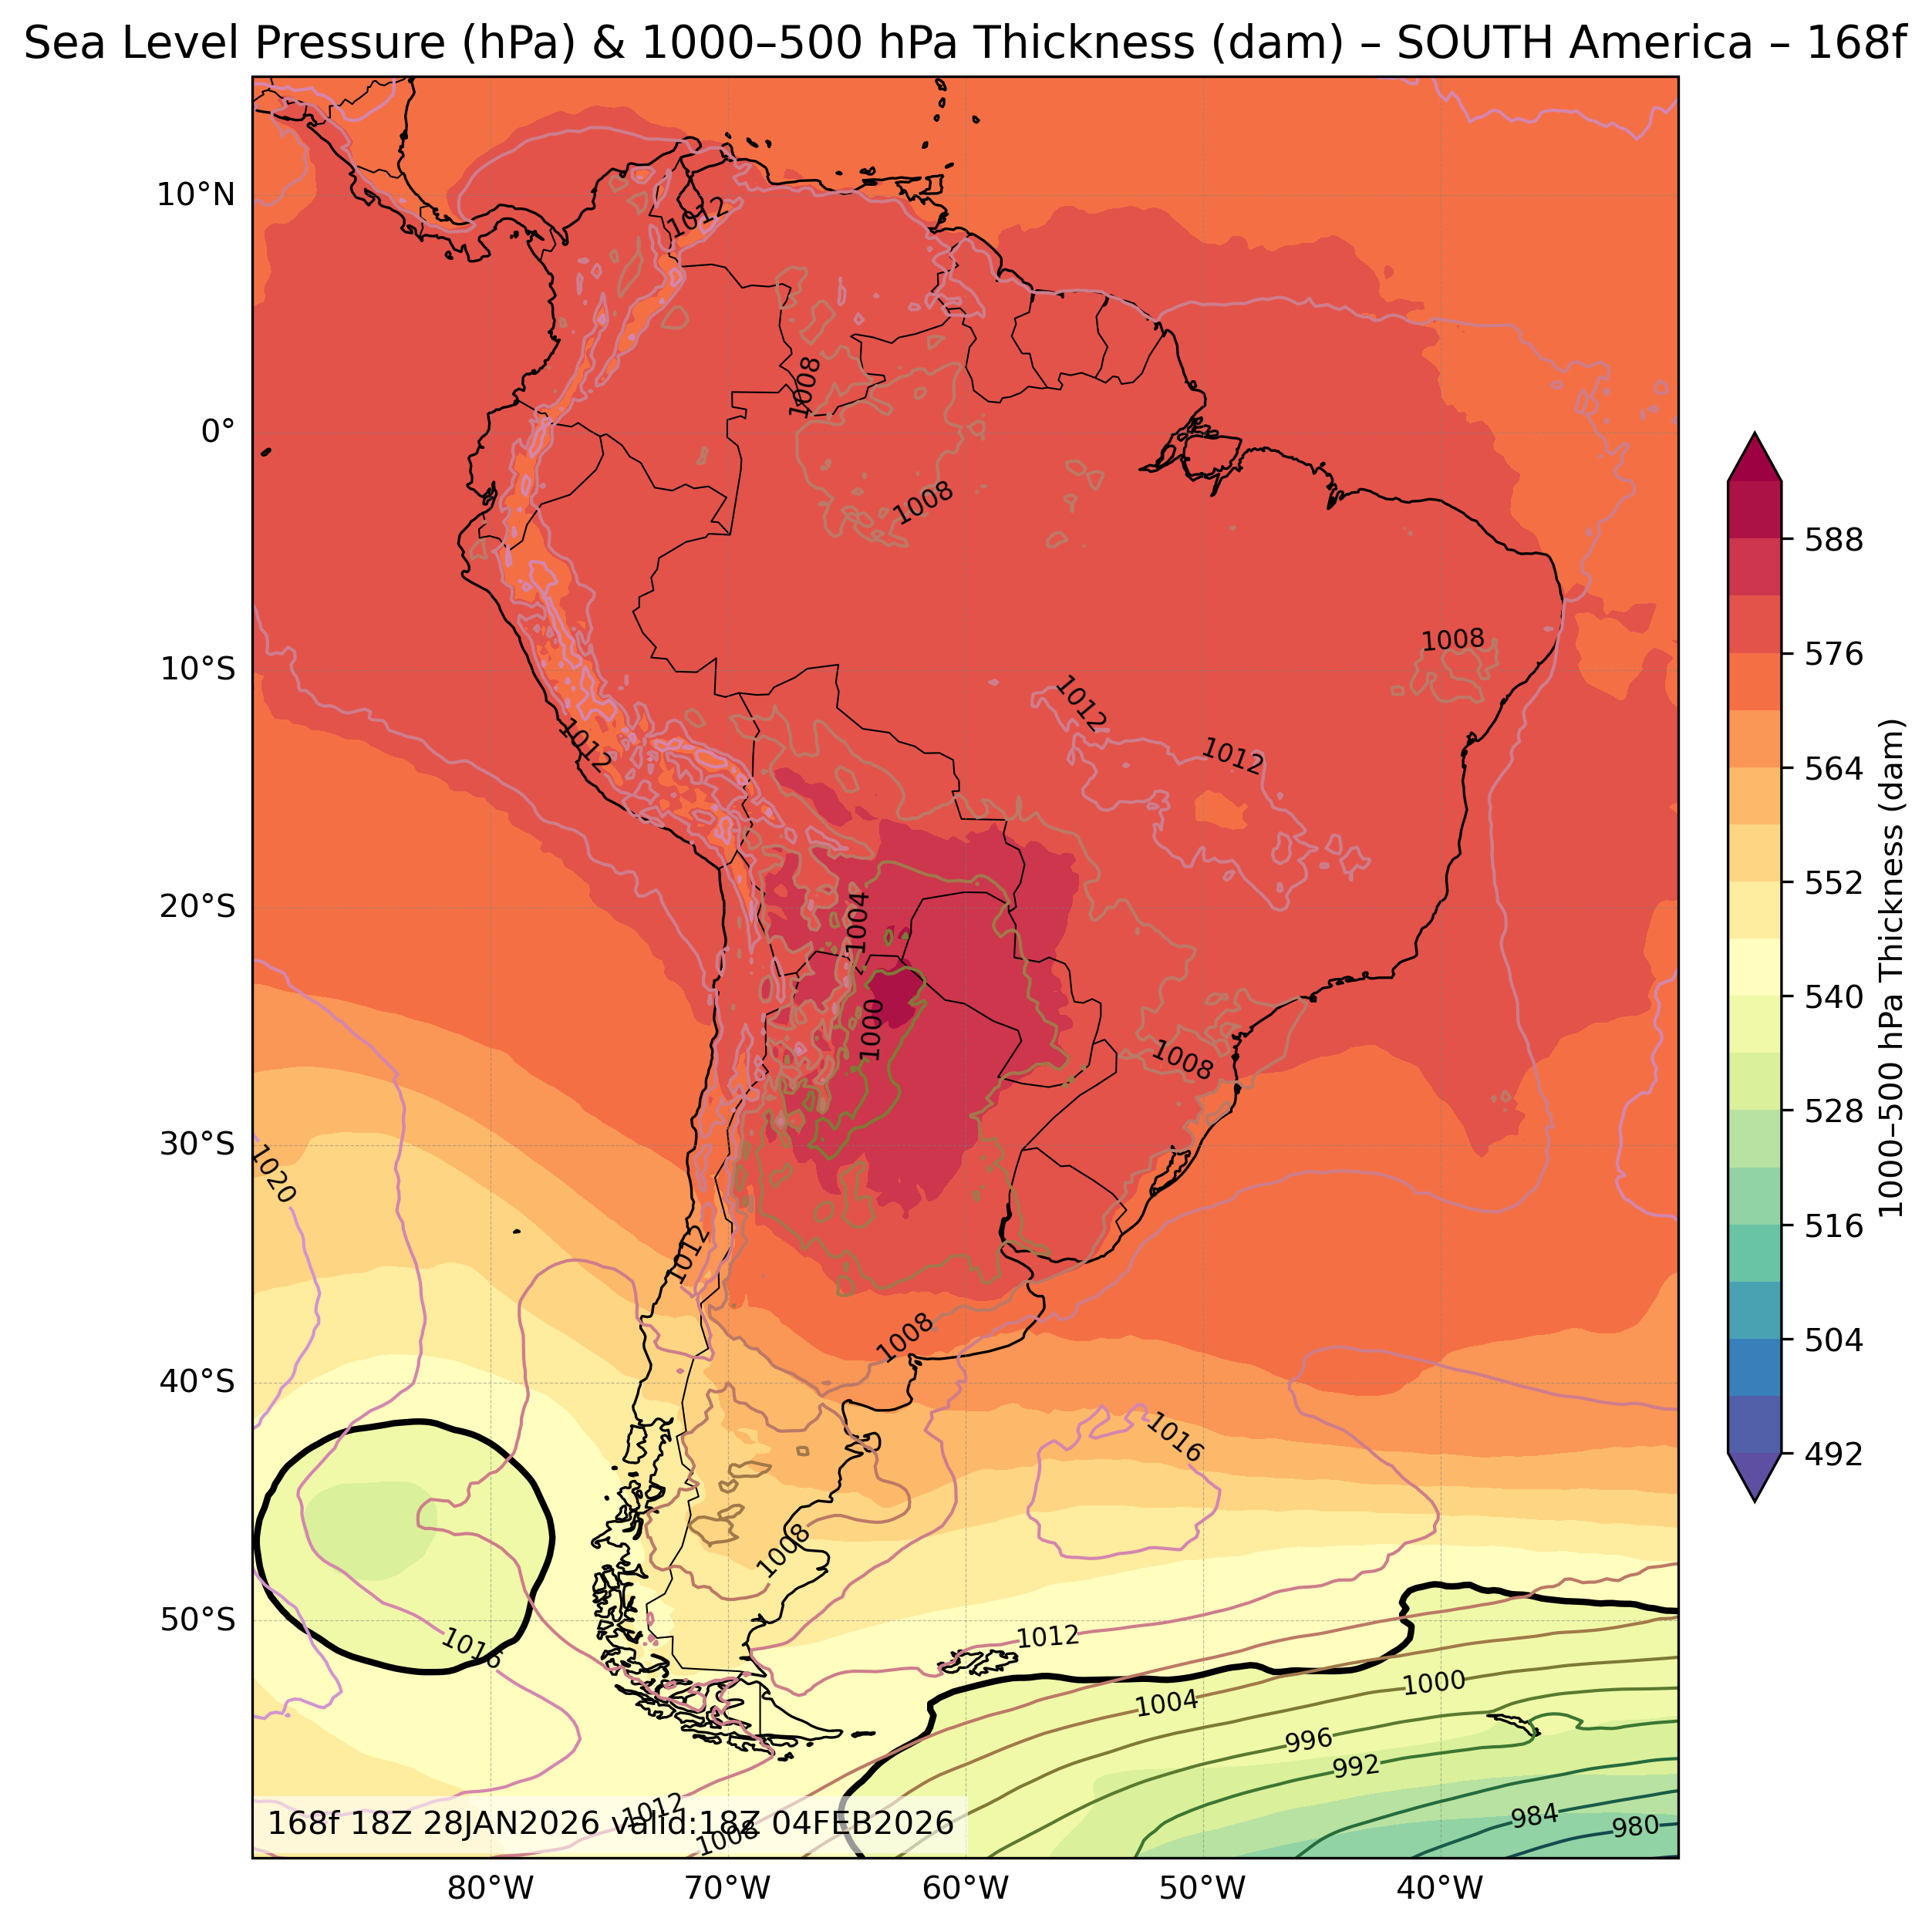
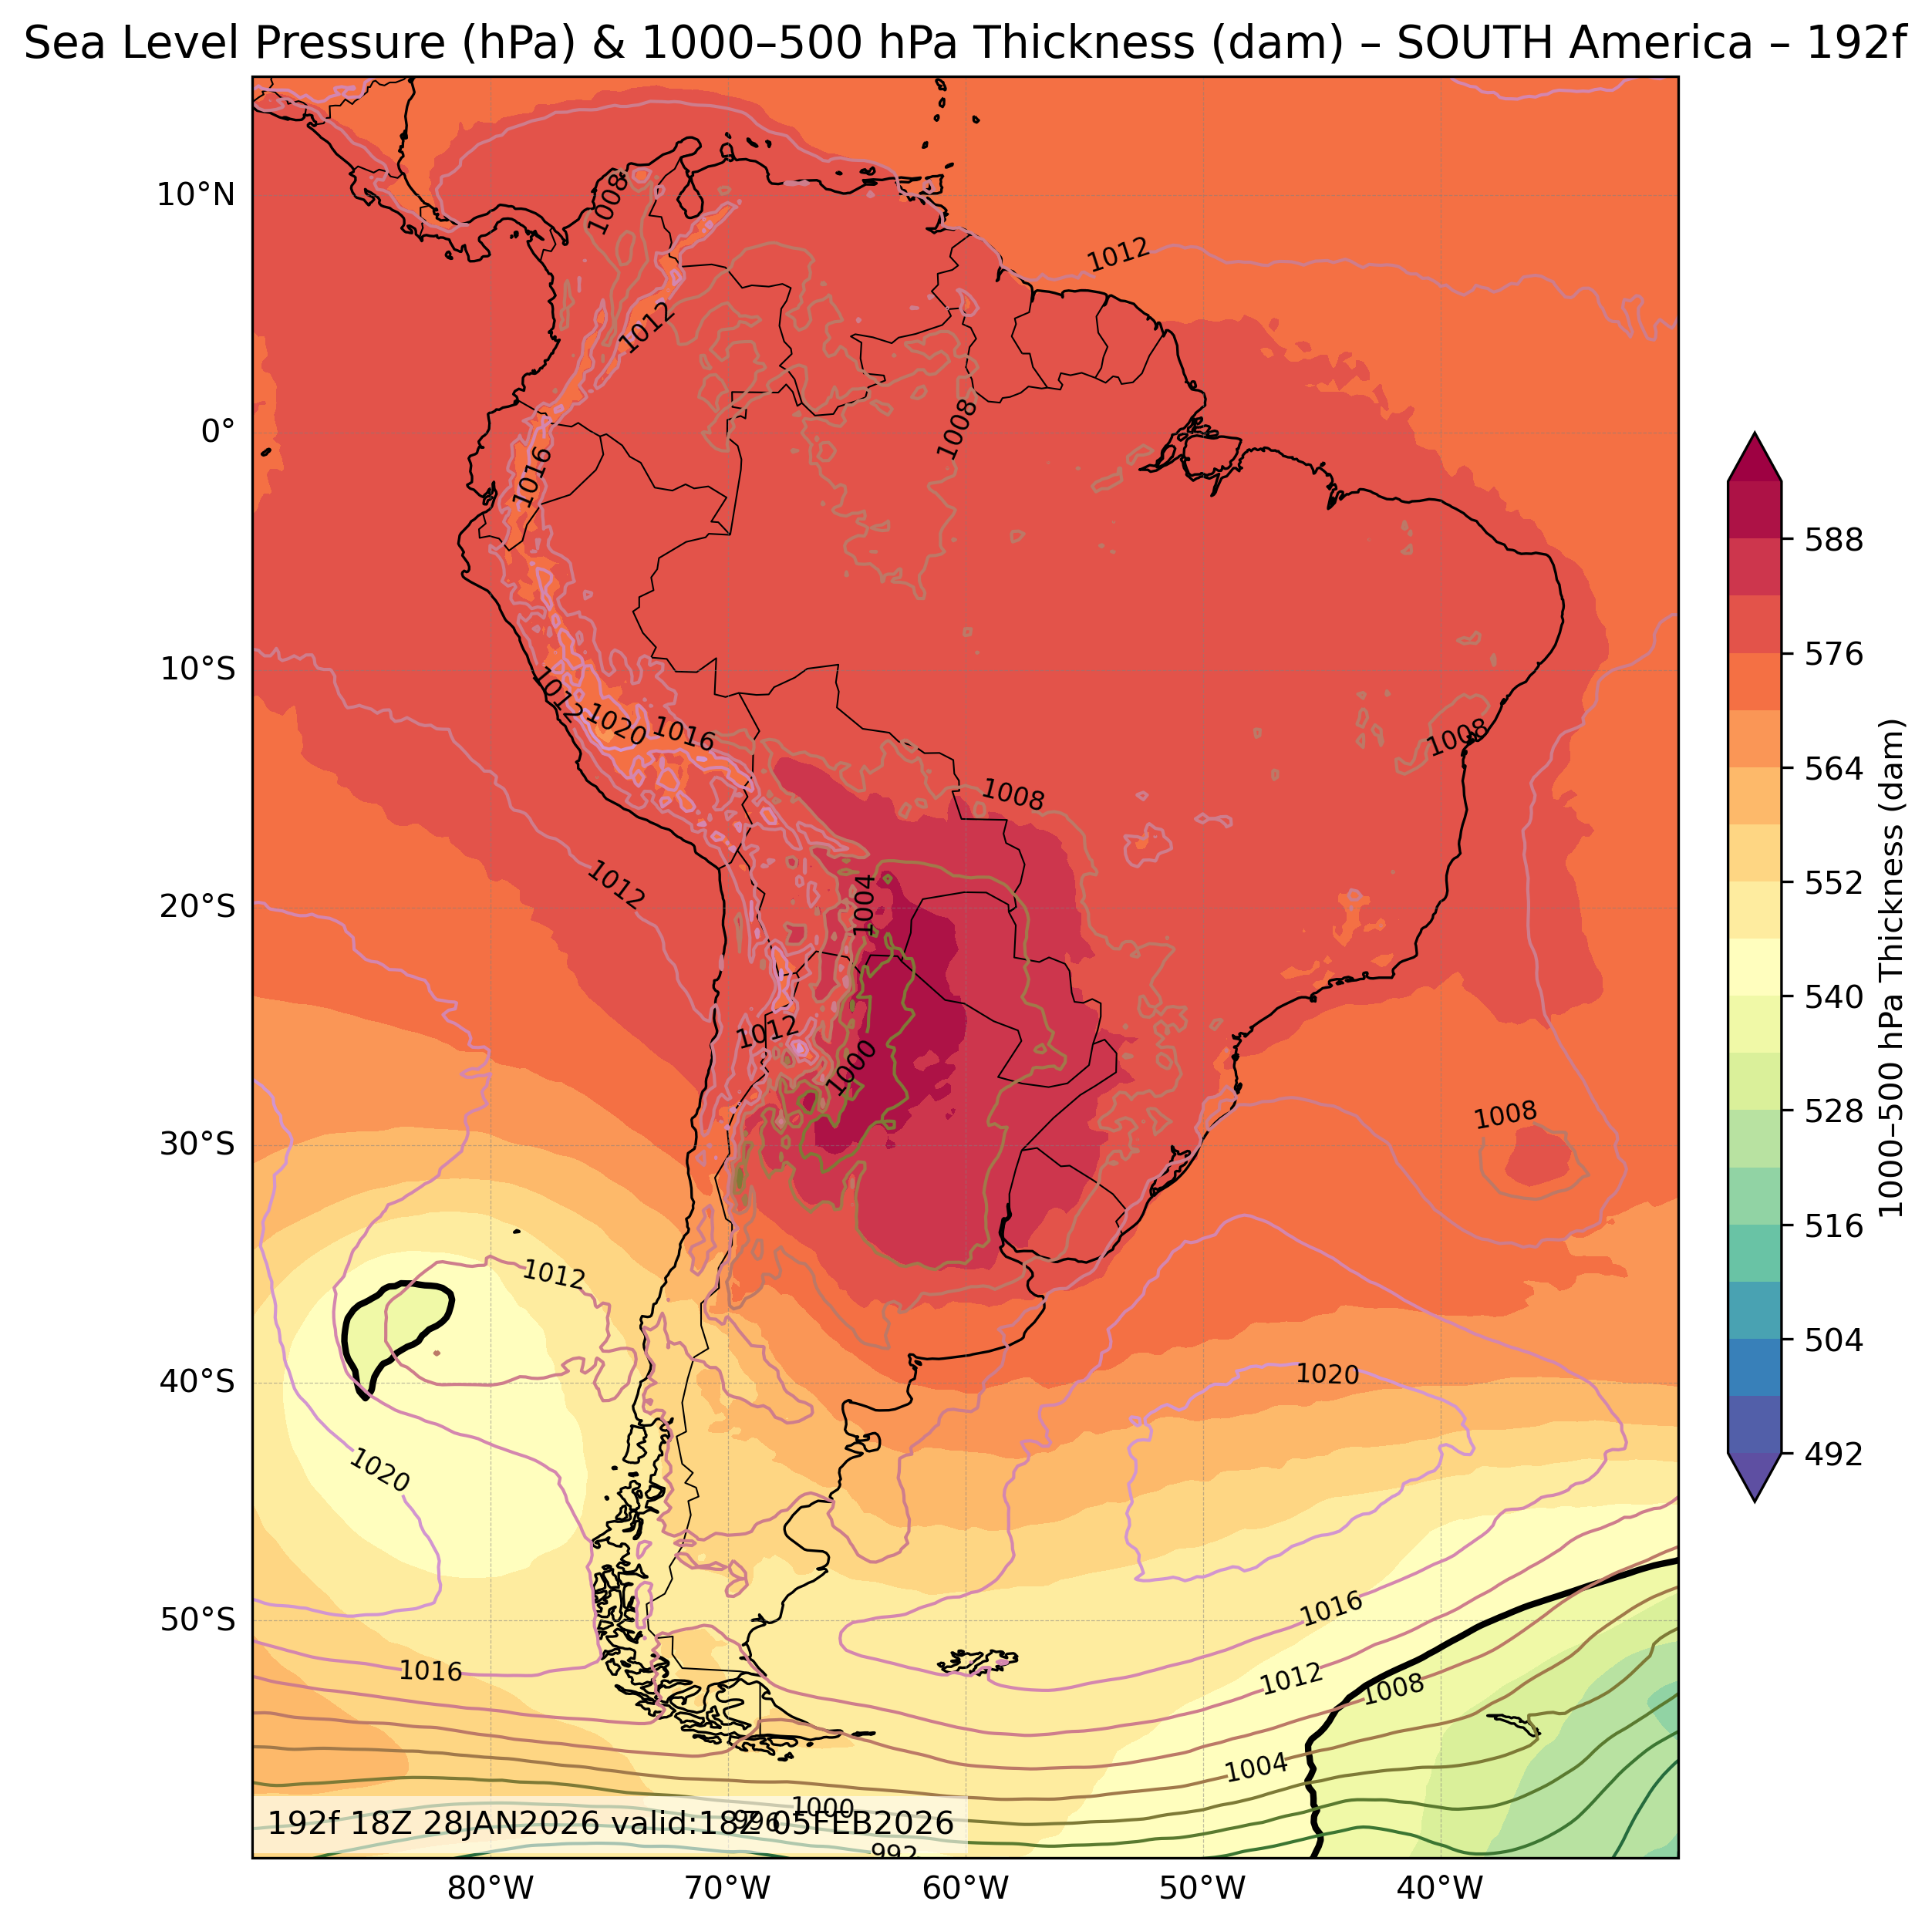
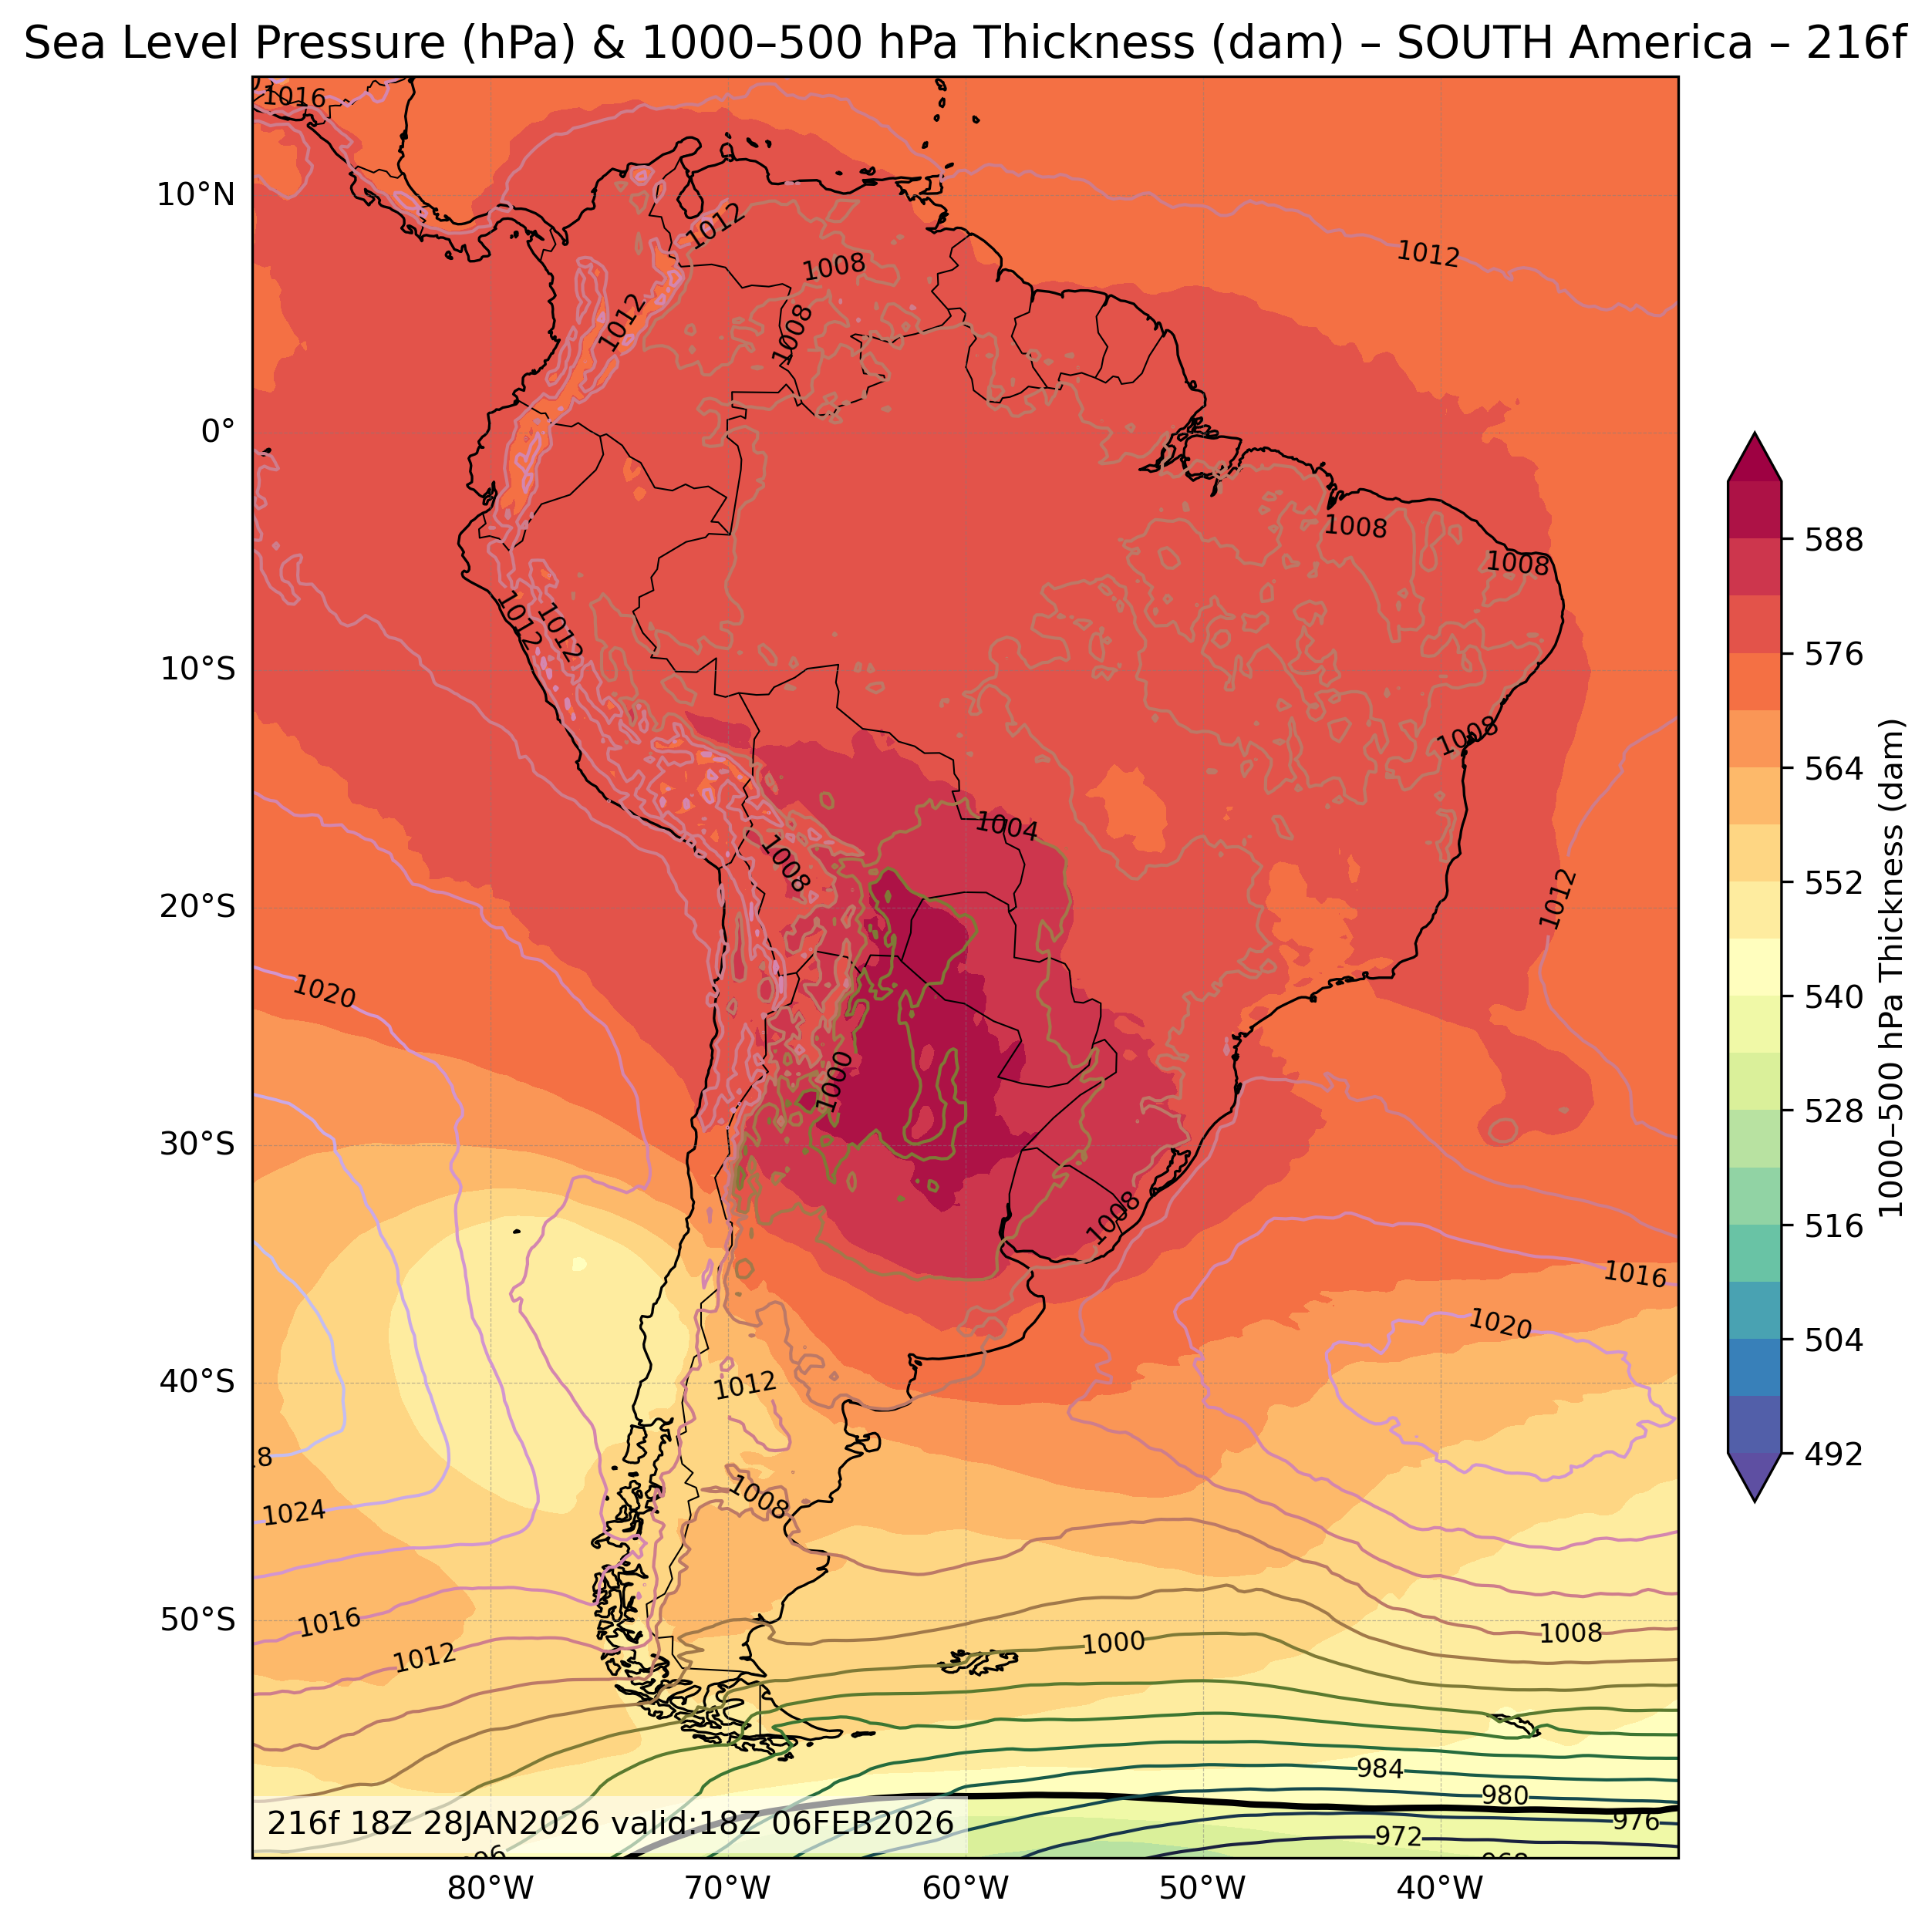
| Sea Level Pressure & 1000-500mb Thickness |
All Times |
🔍 | 🔍 | 🔍 | 🔍 | 🔍 |
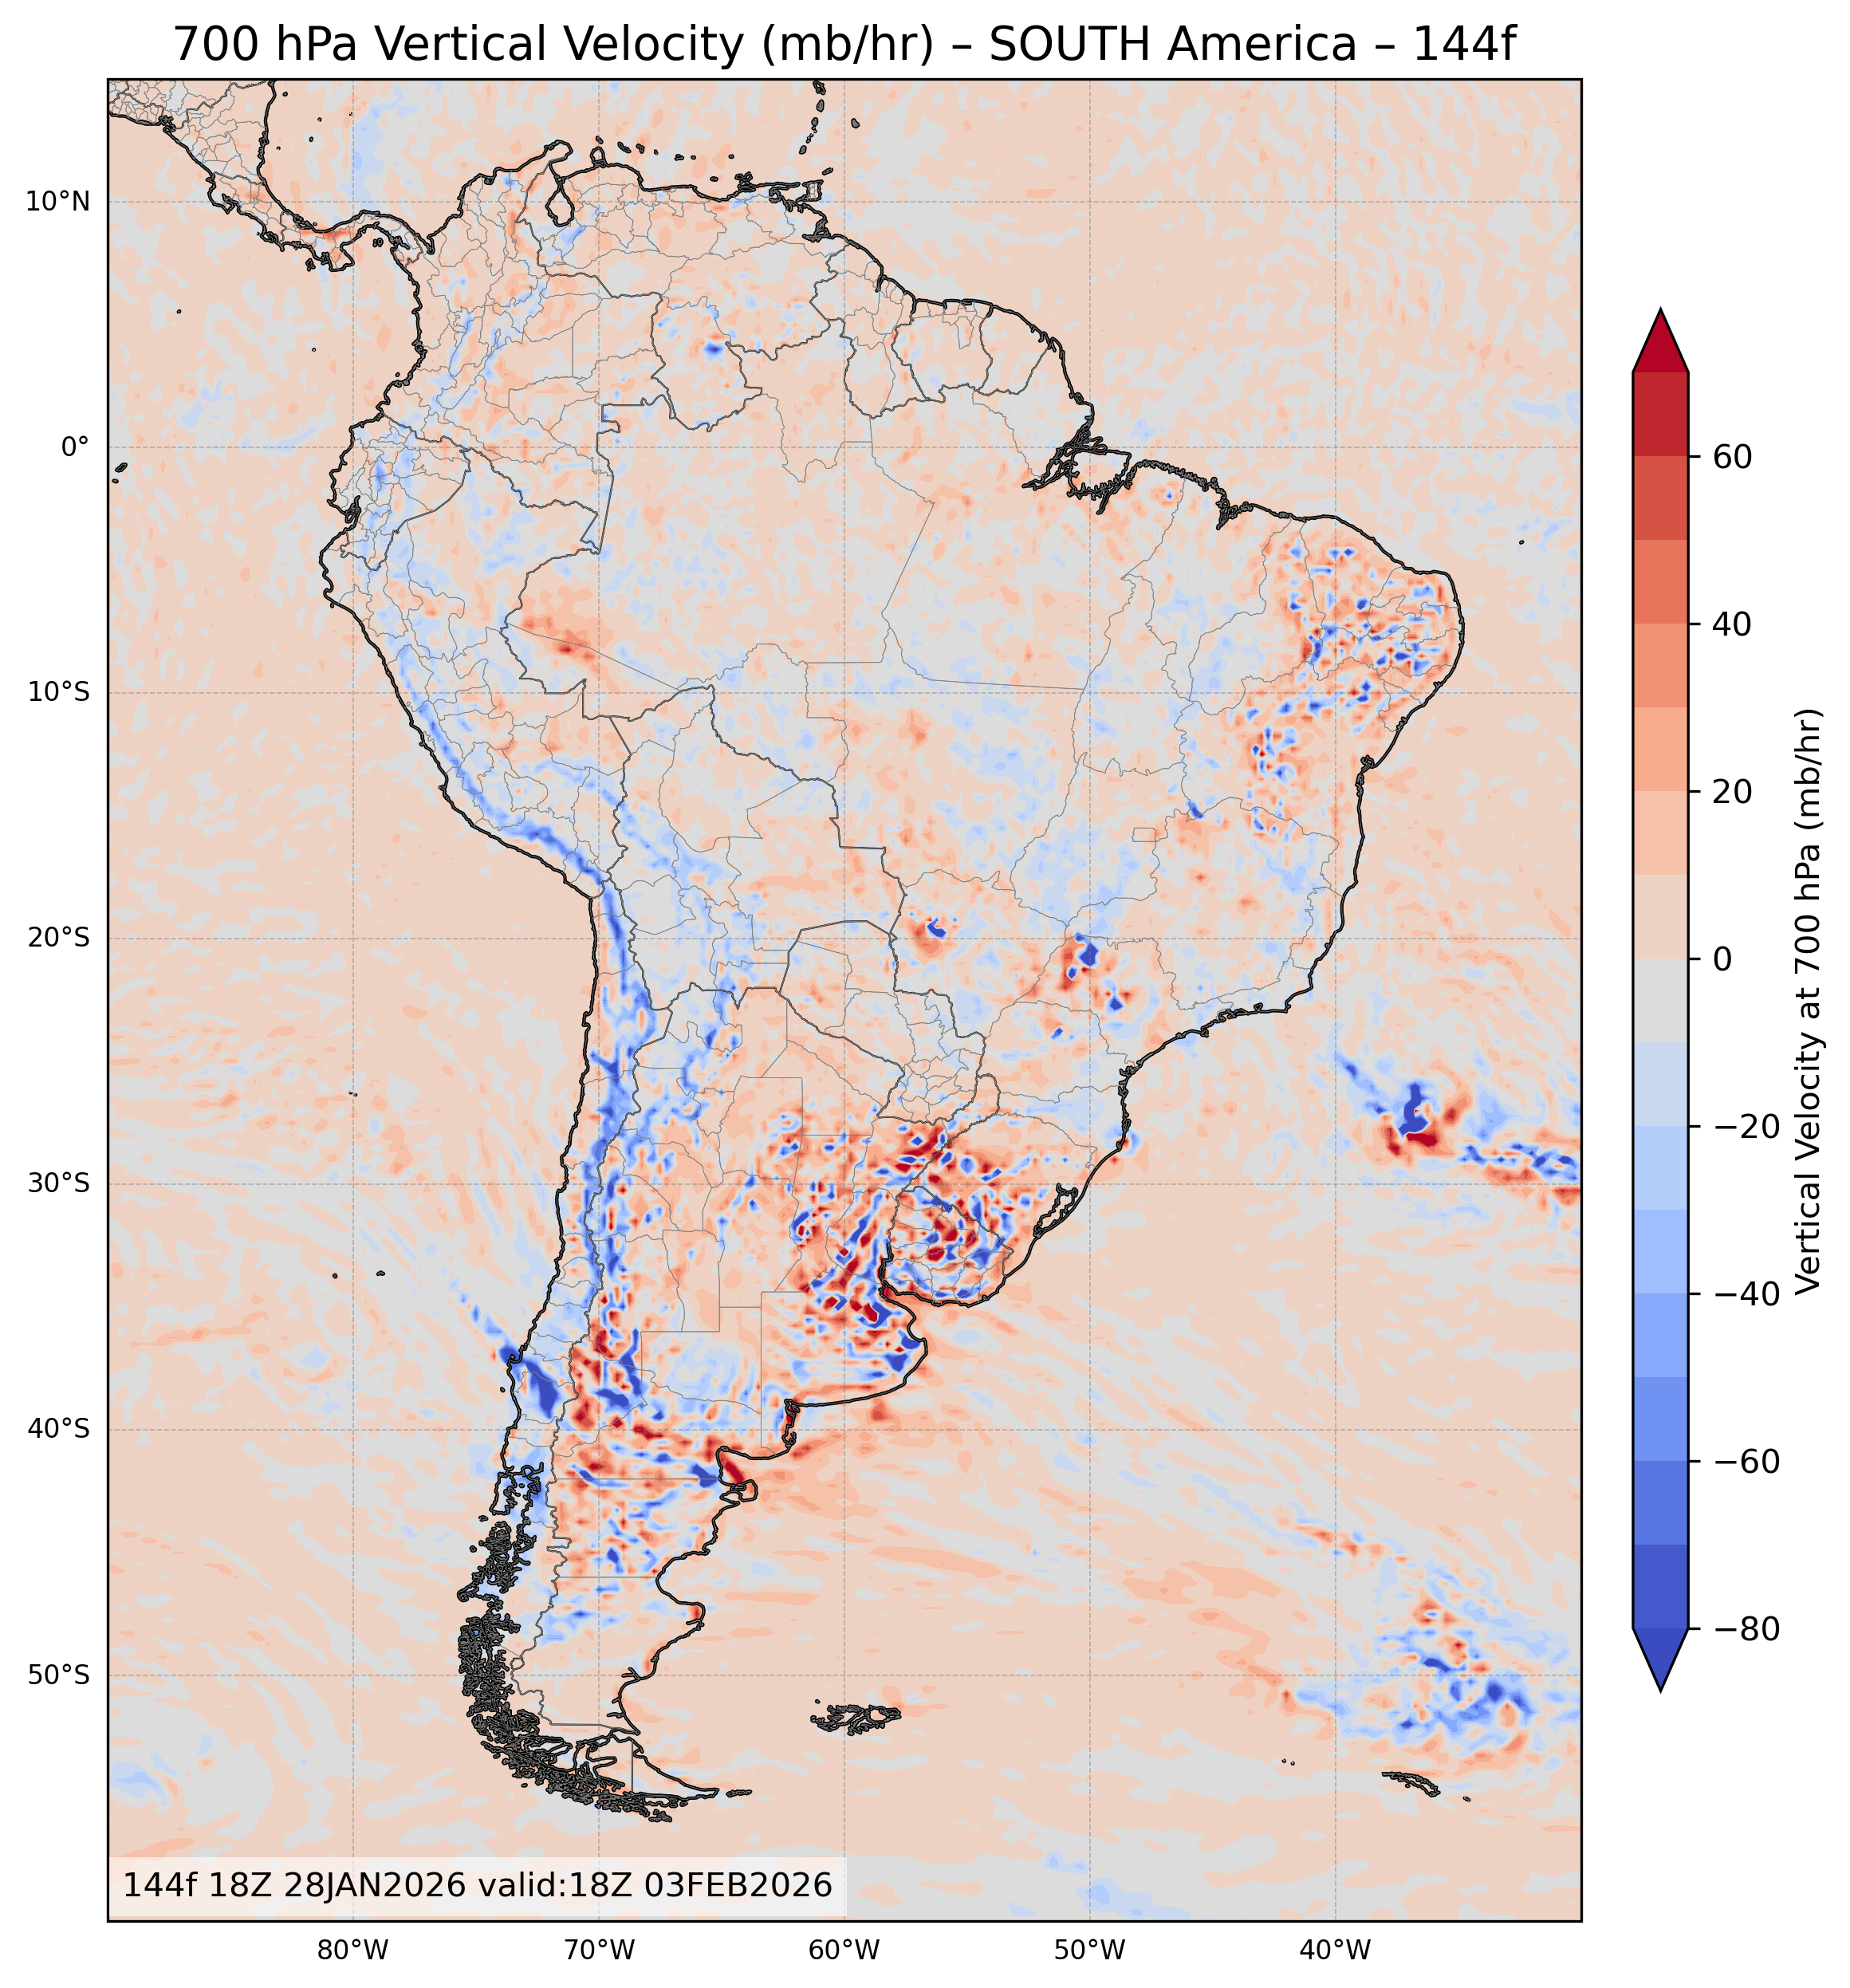
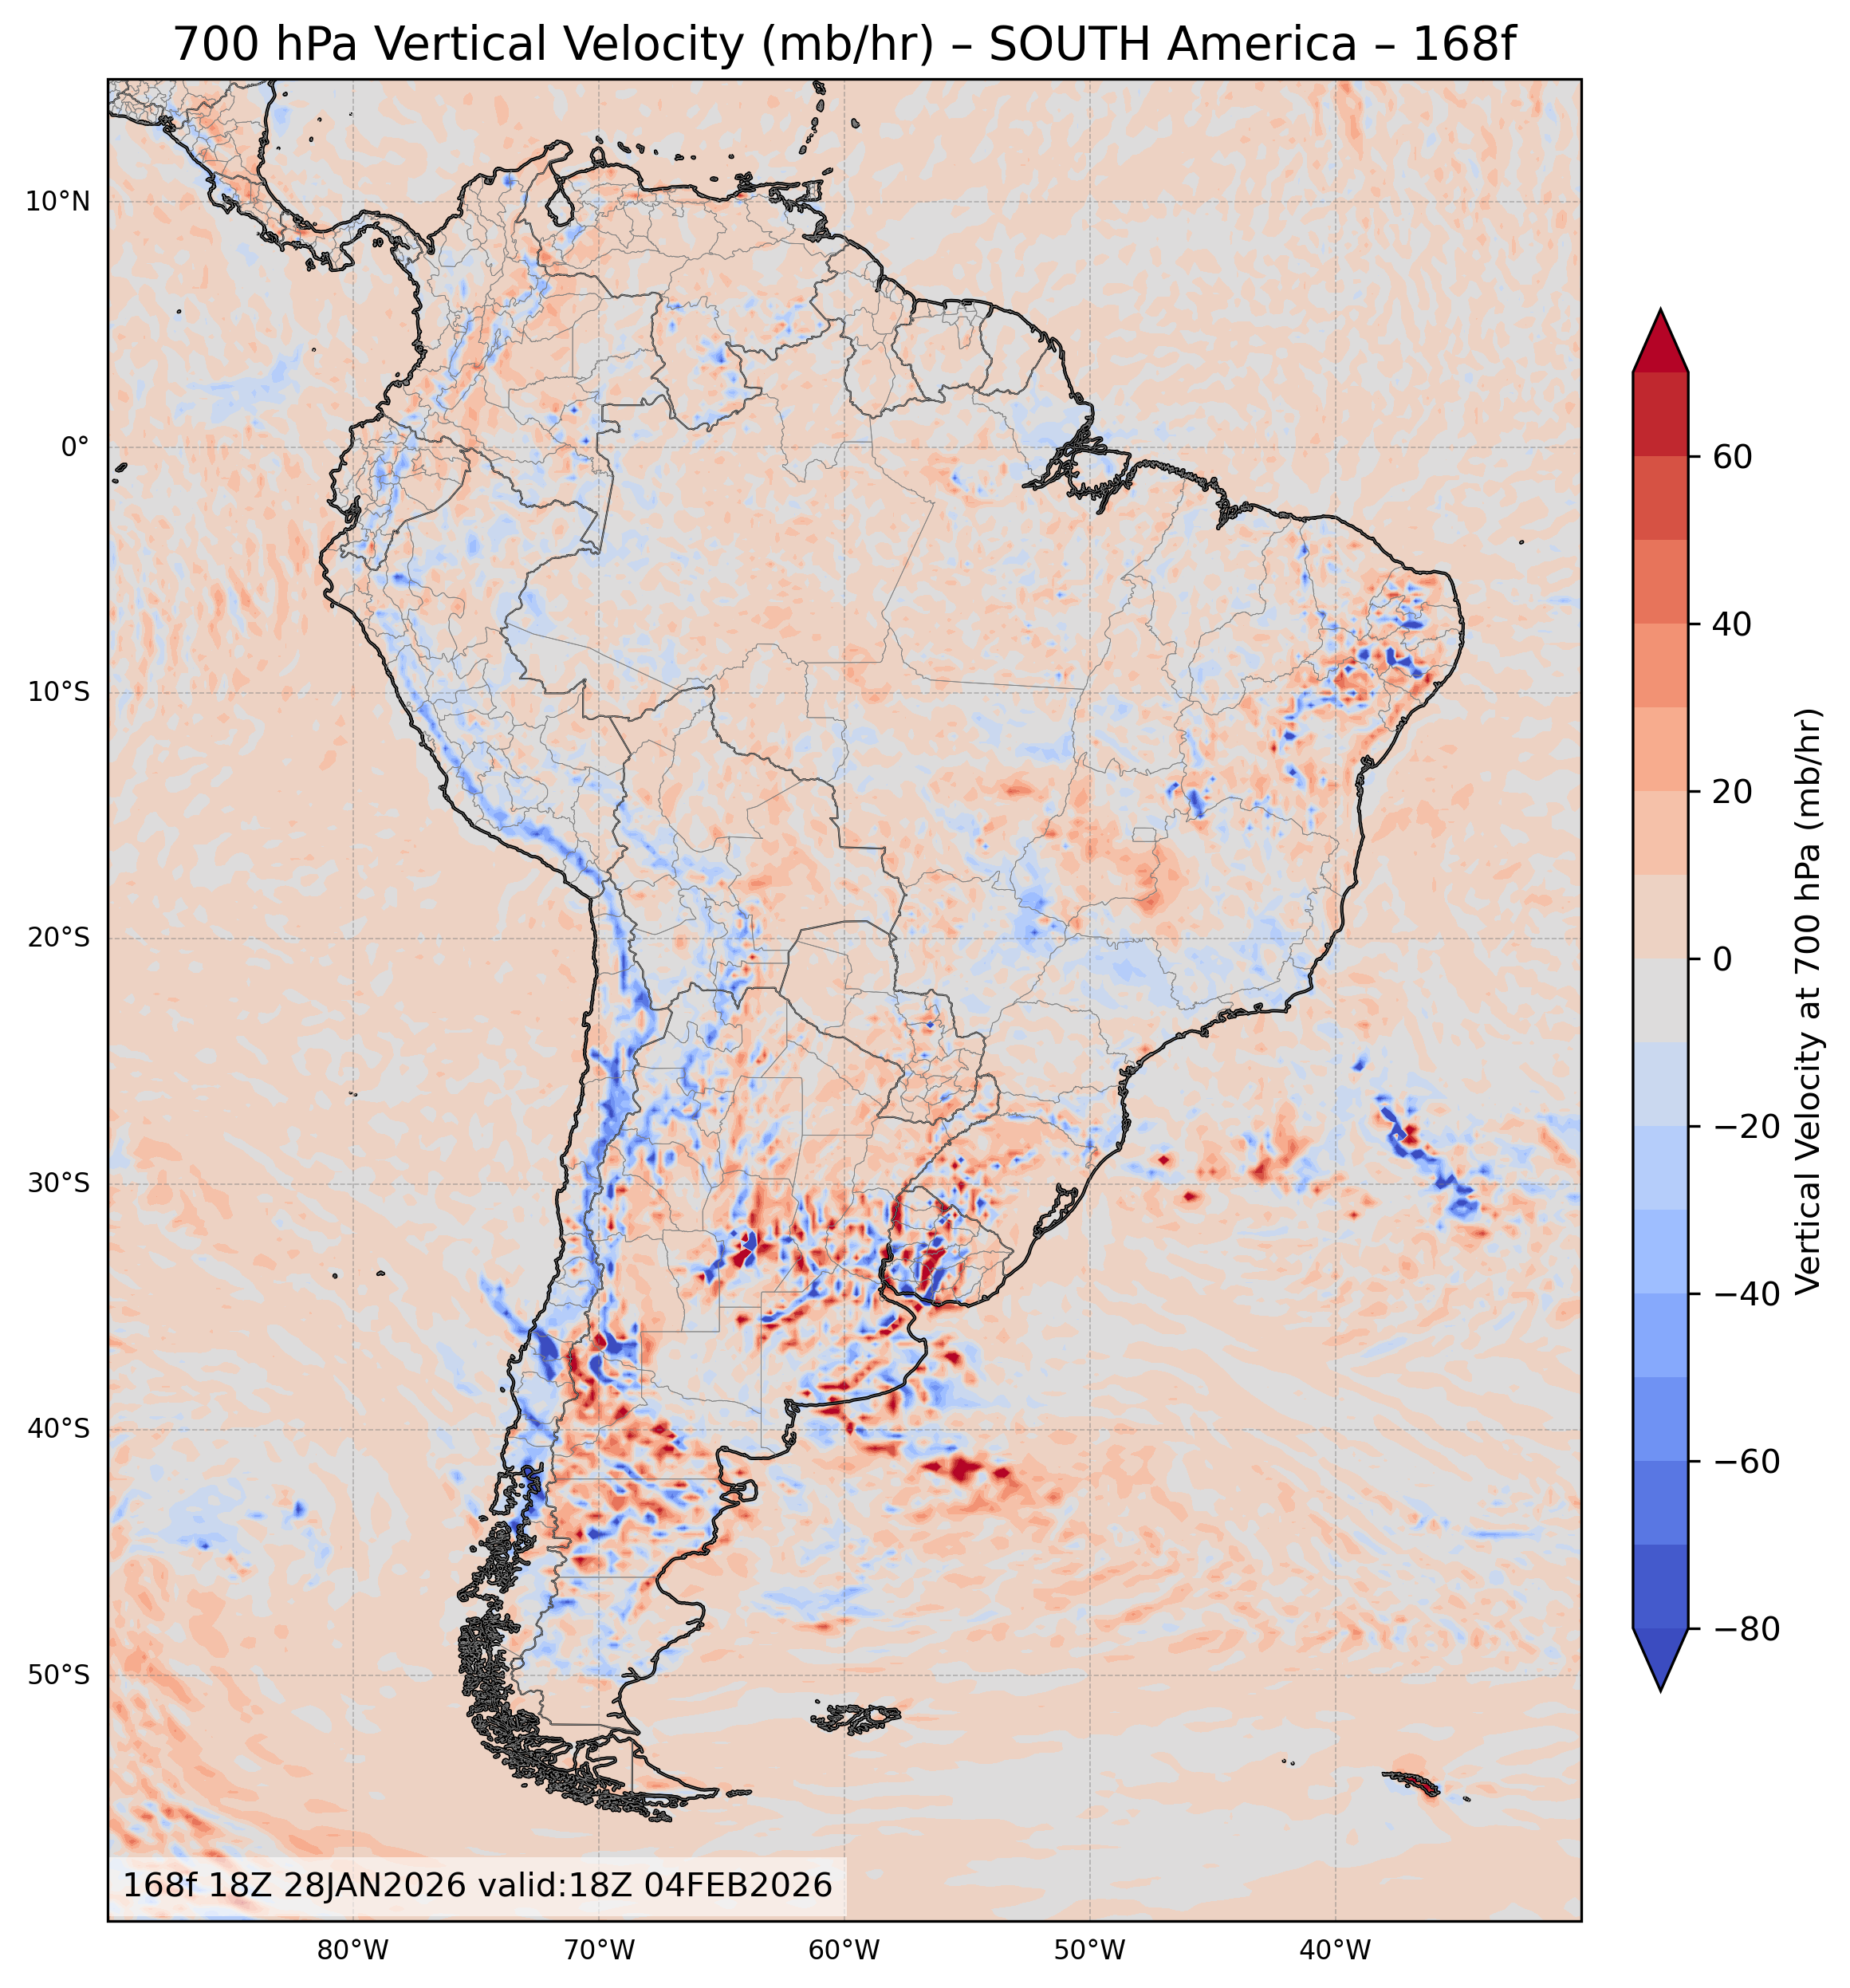
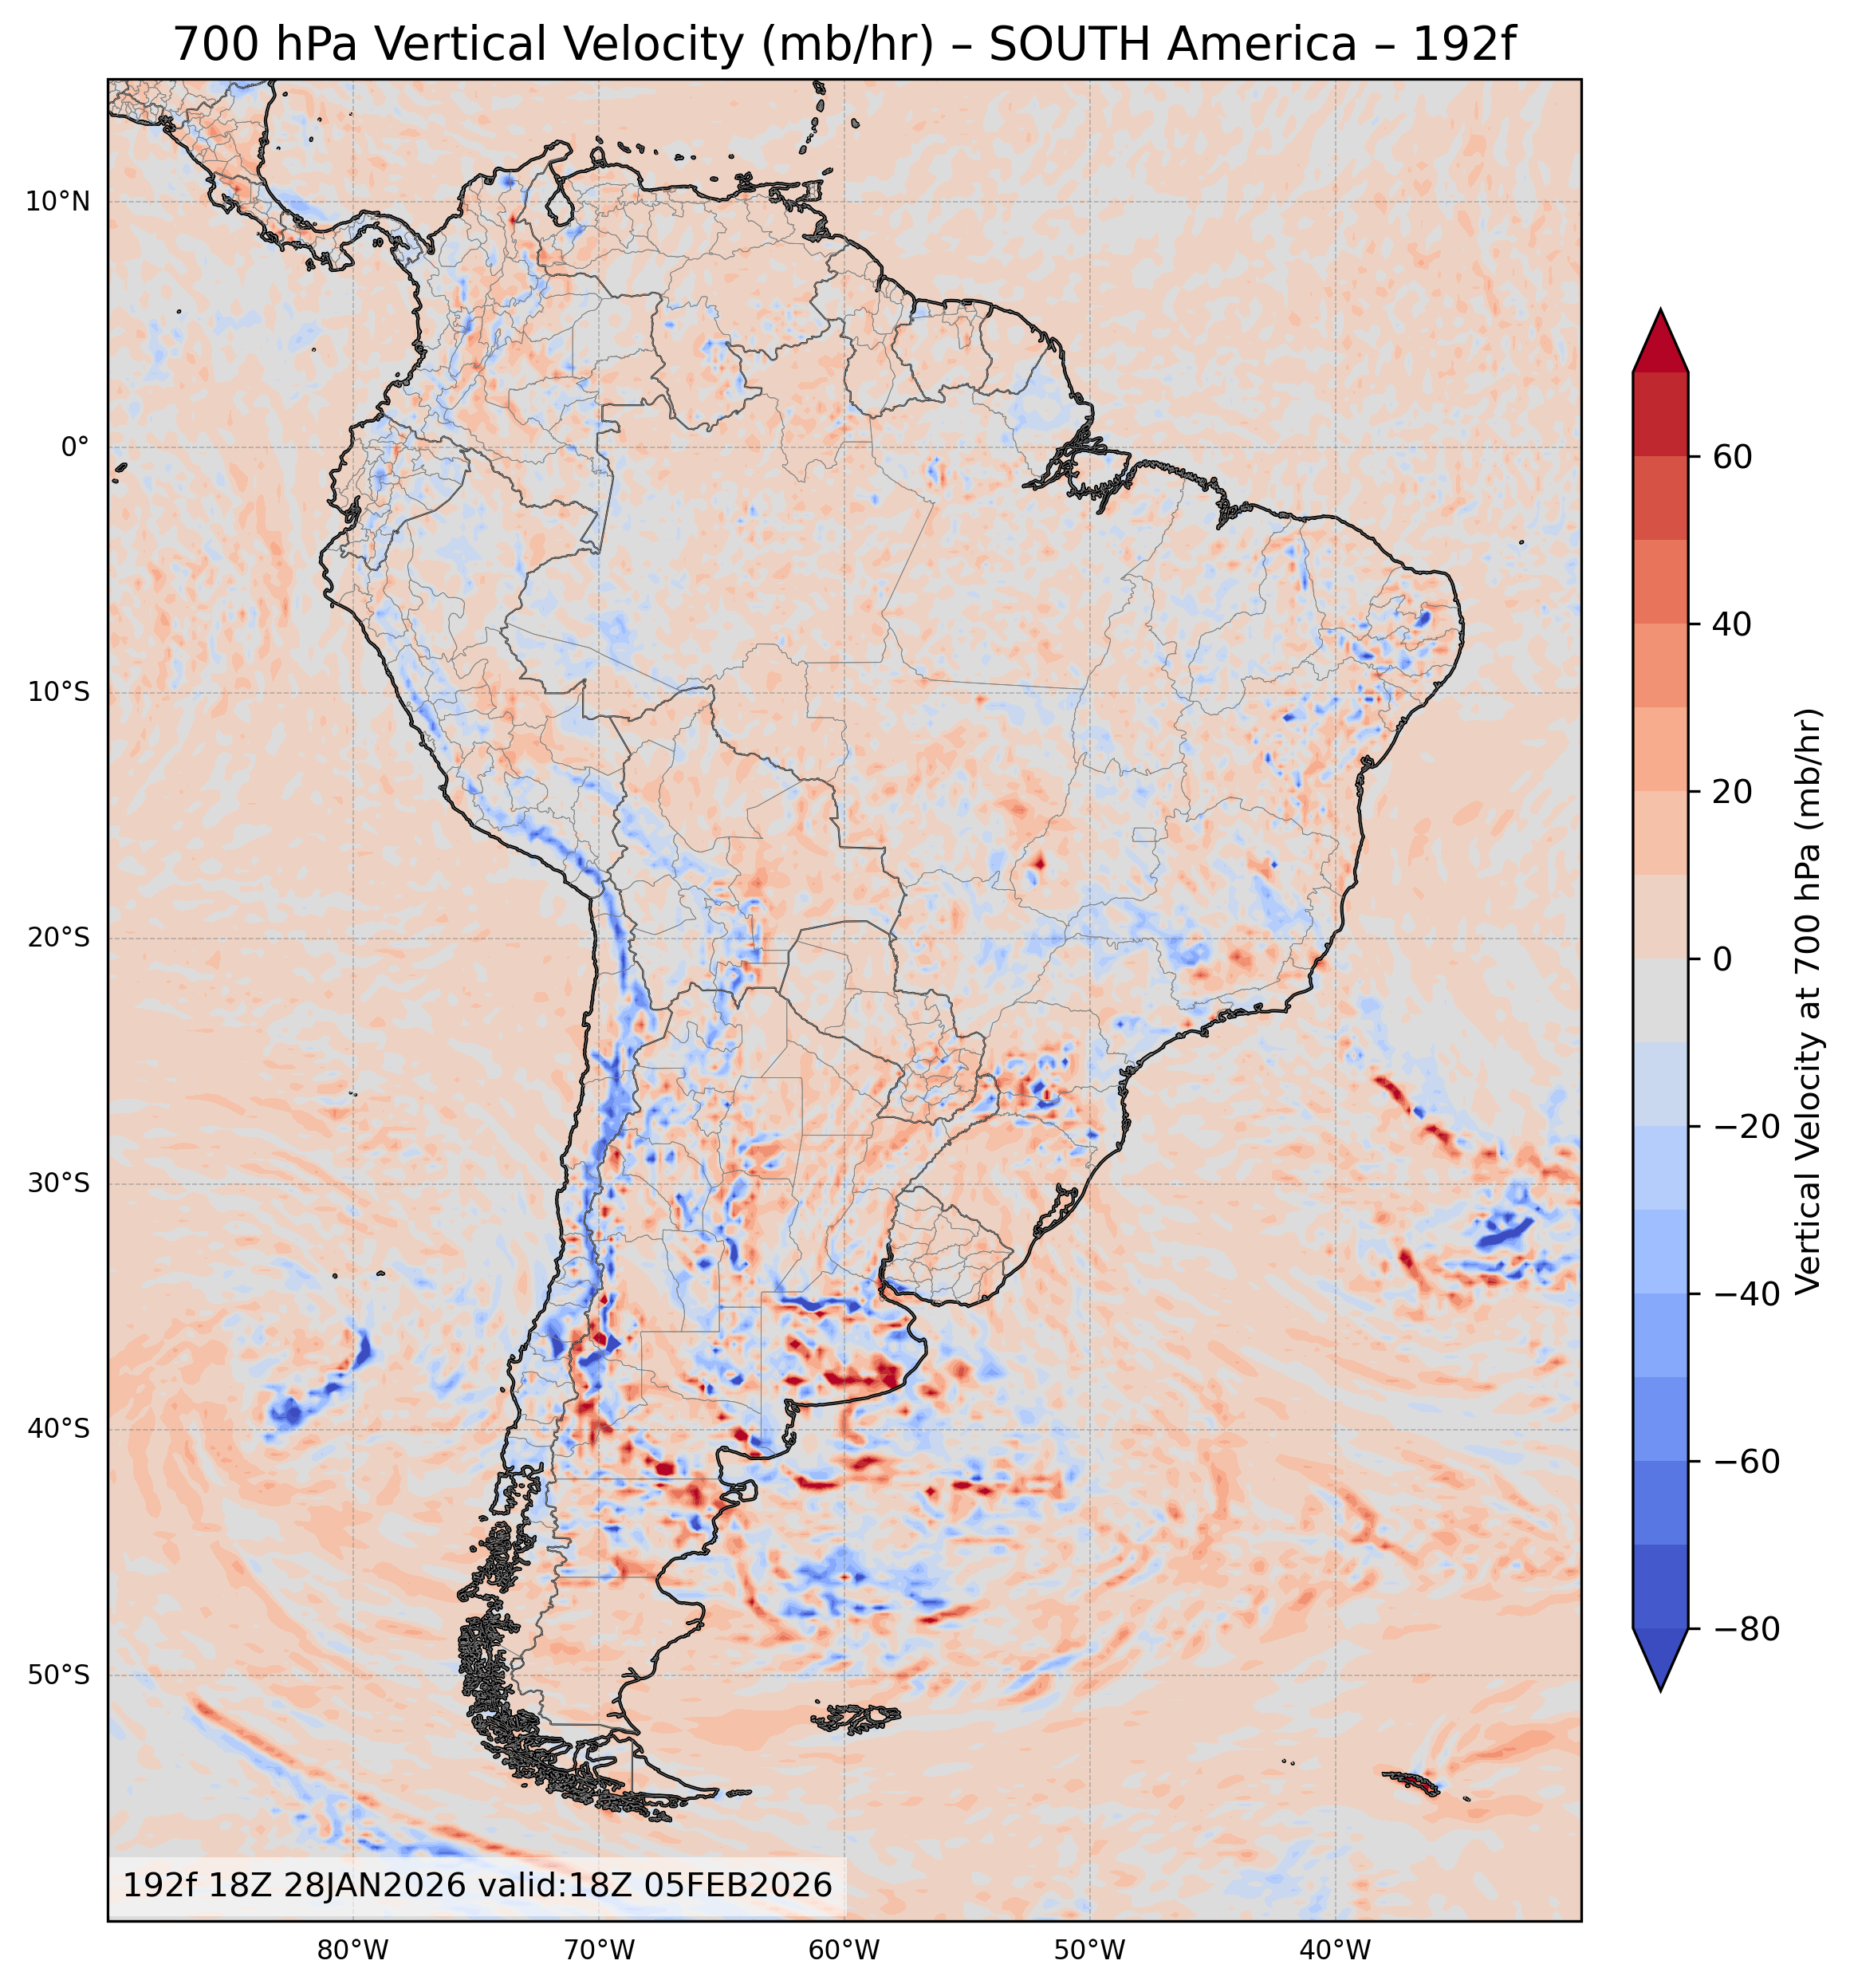
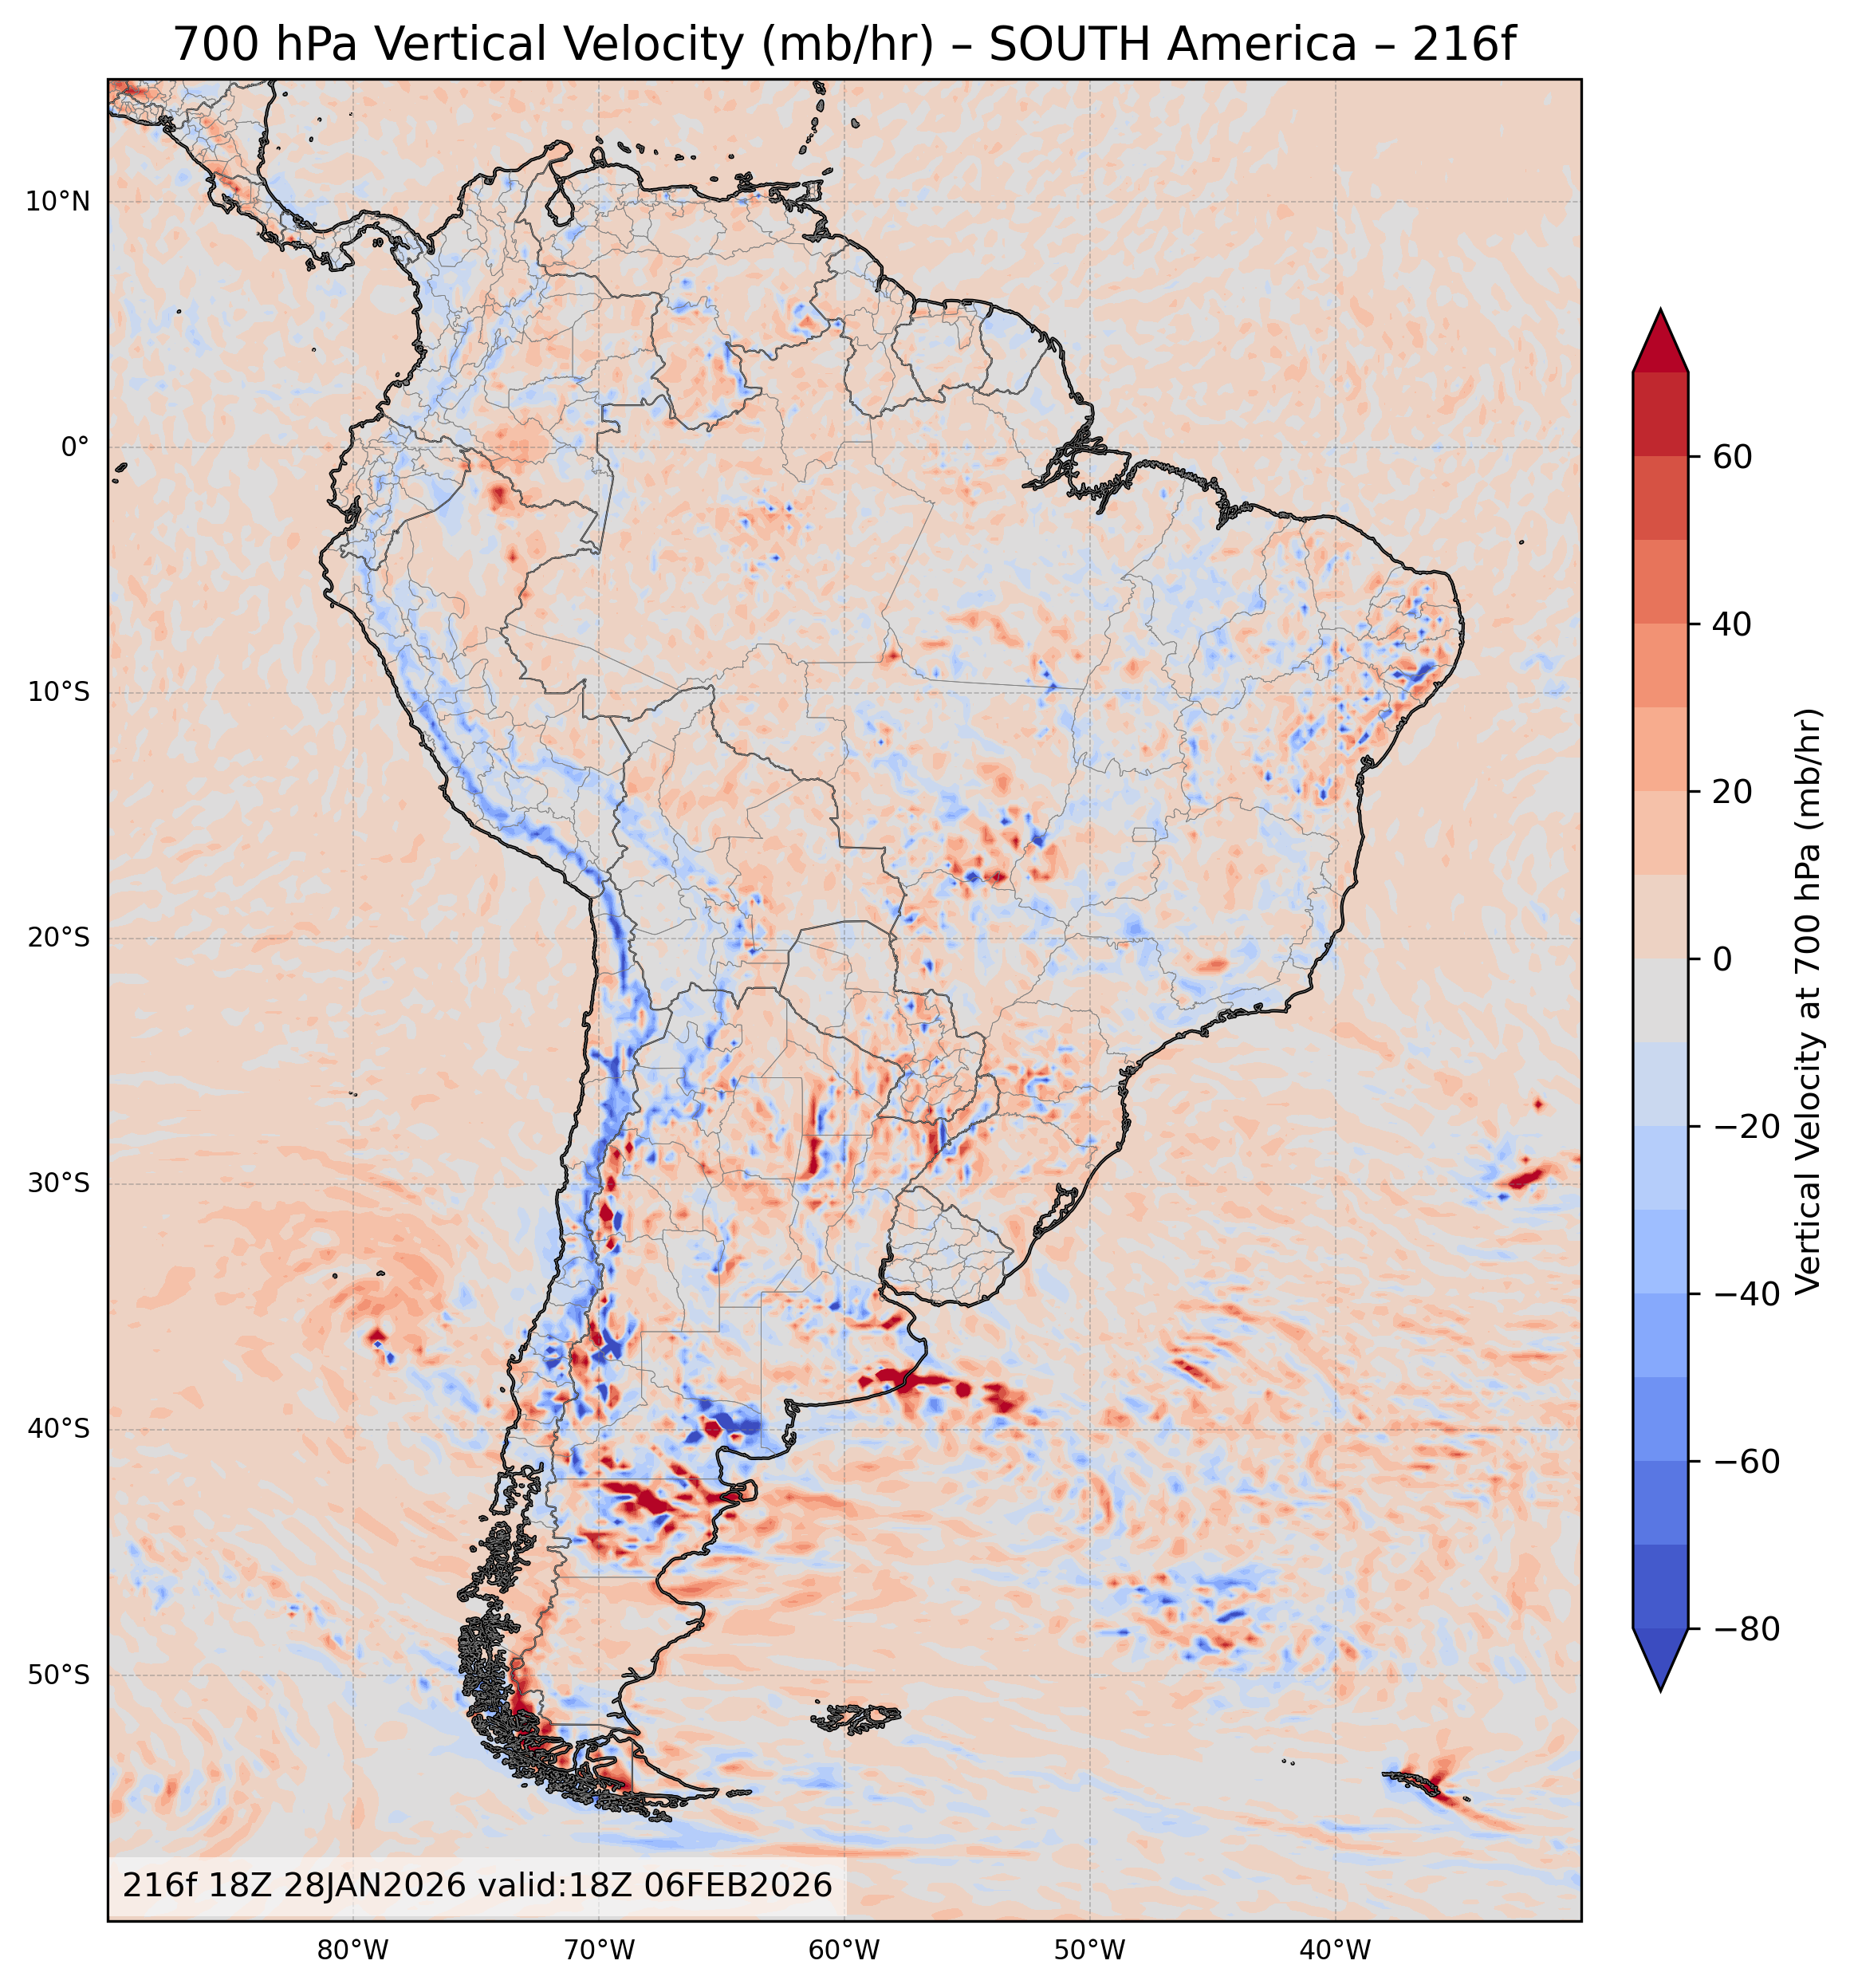
| 700 mb Vertical Velocity (mb/hr) | All Times |
🔍 | 🔍 | 🔍 | 🔍 | 🔍 |
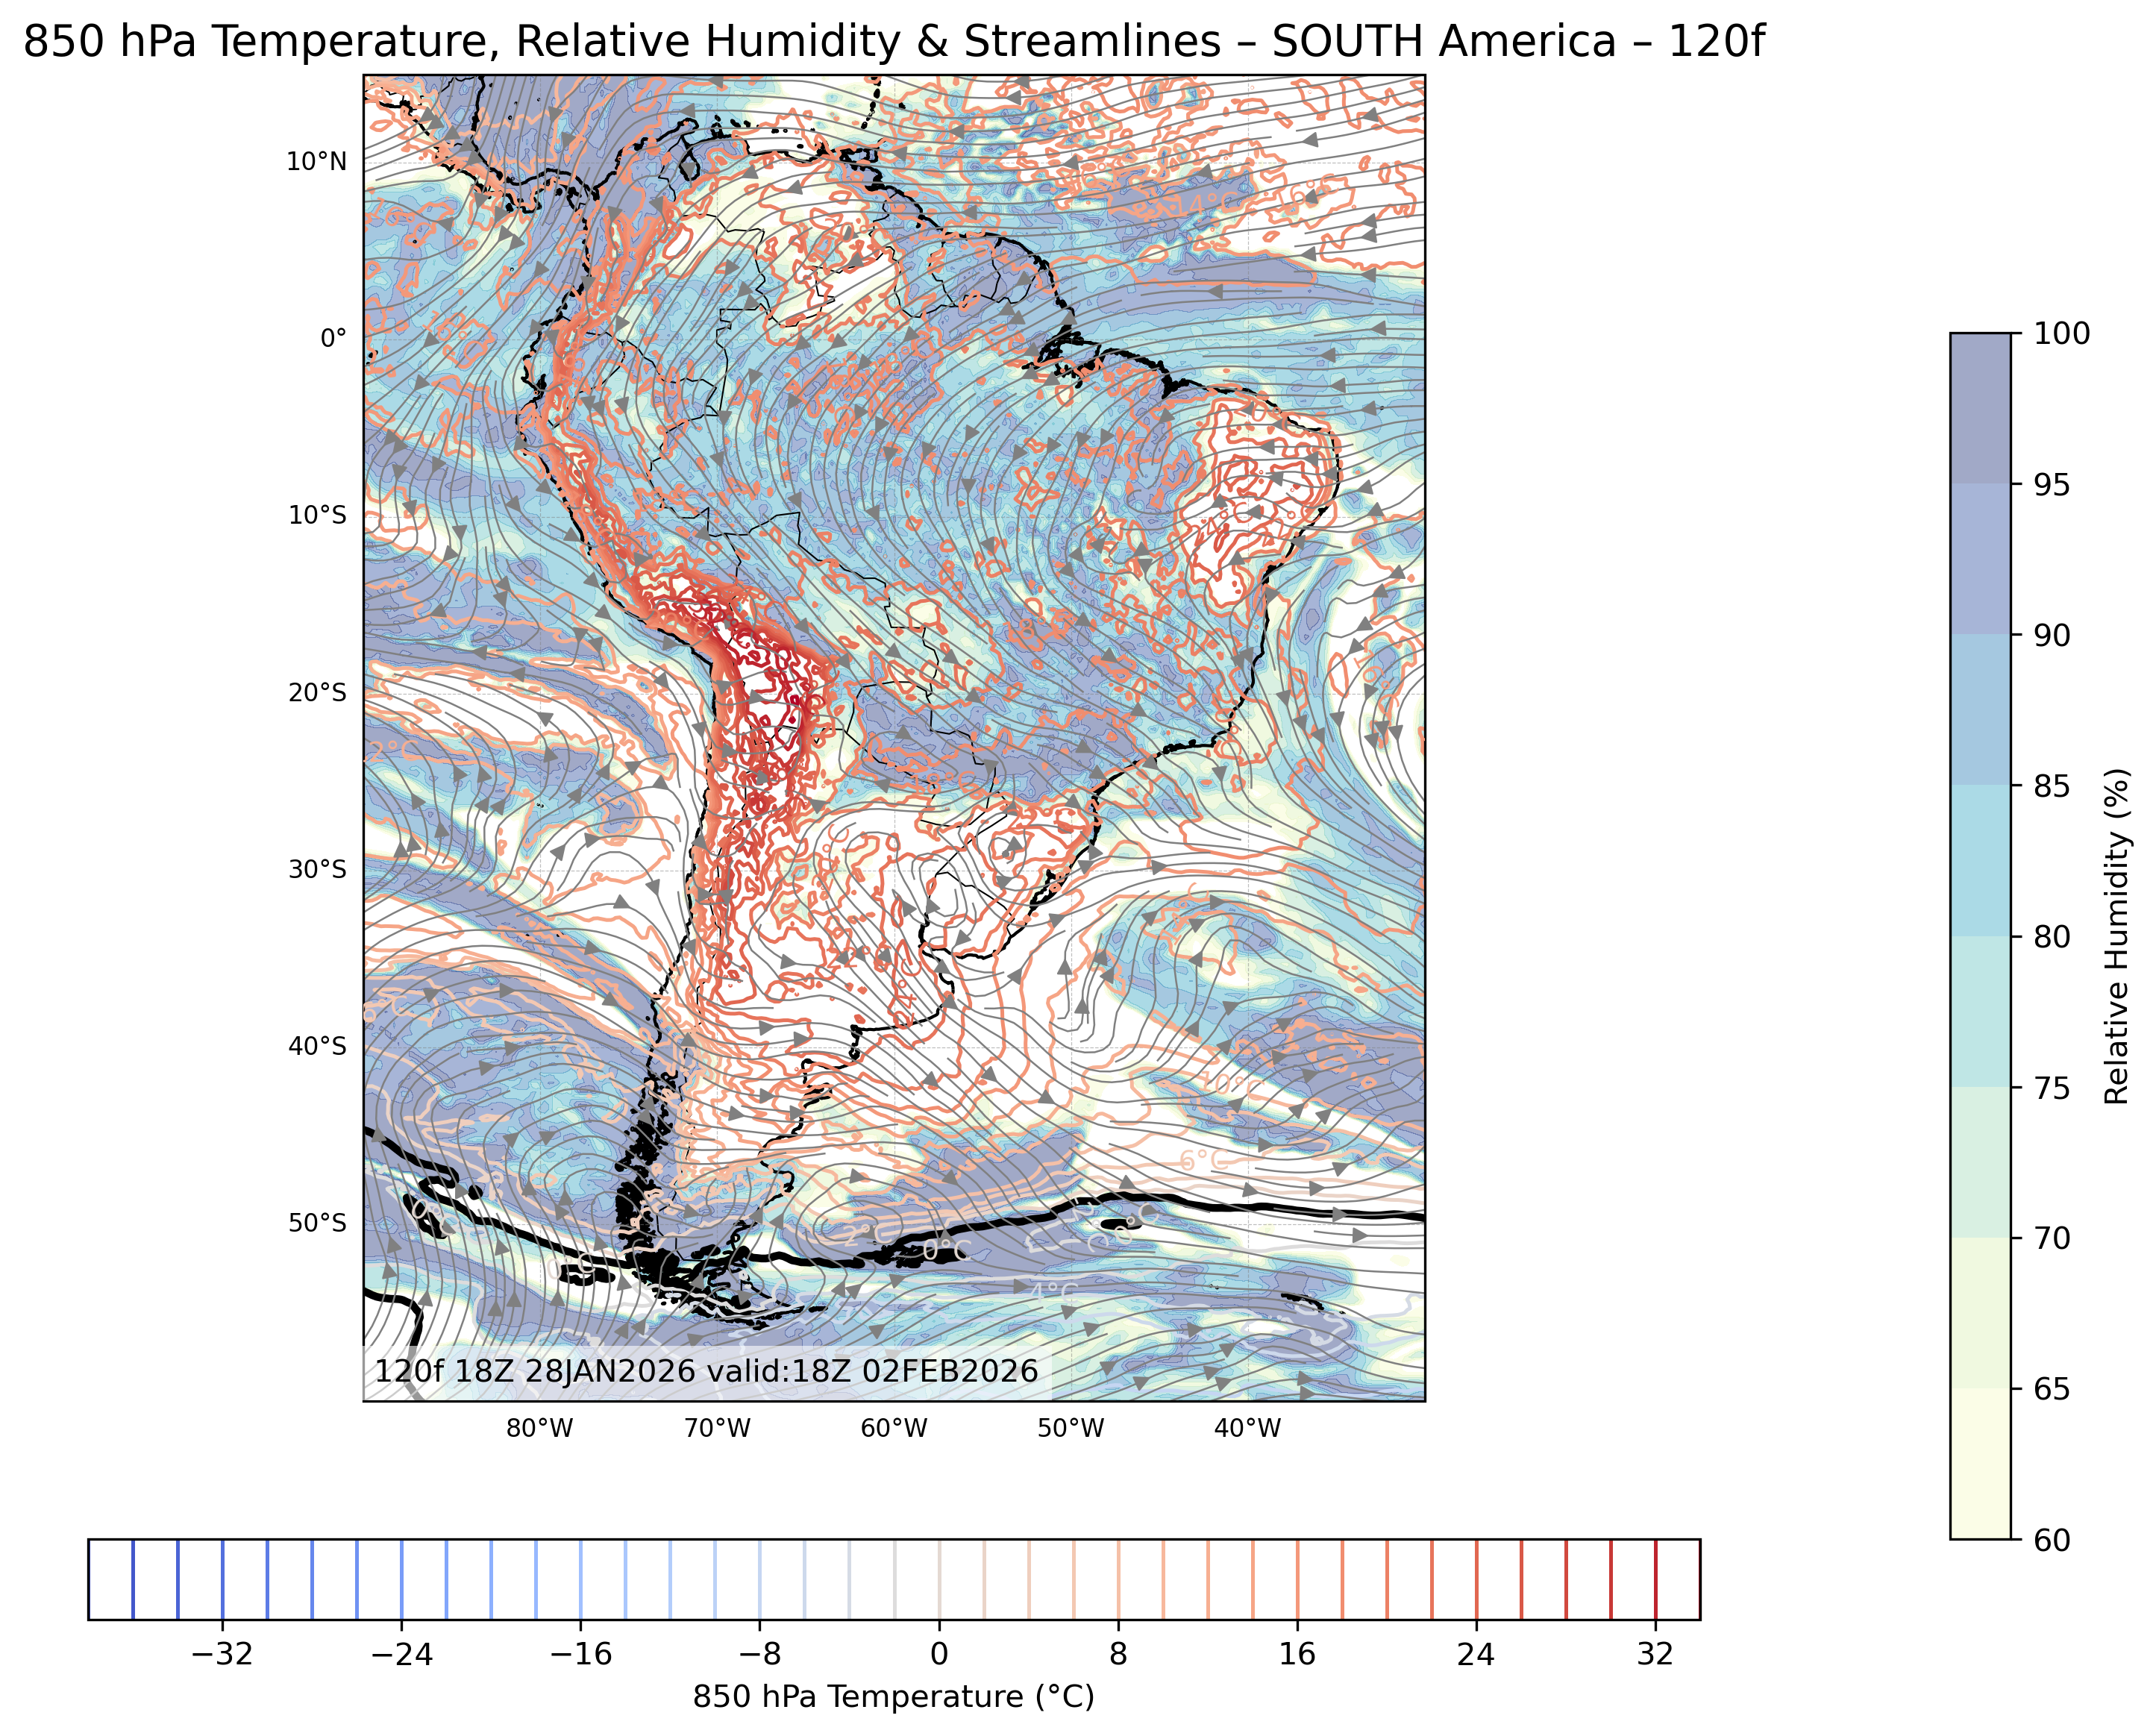
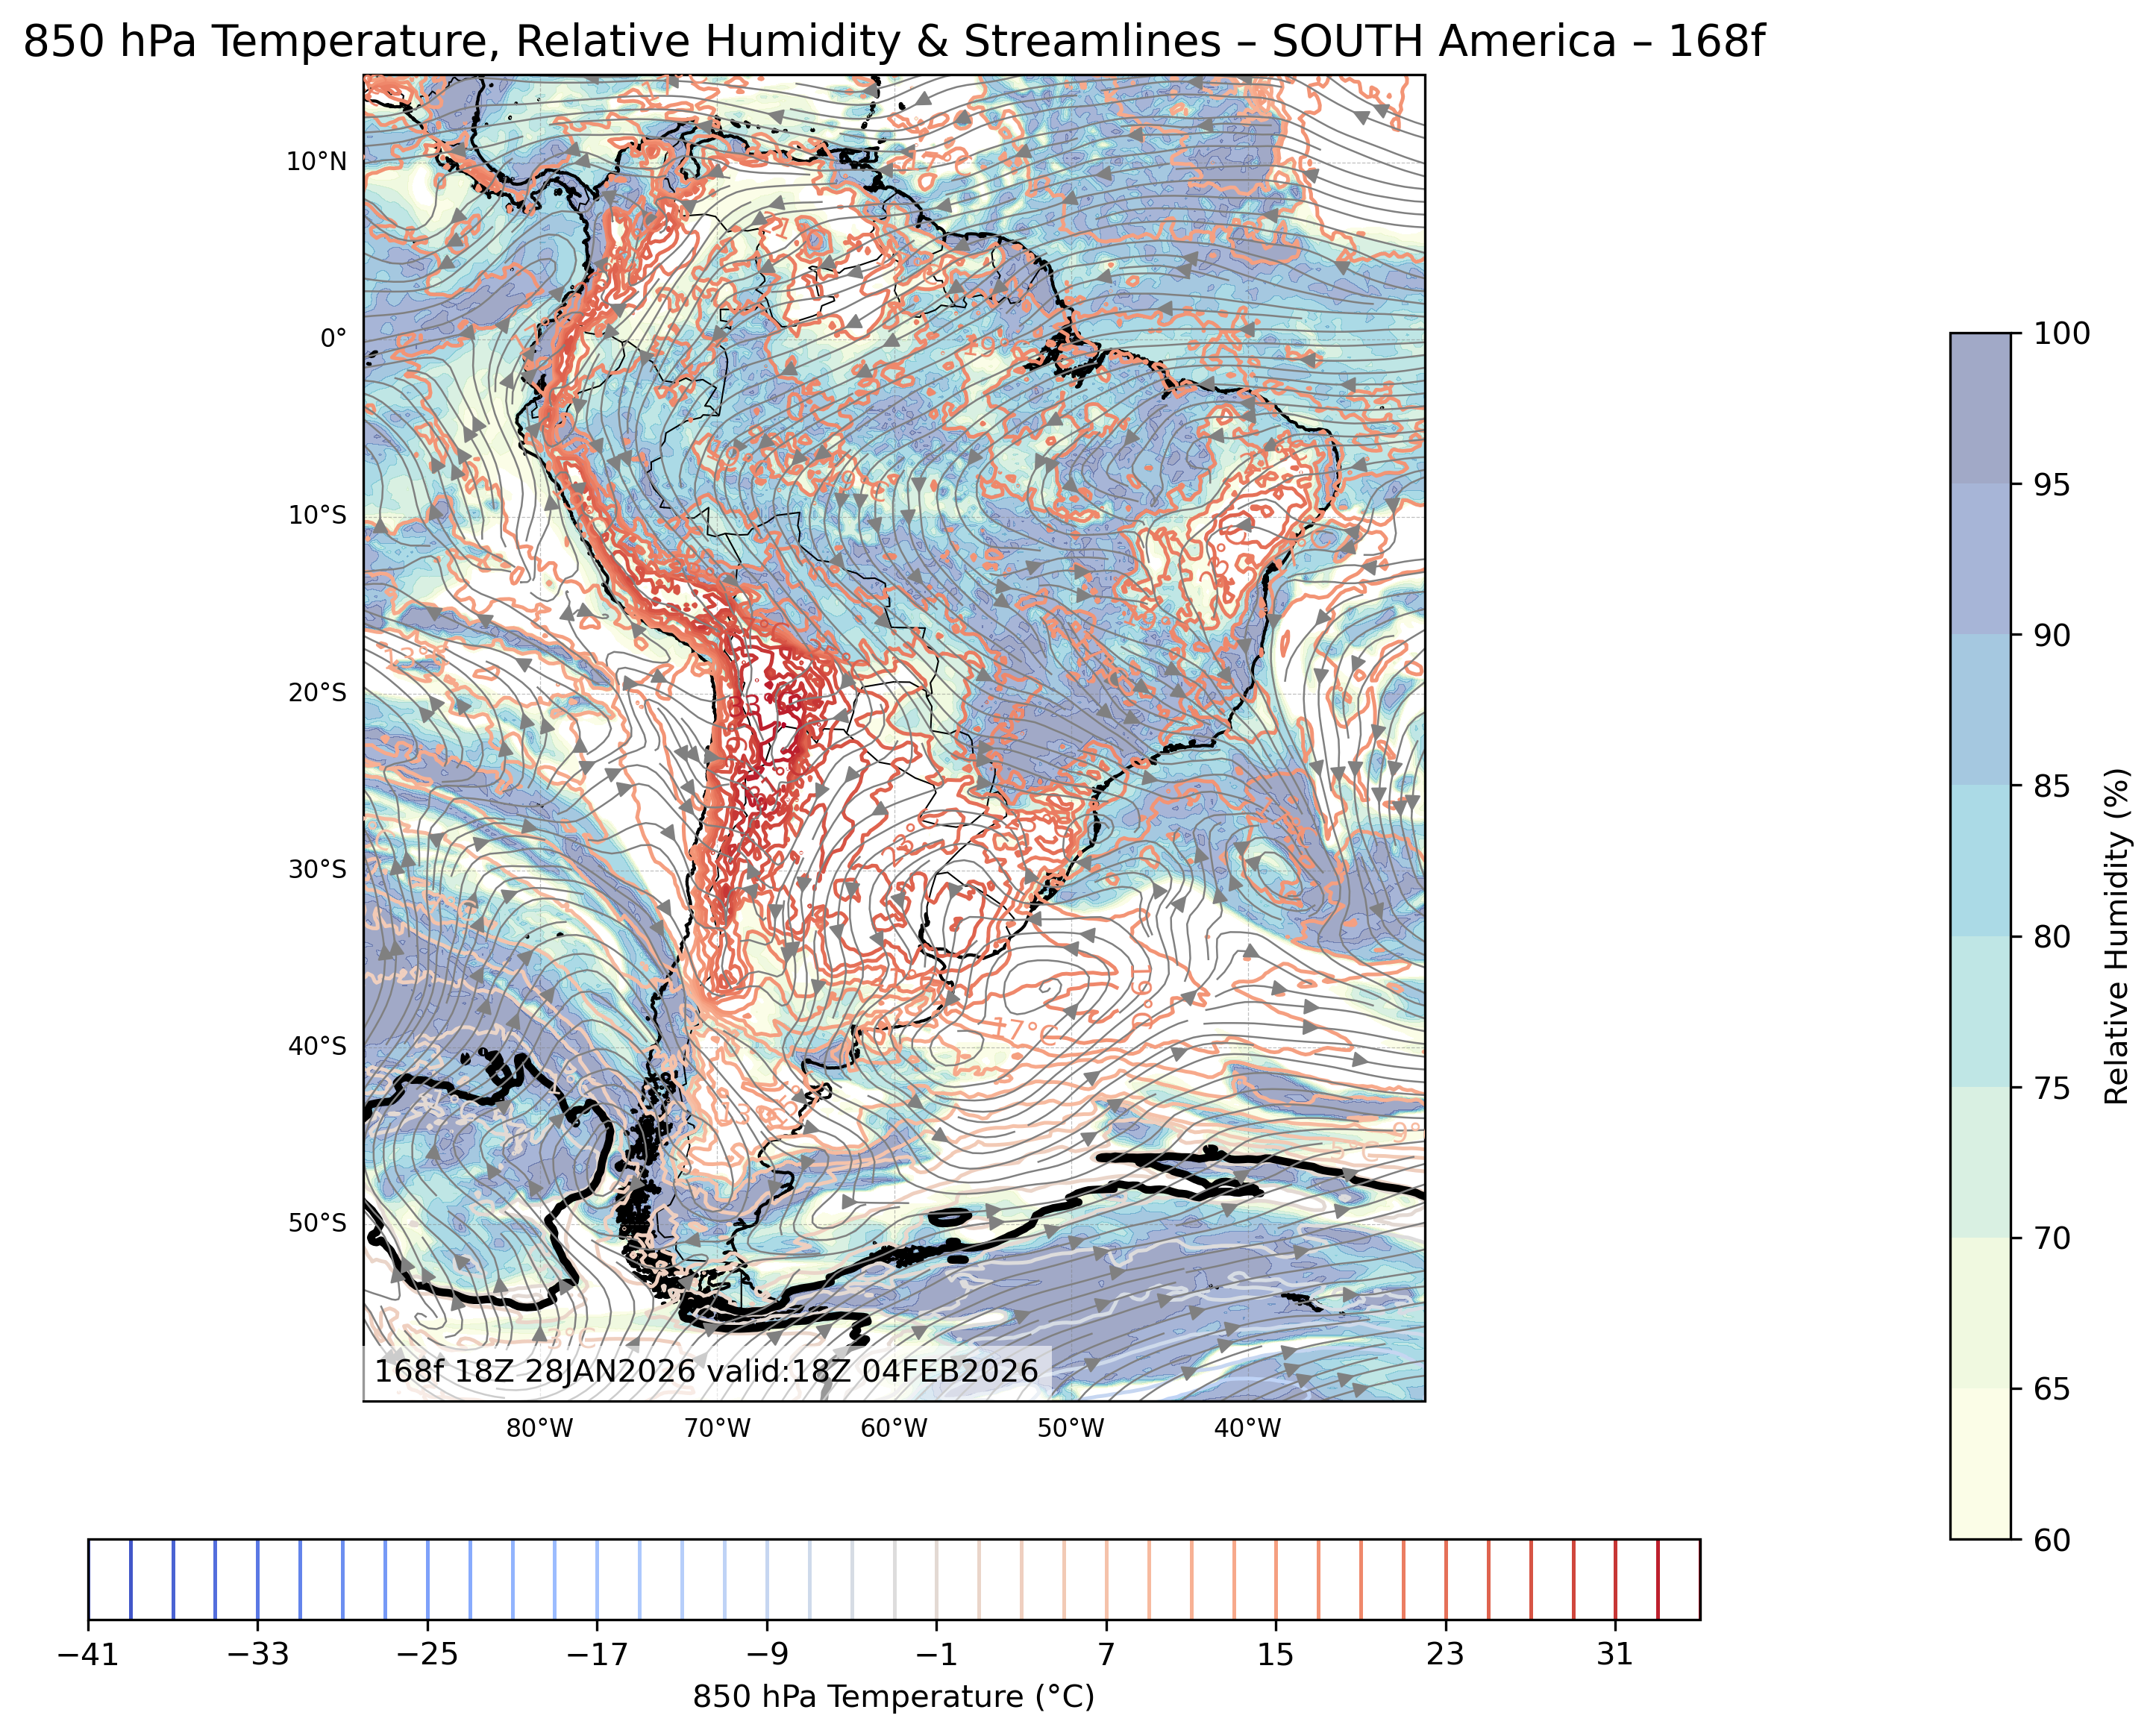
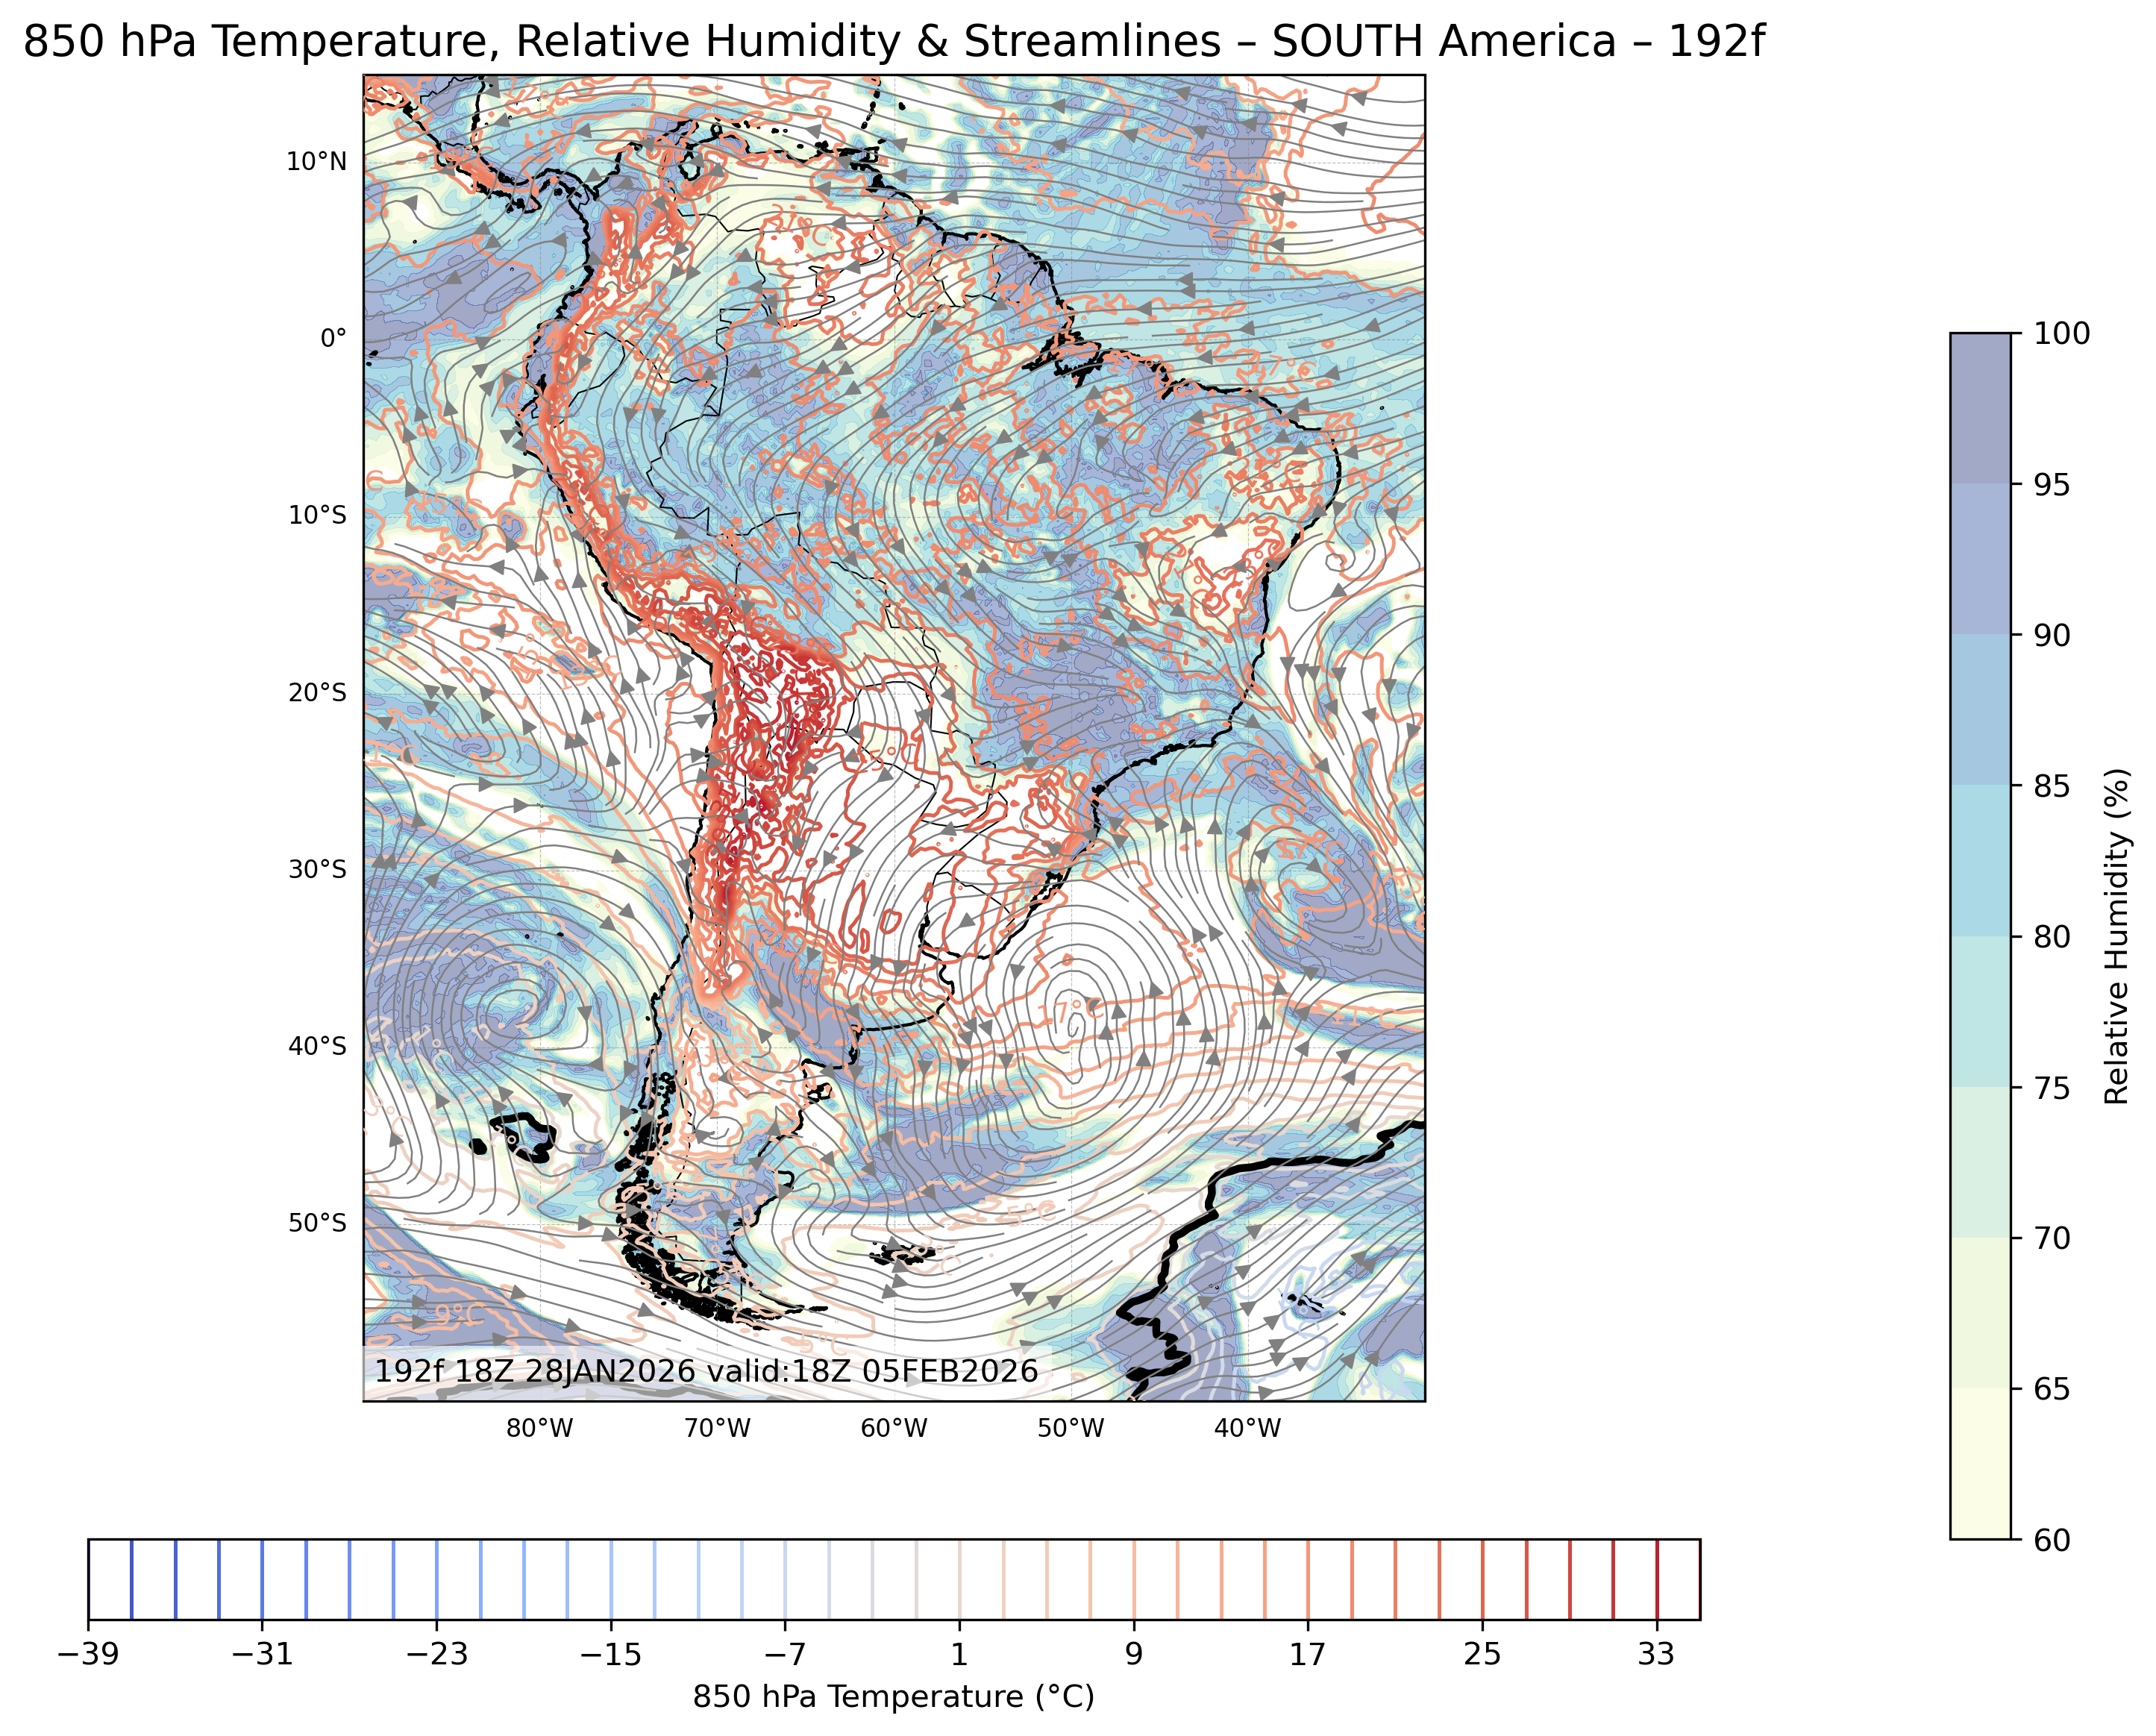
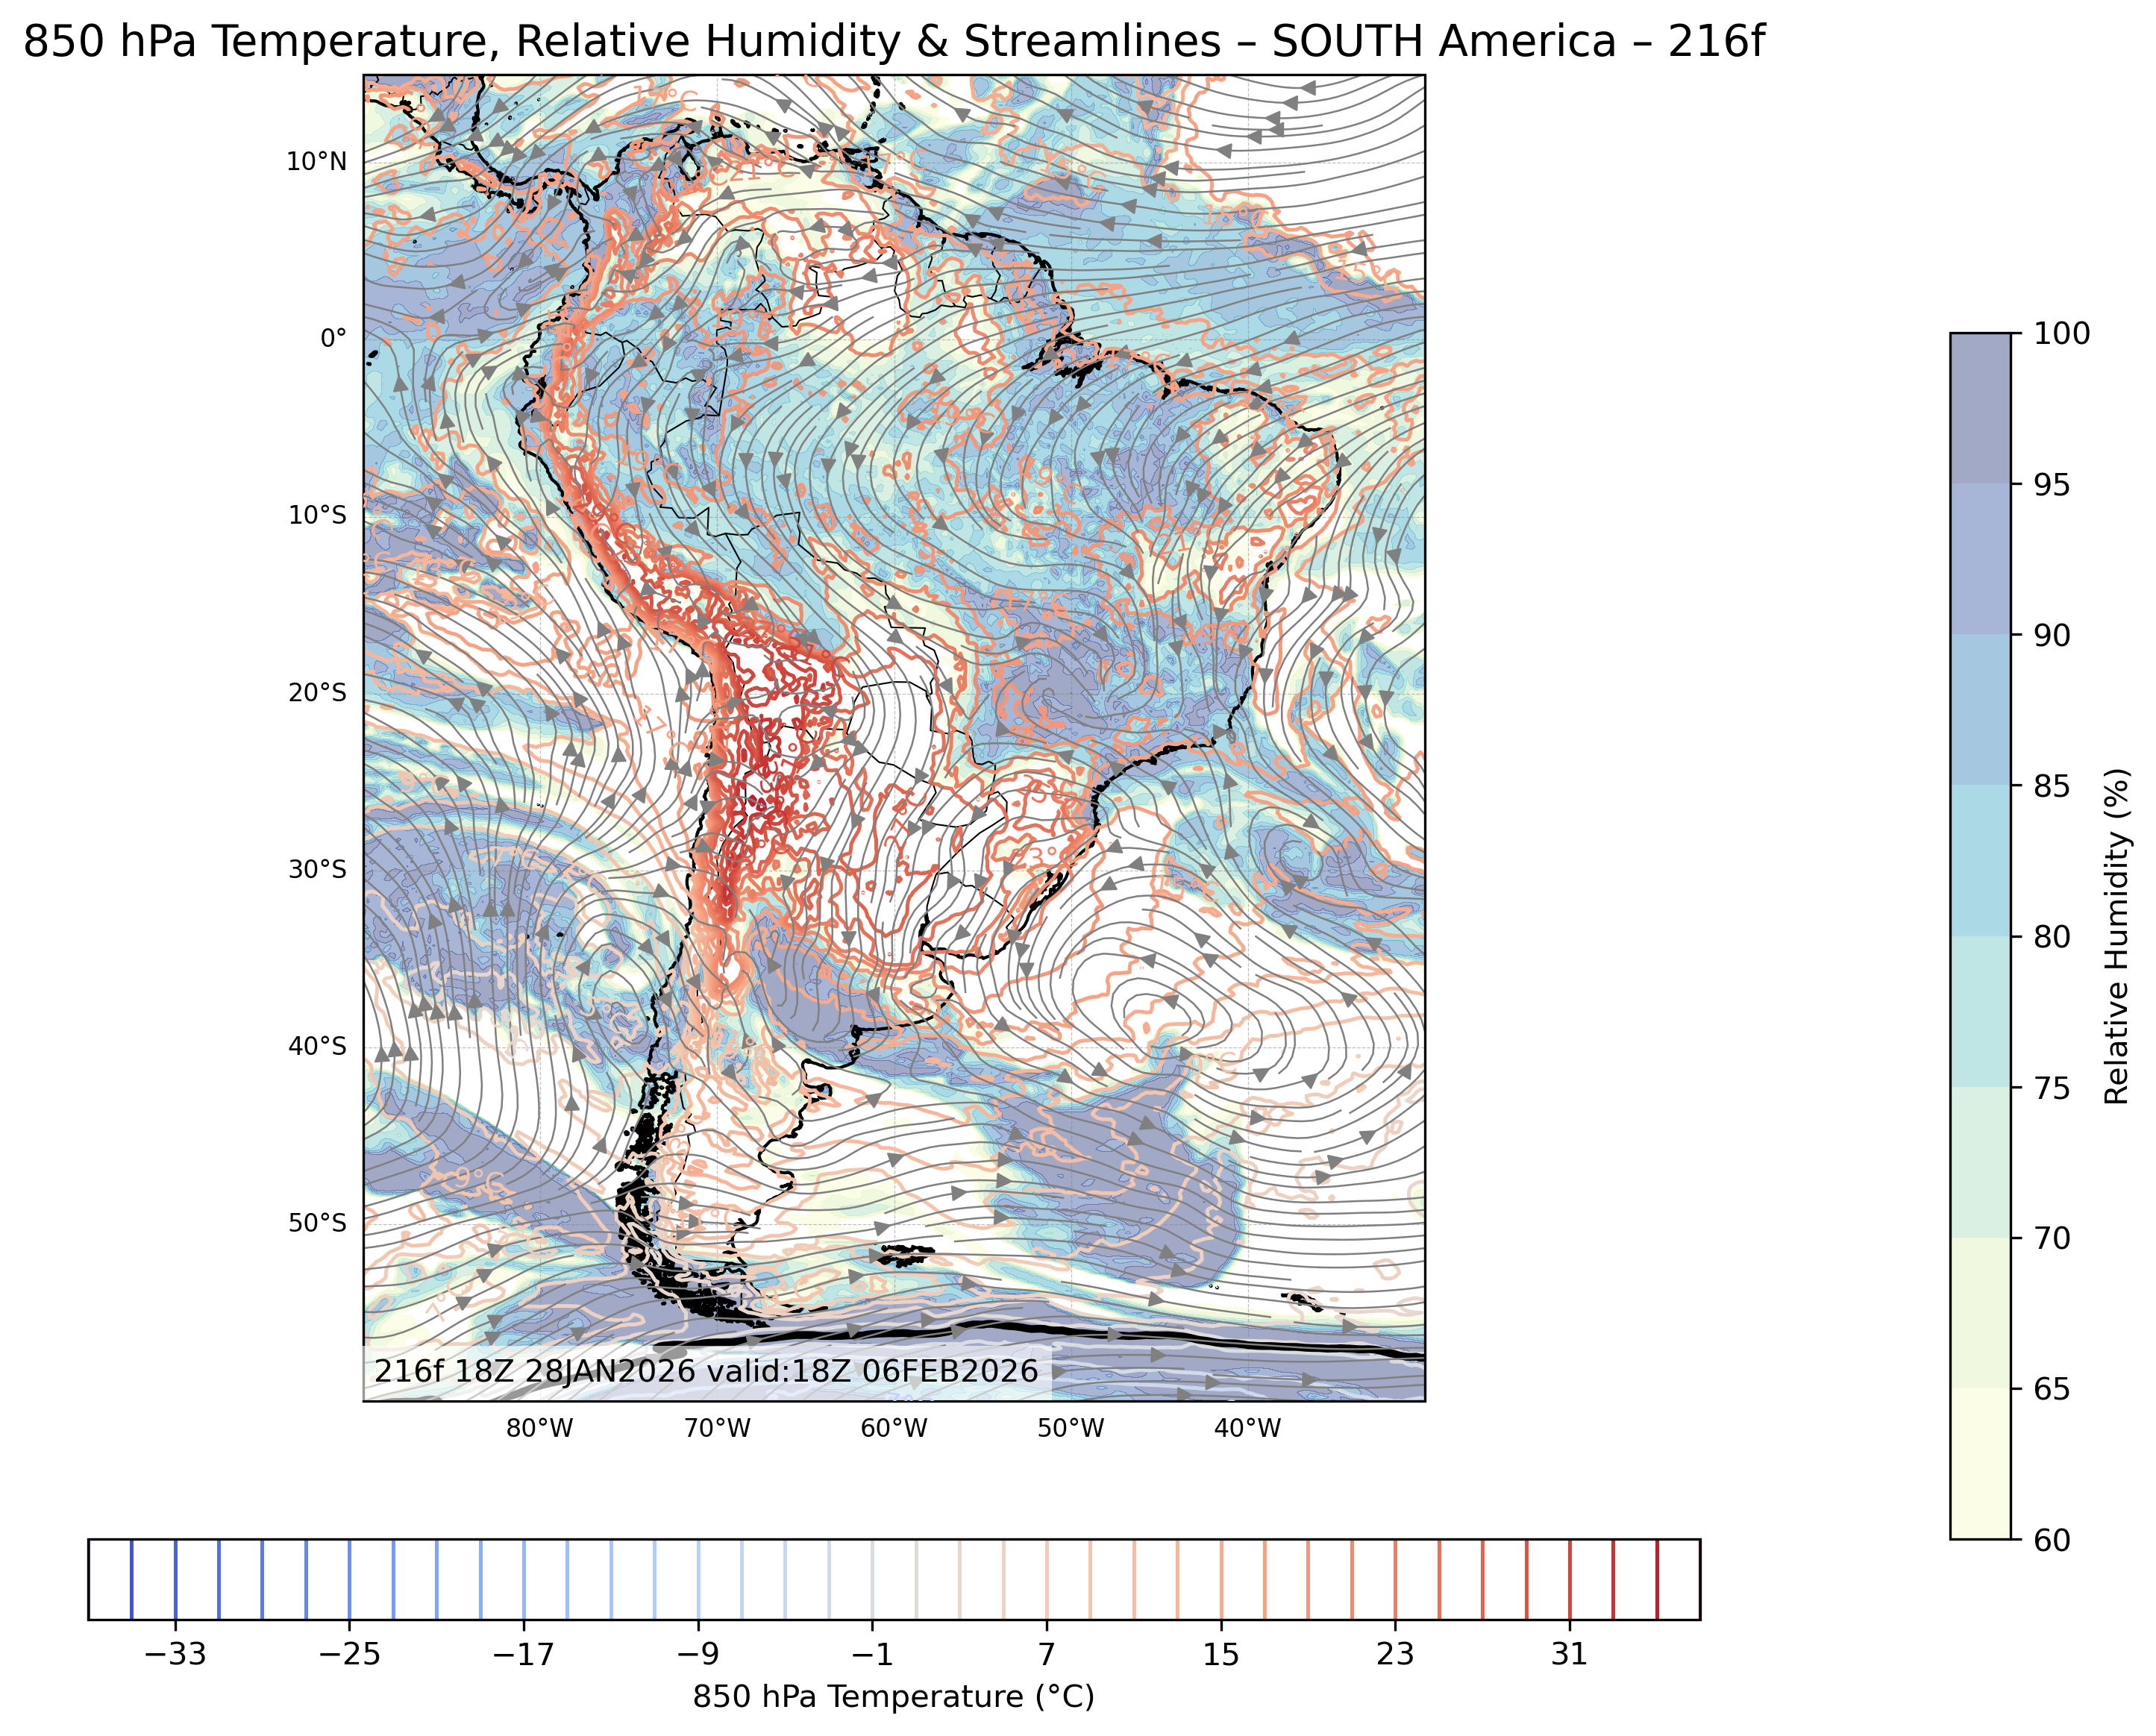
| 850mb Temperature Relative Humidity & Winds |
All Times |
🔍 | 🔍 | 🔍 | 🔍 | 🔍 |
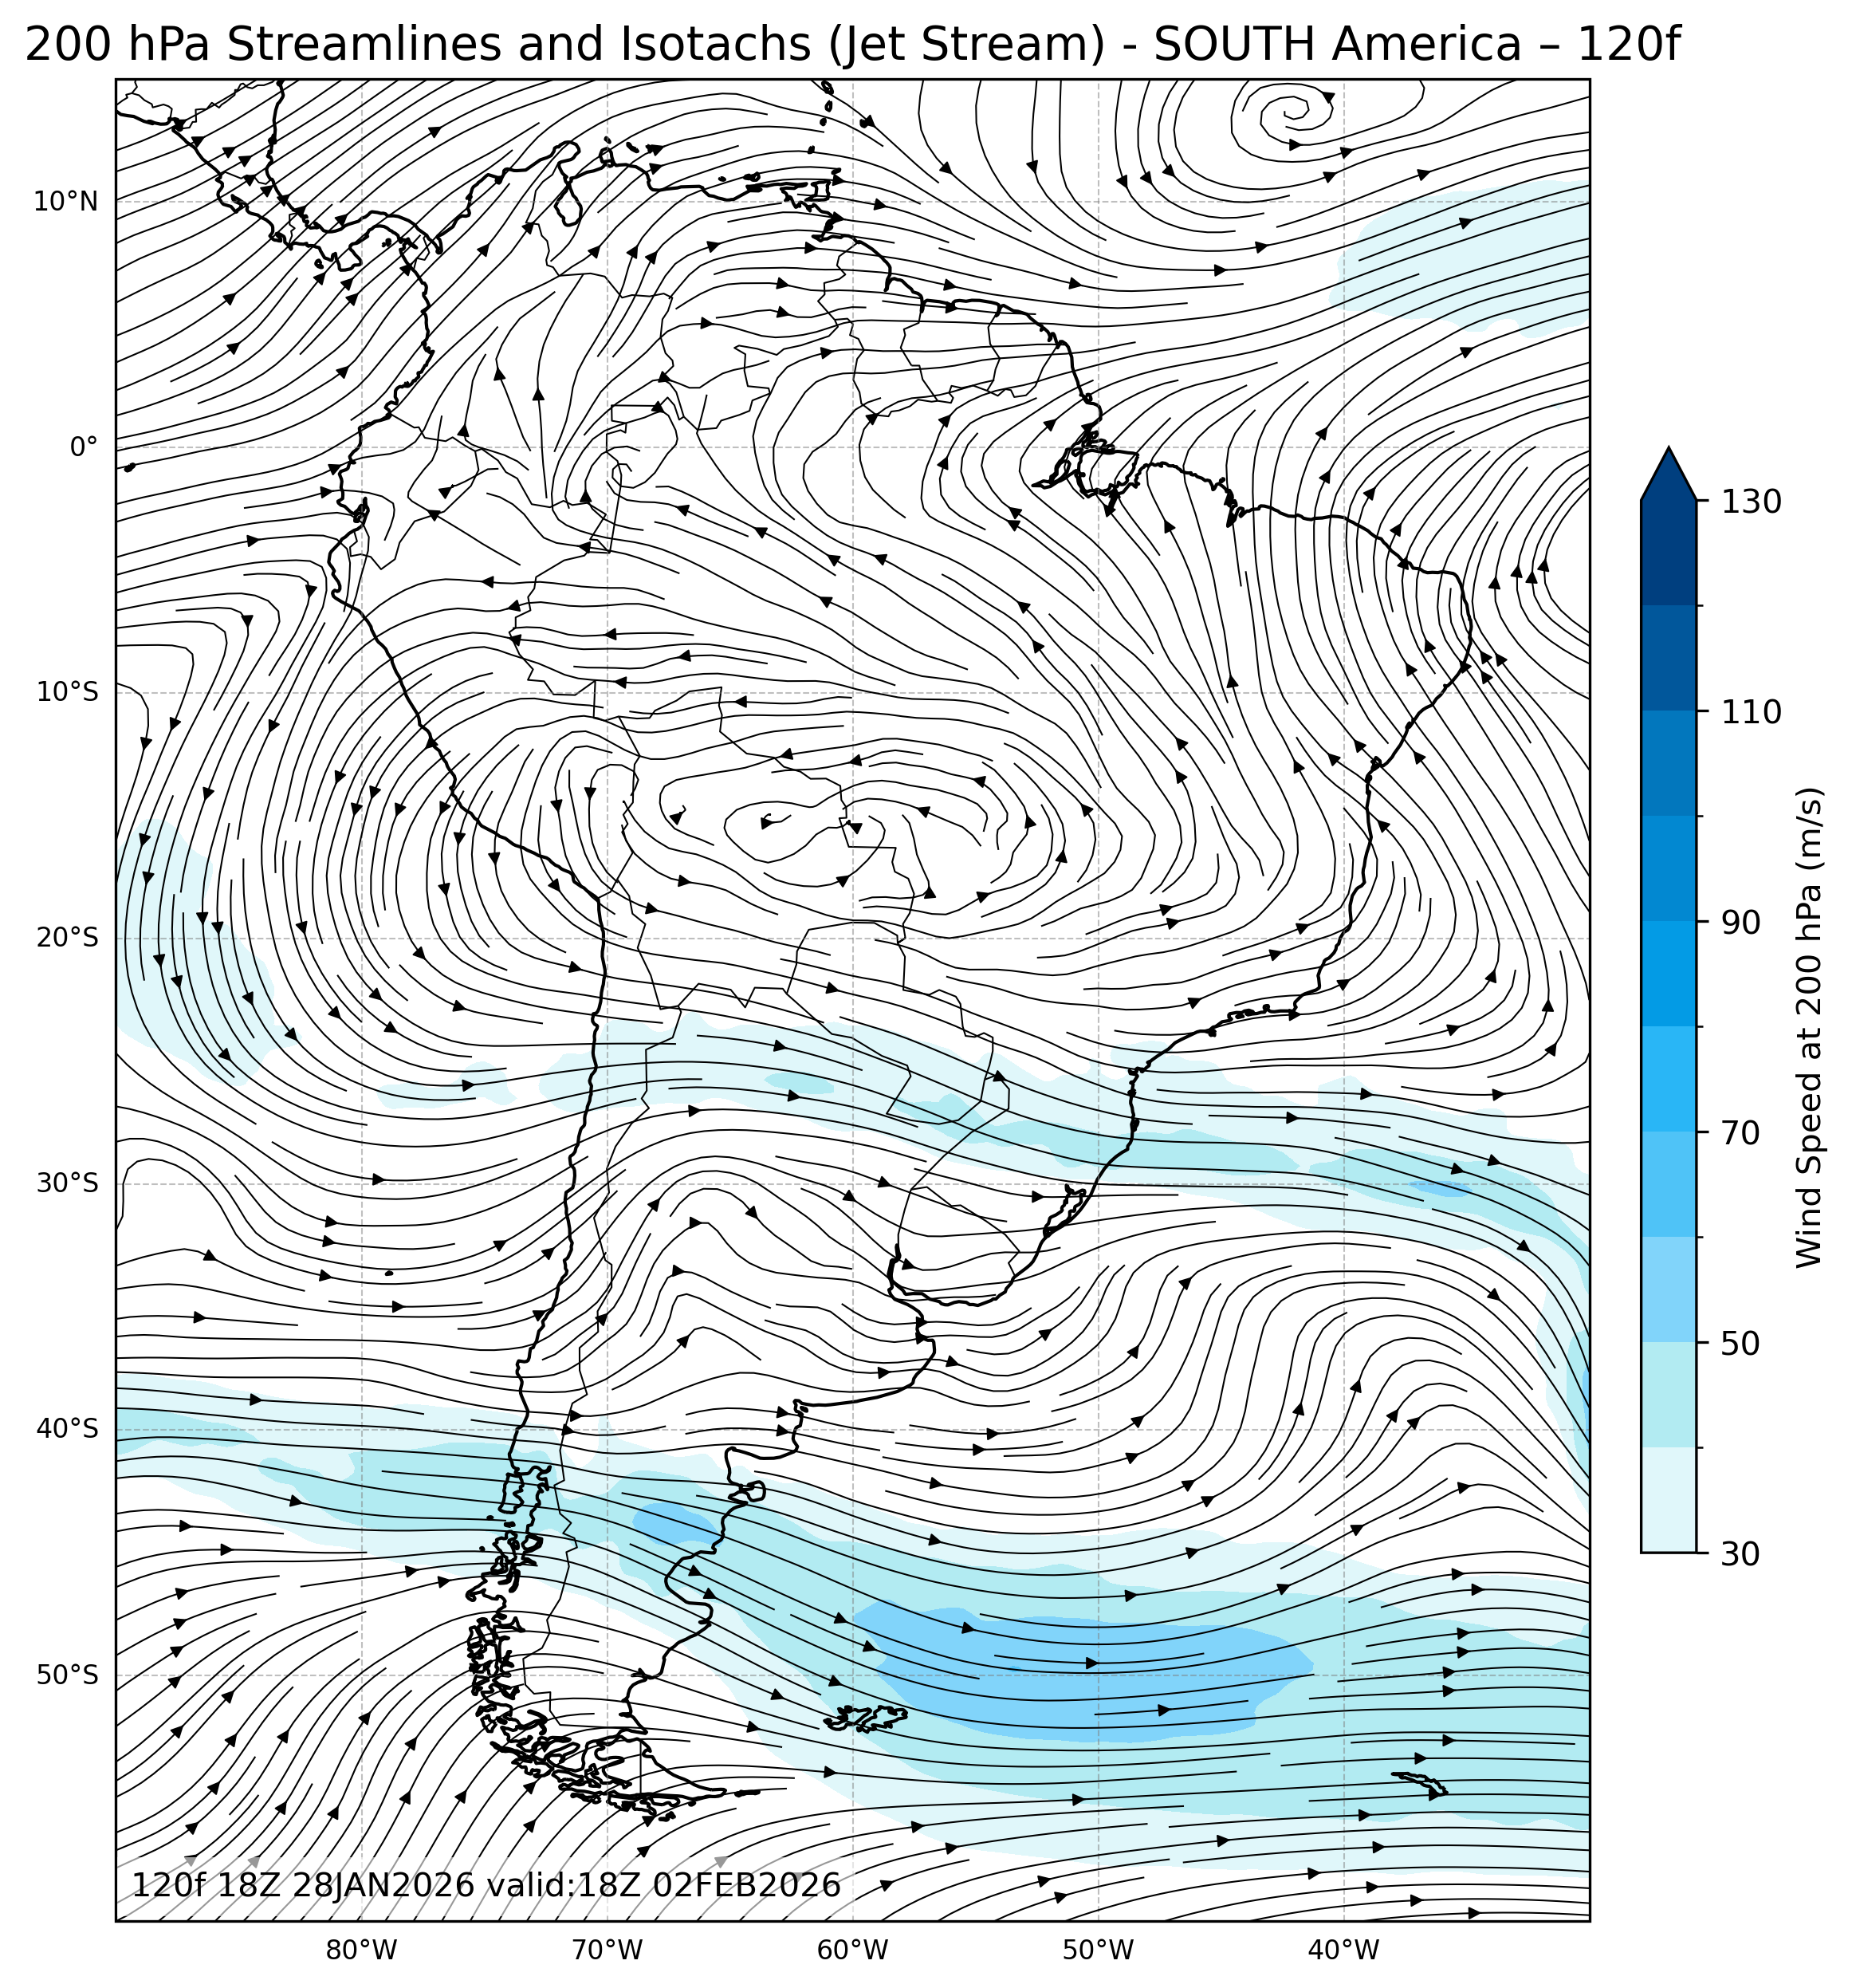
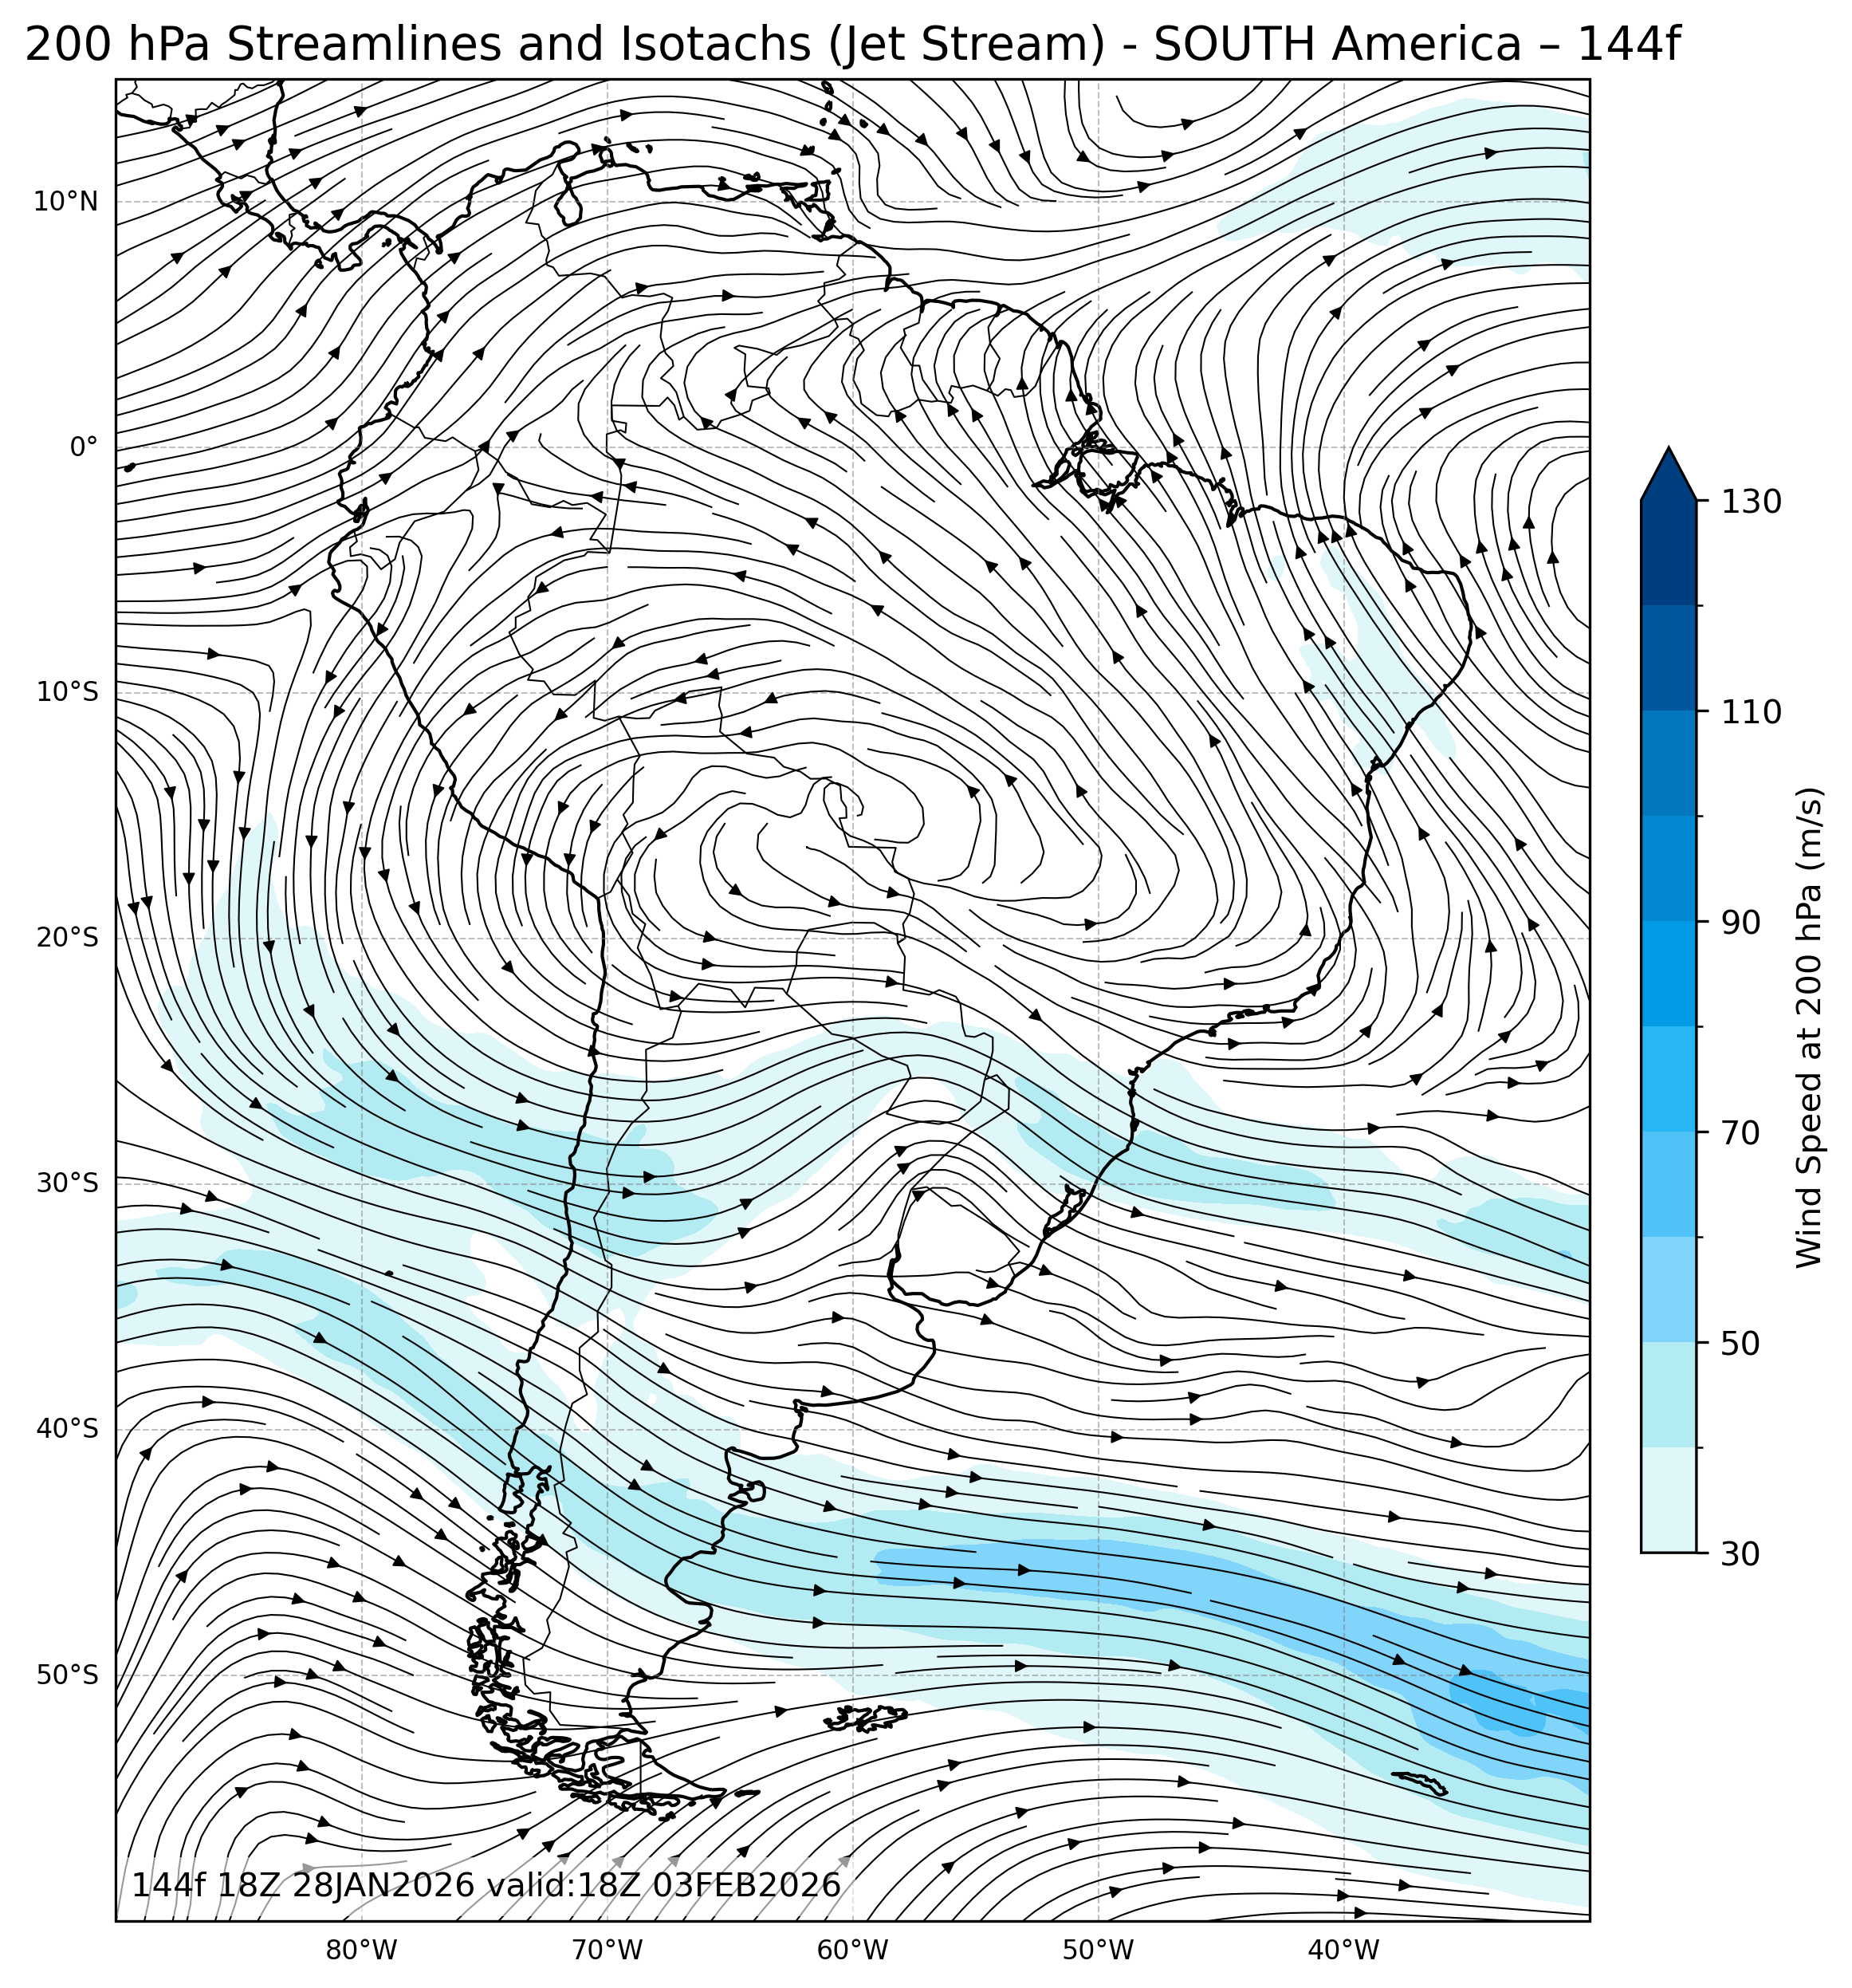
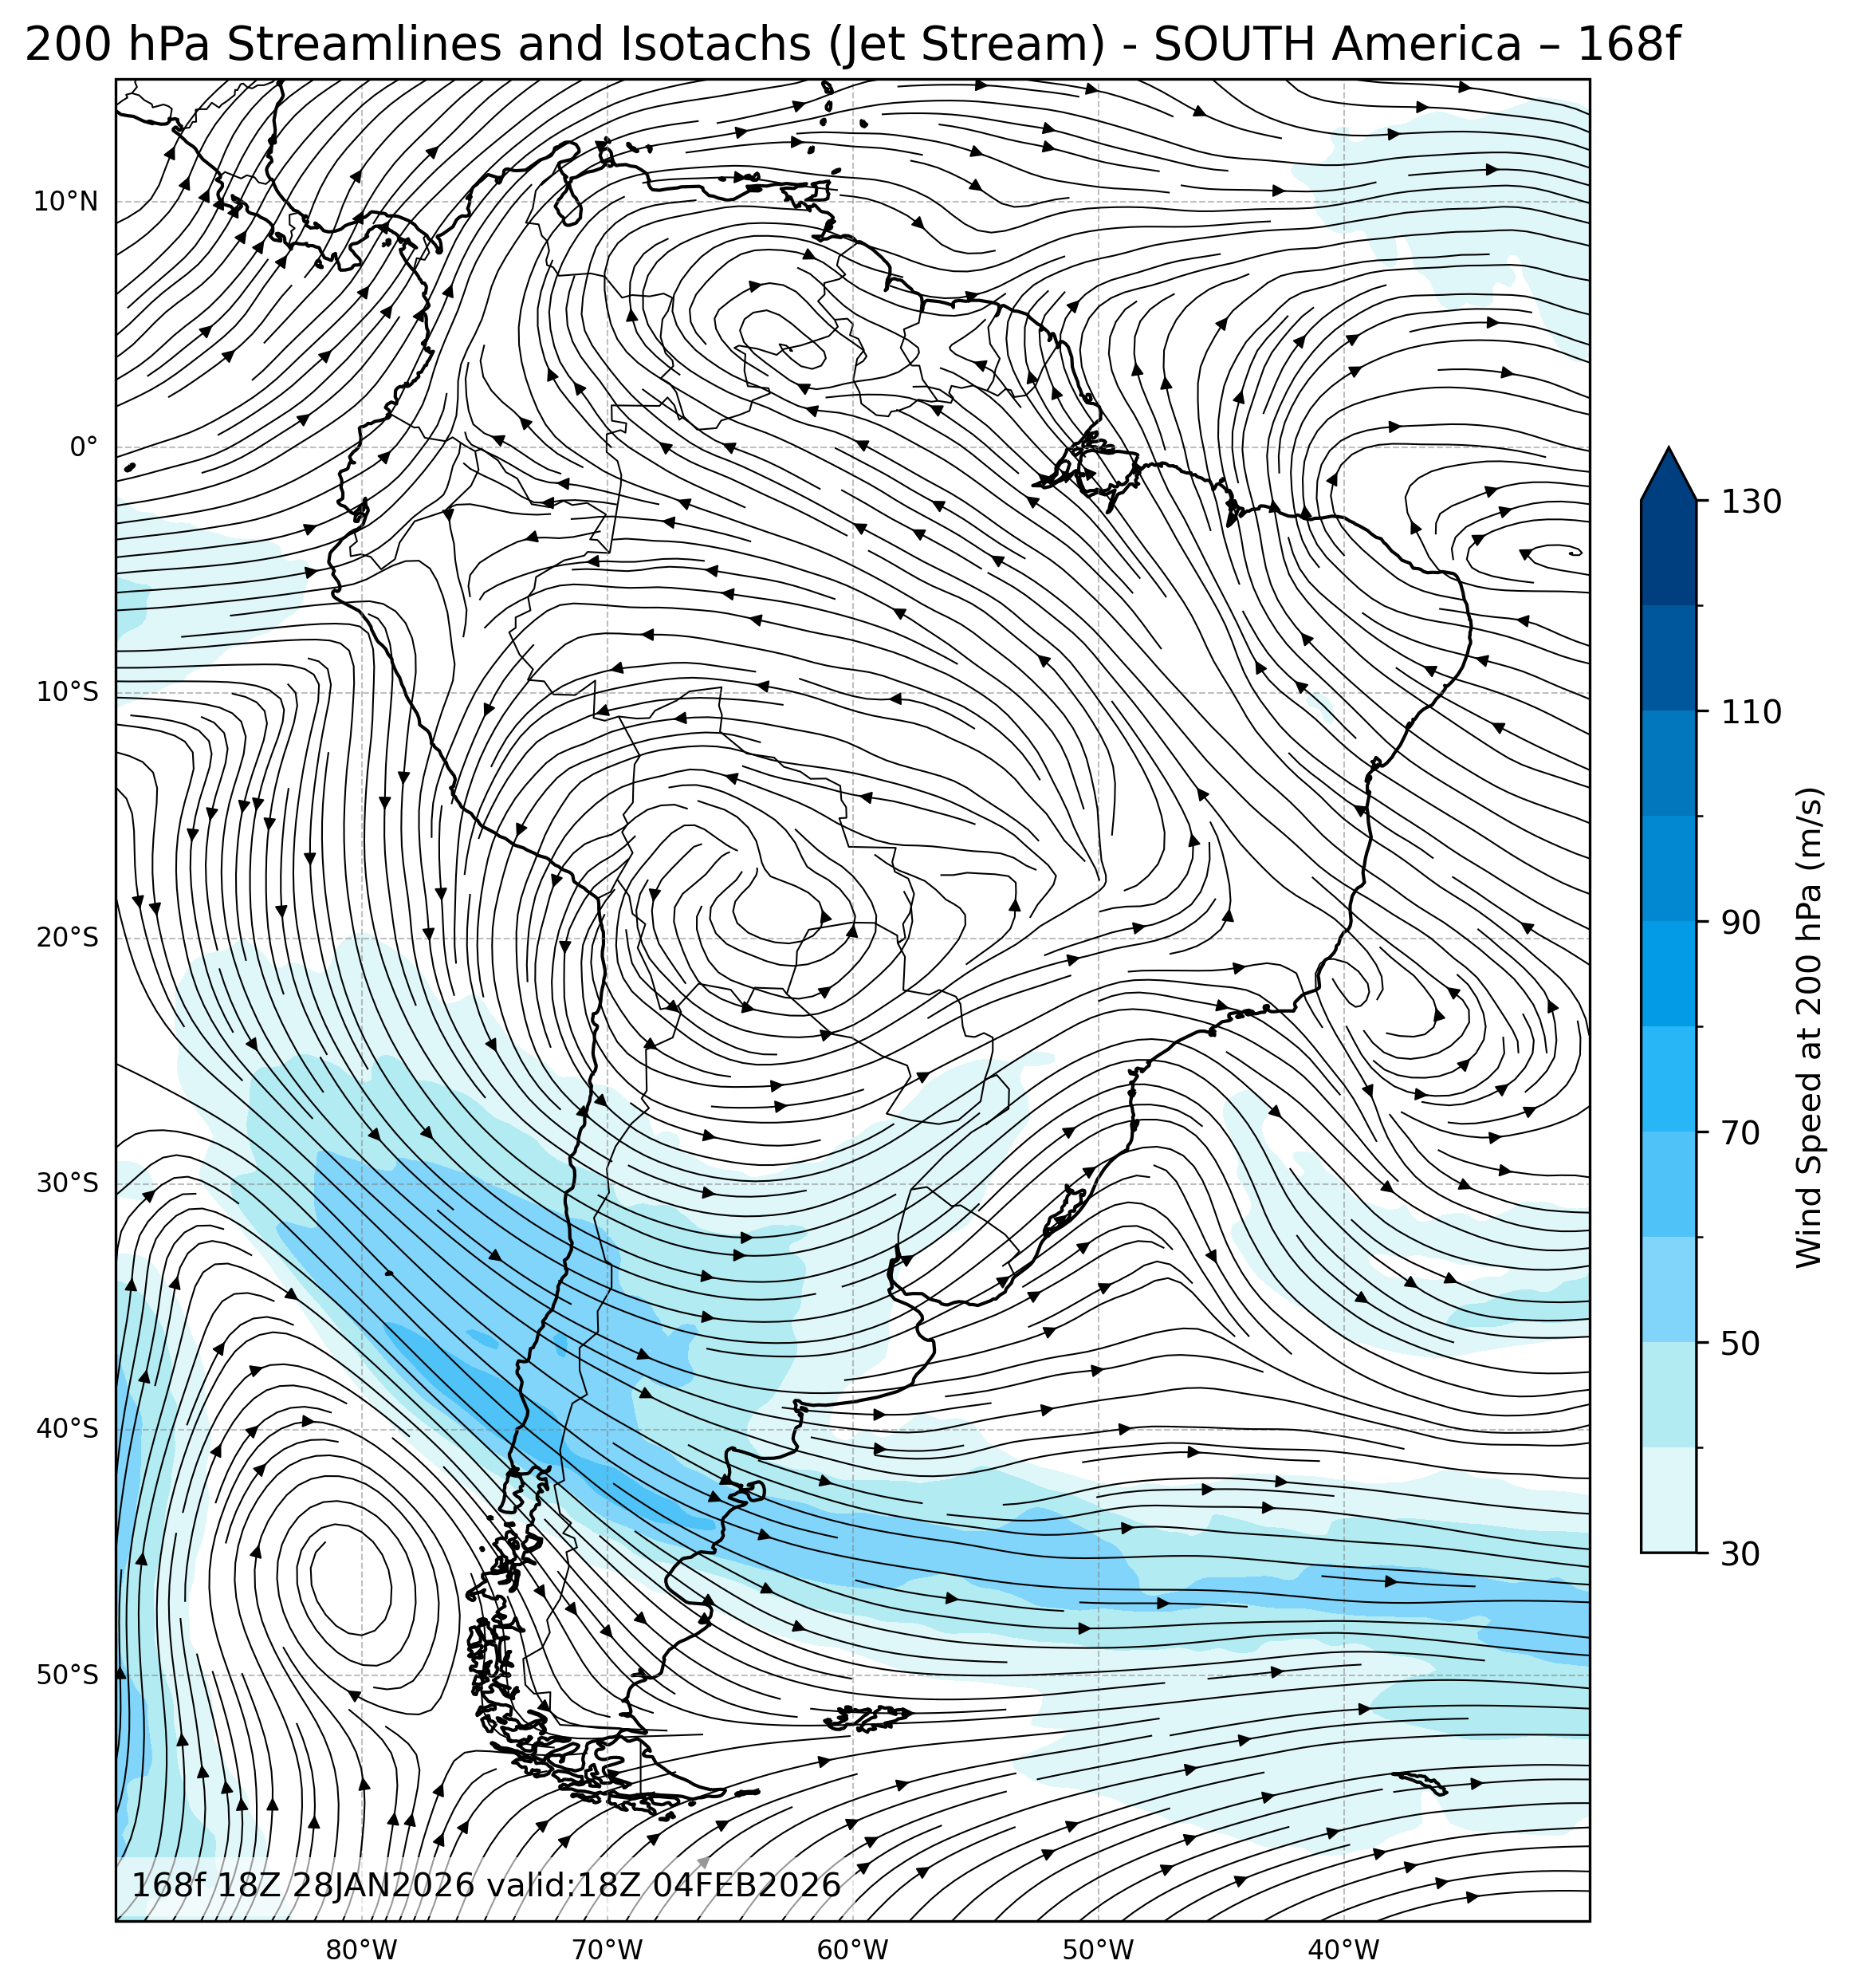
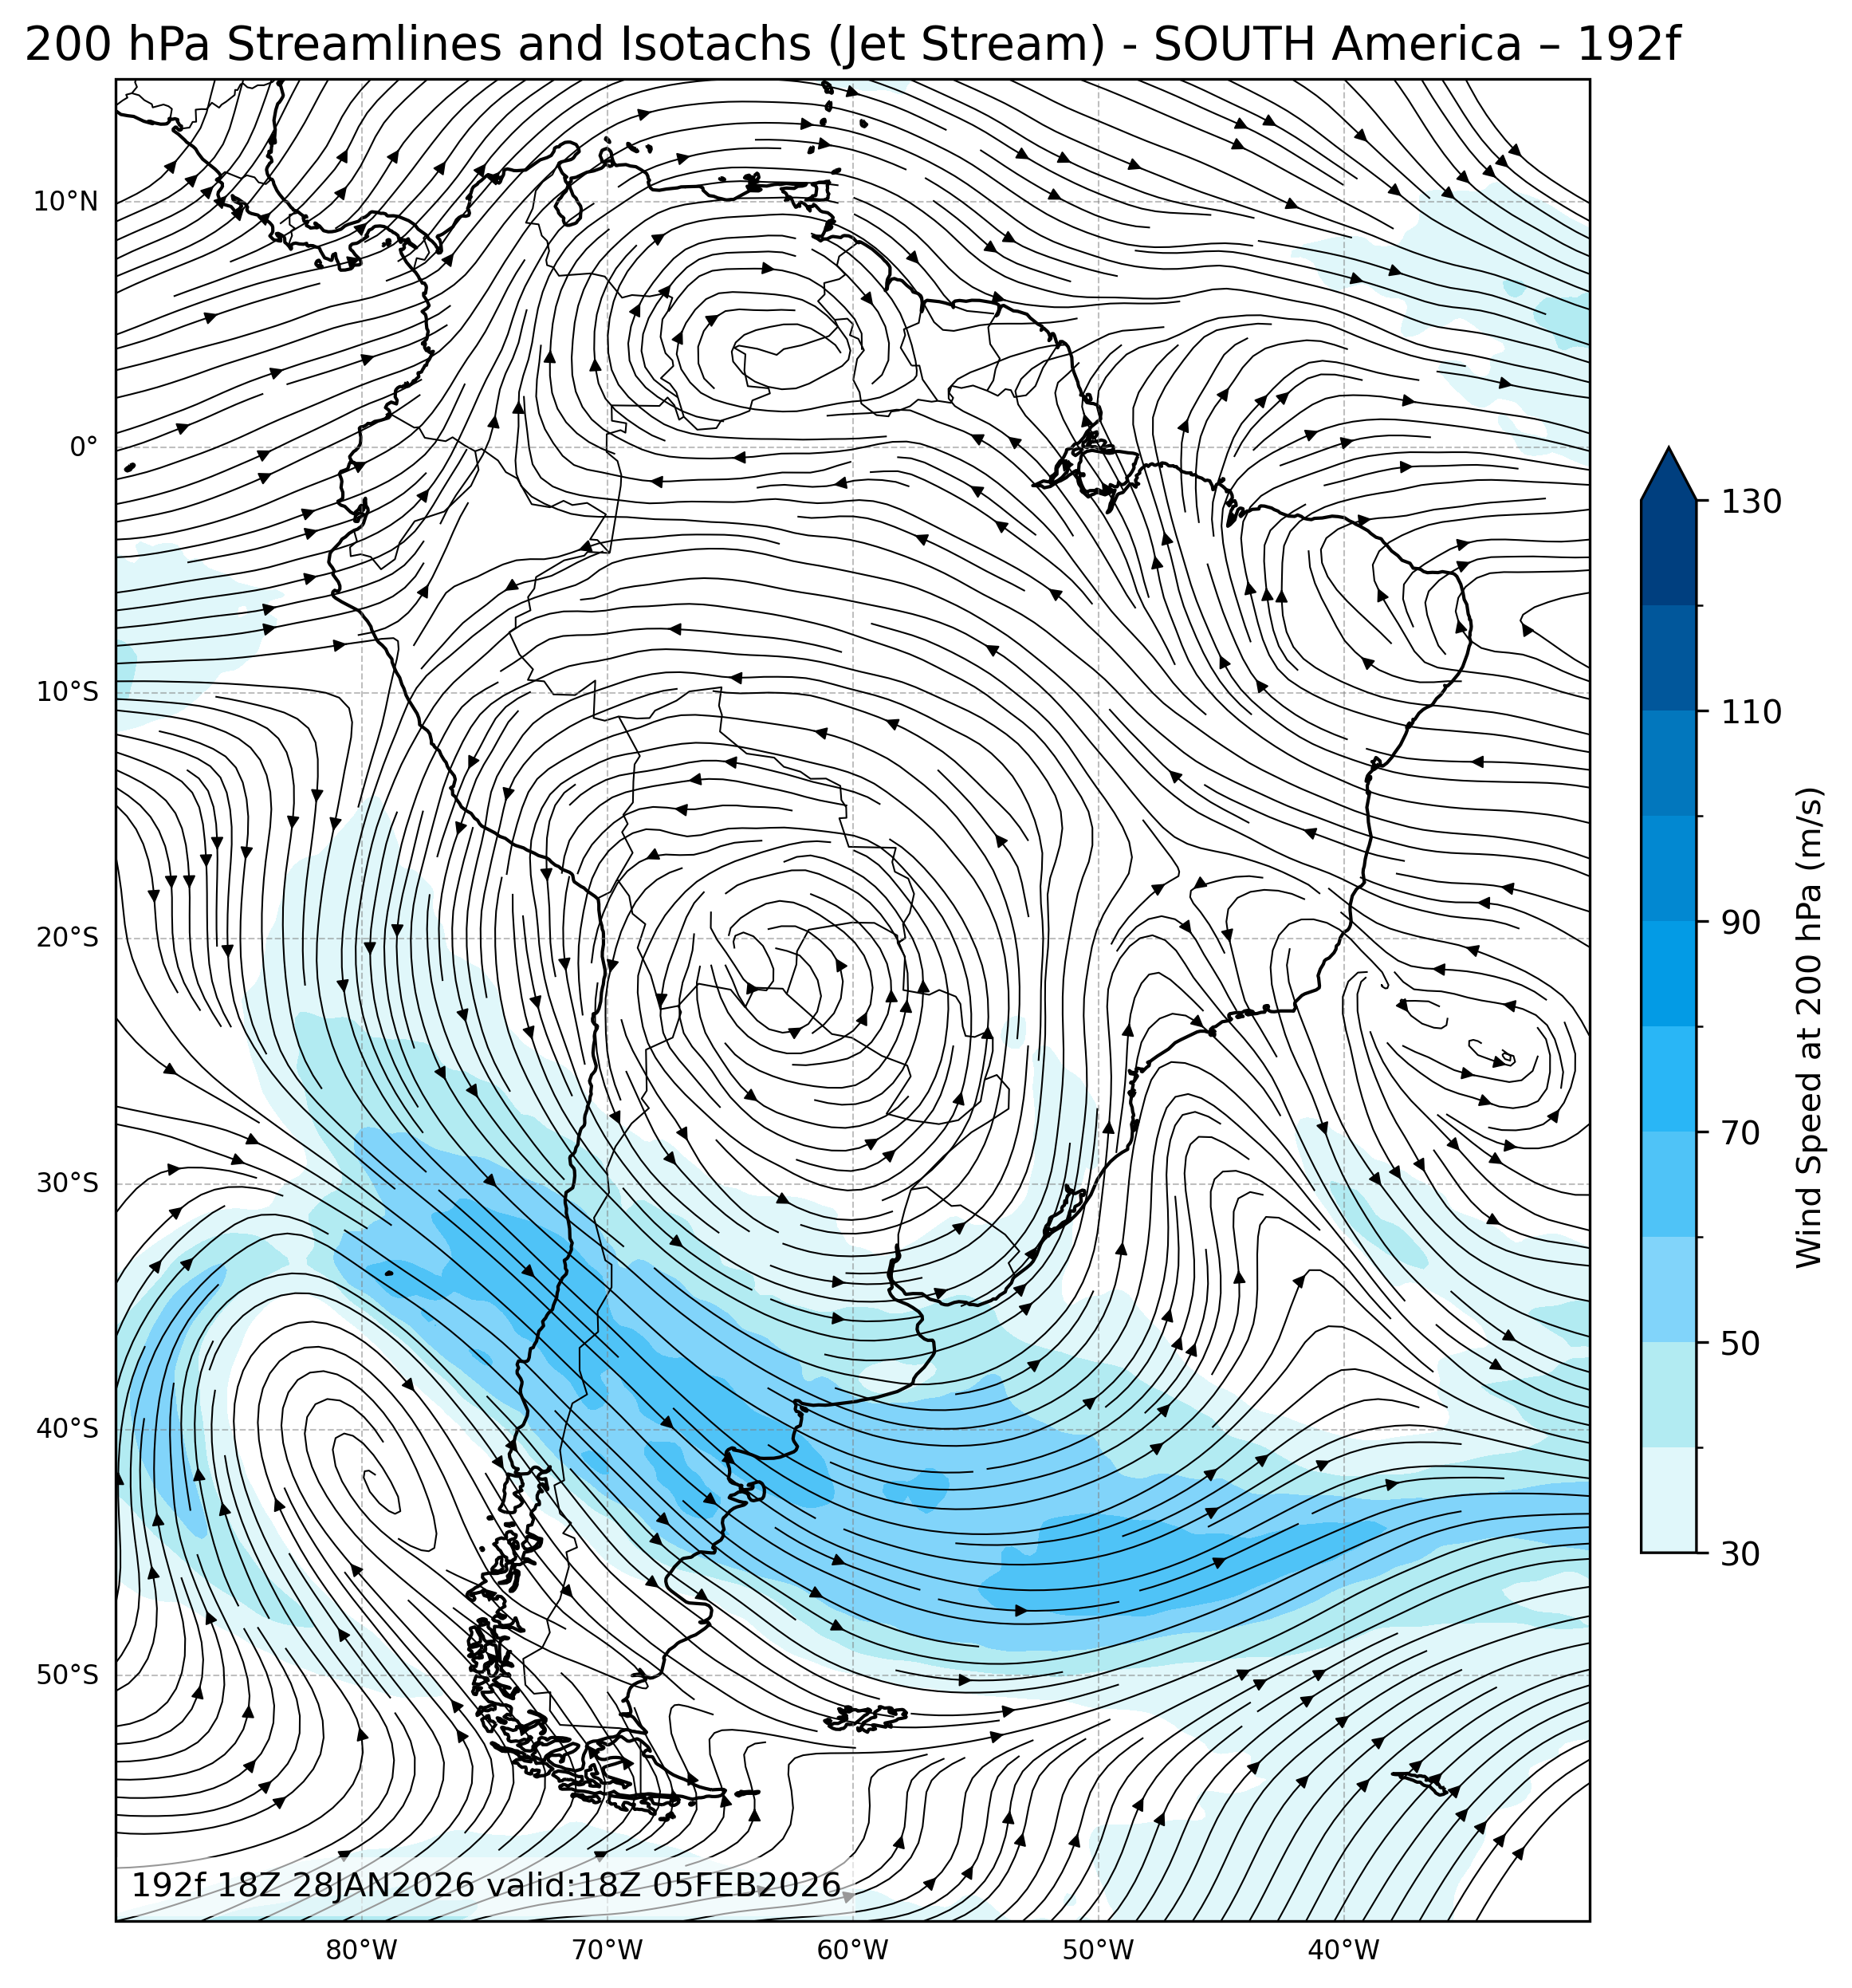
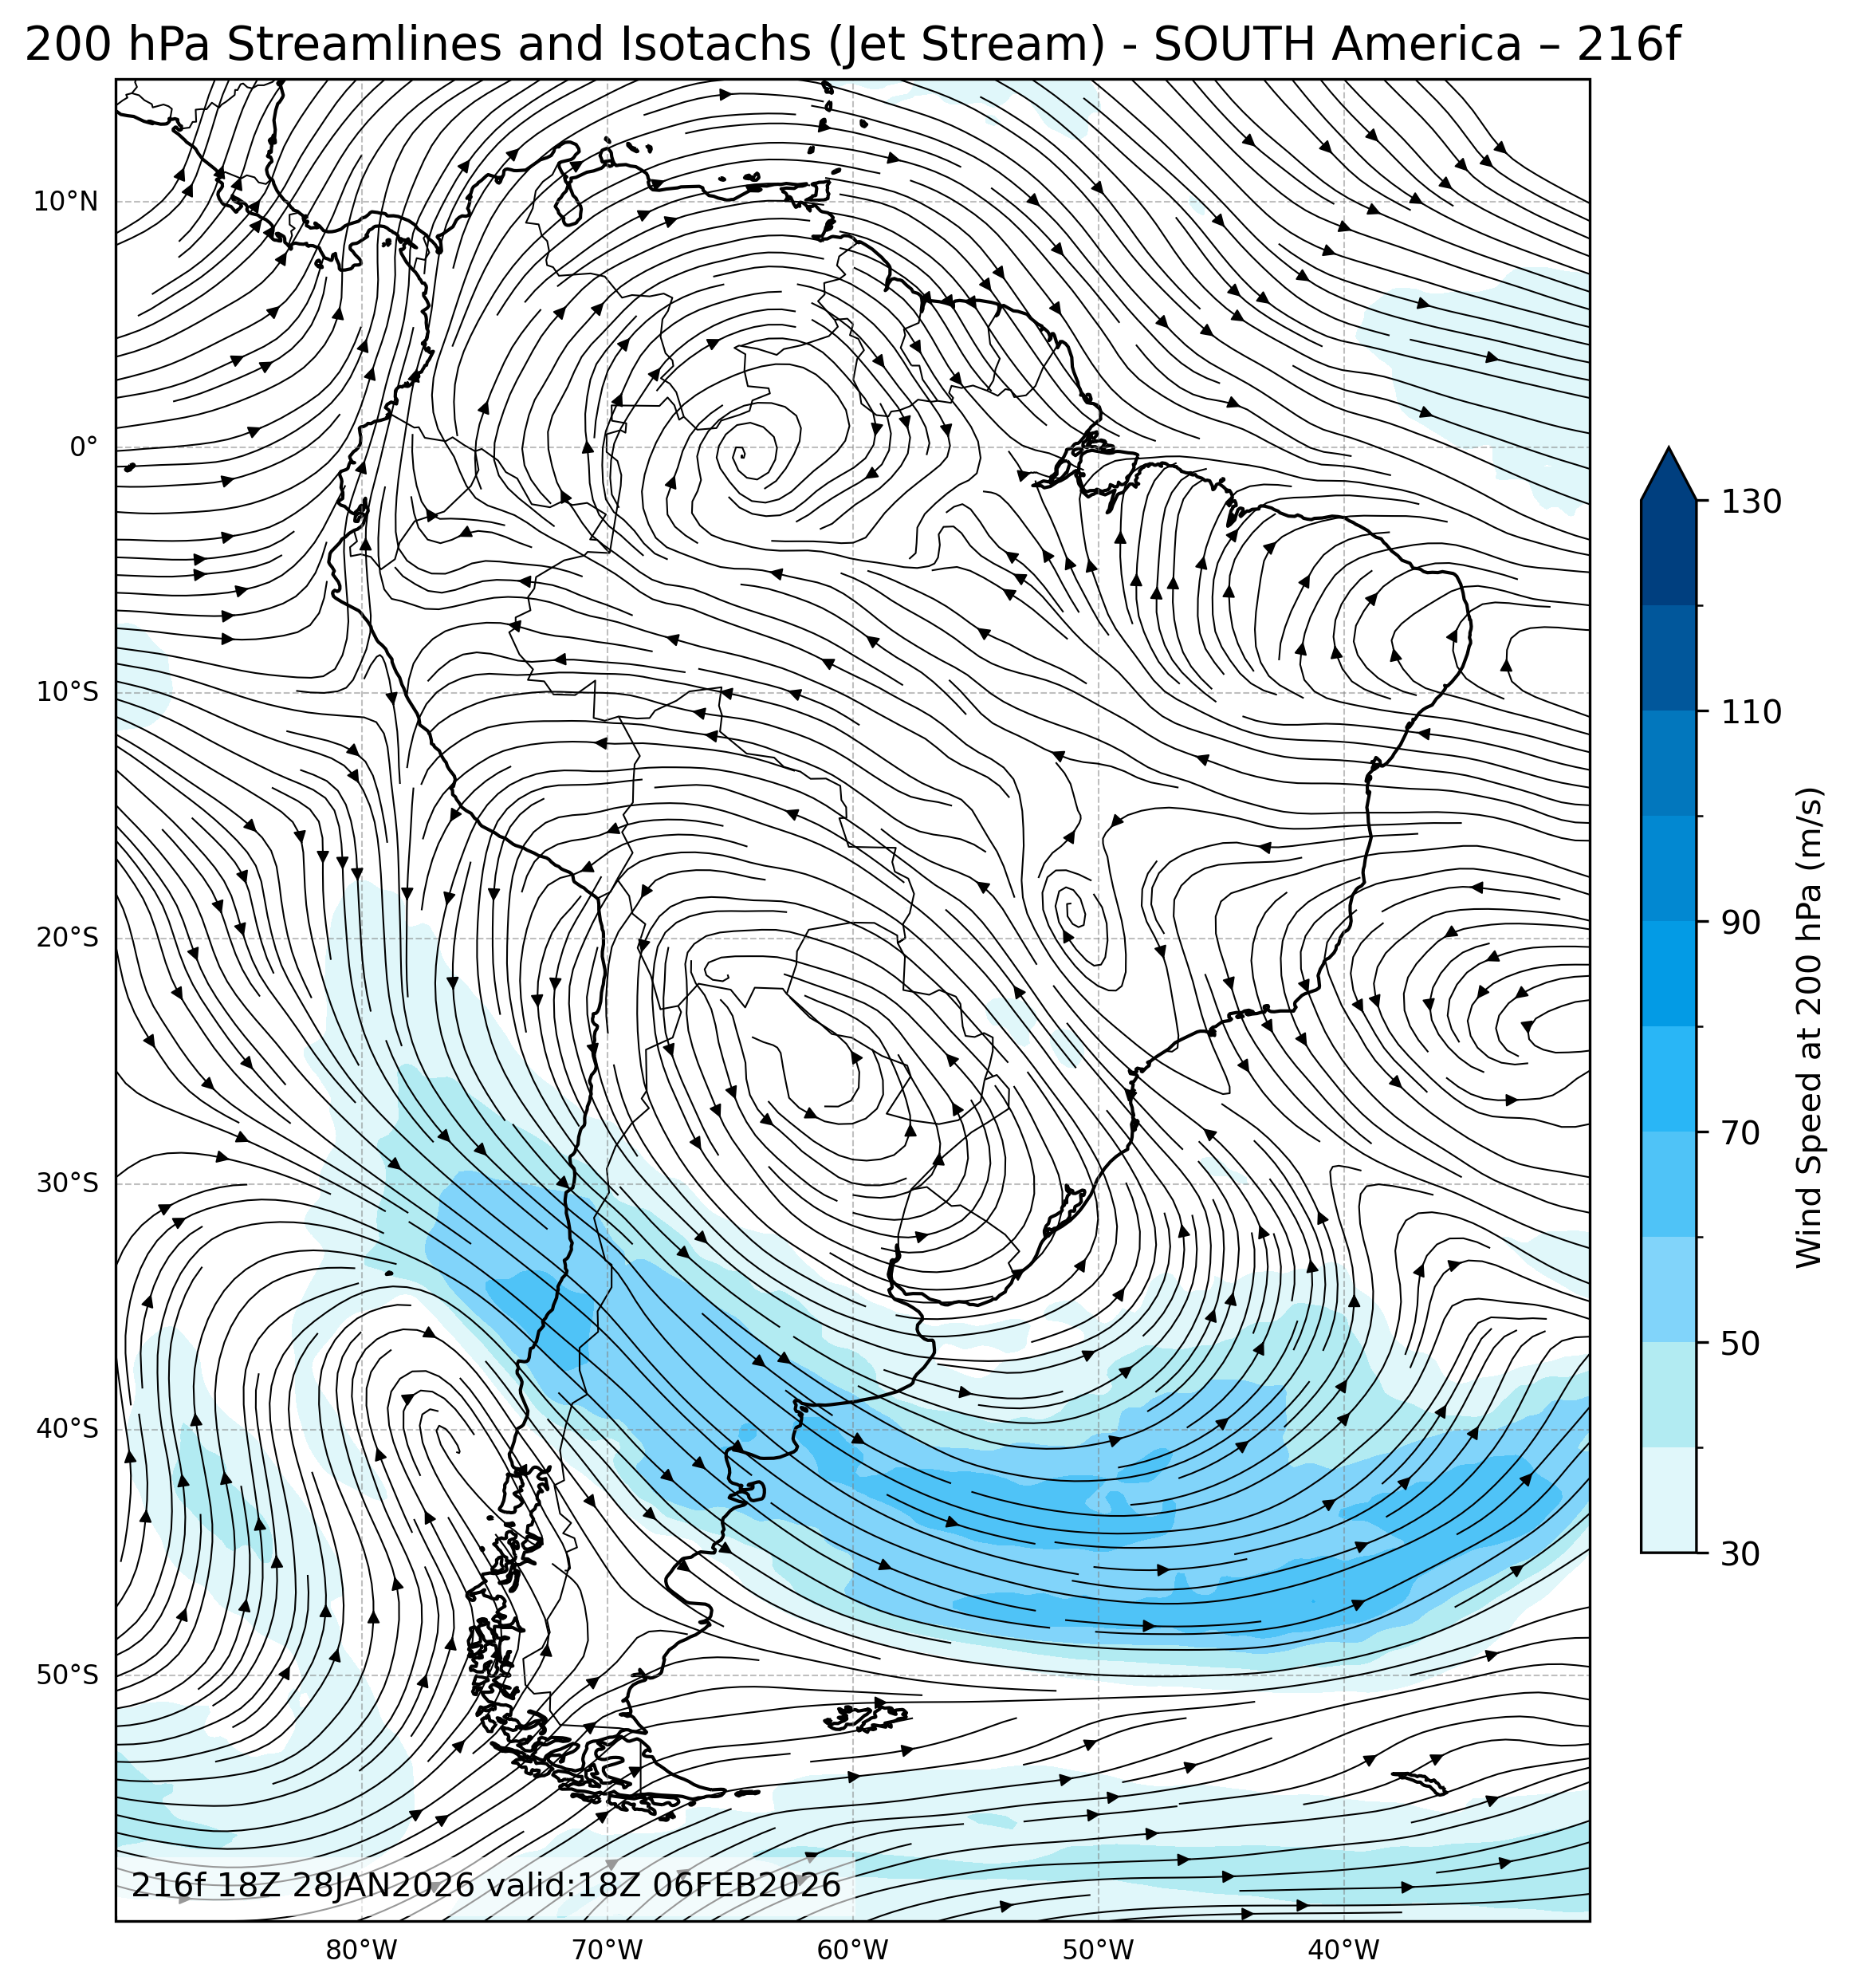
| 200mb Streamlines & Isotachs |
All Times |
🔍 | 🔍 | 🔍 | 🔍 | 🔍 |
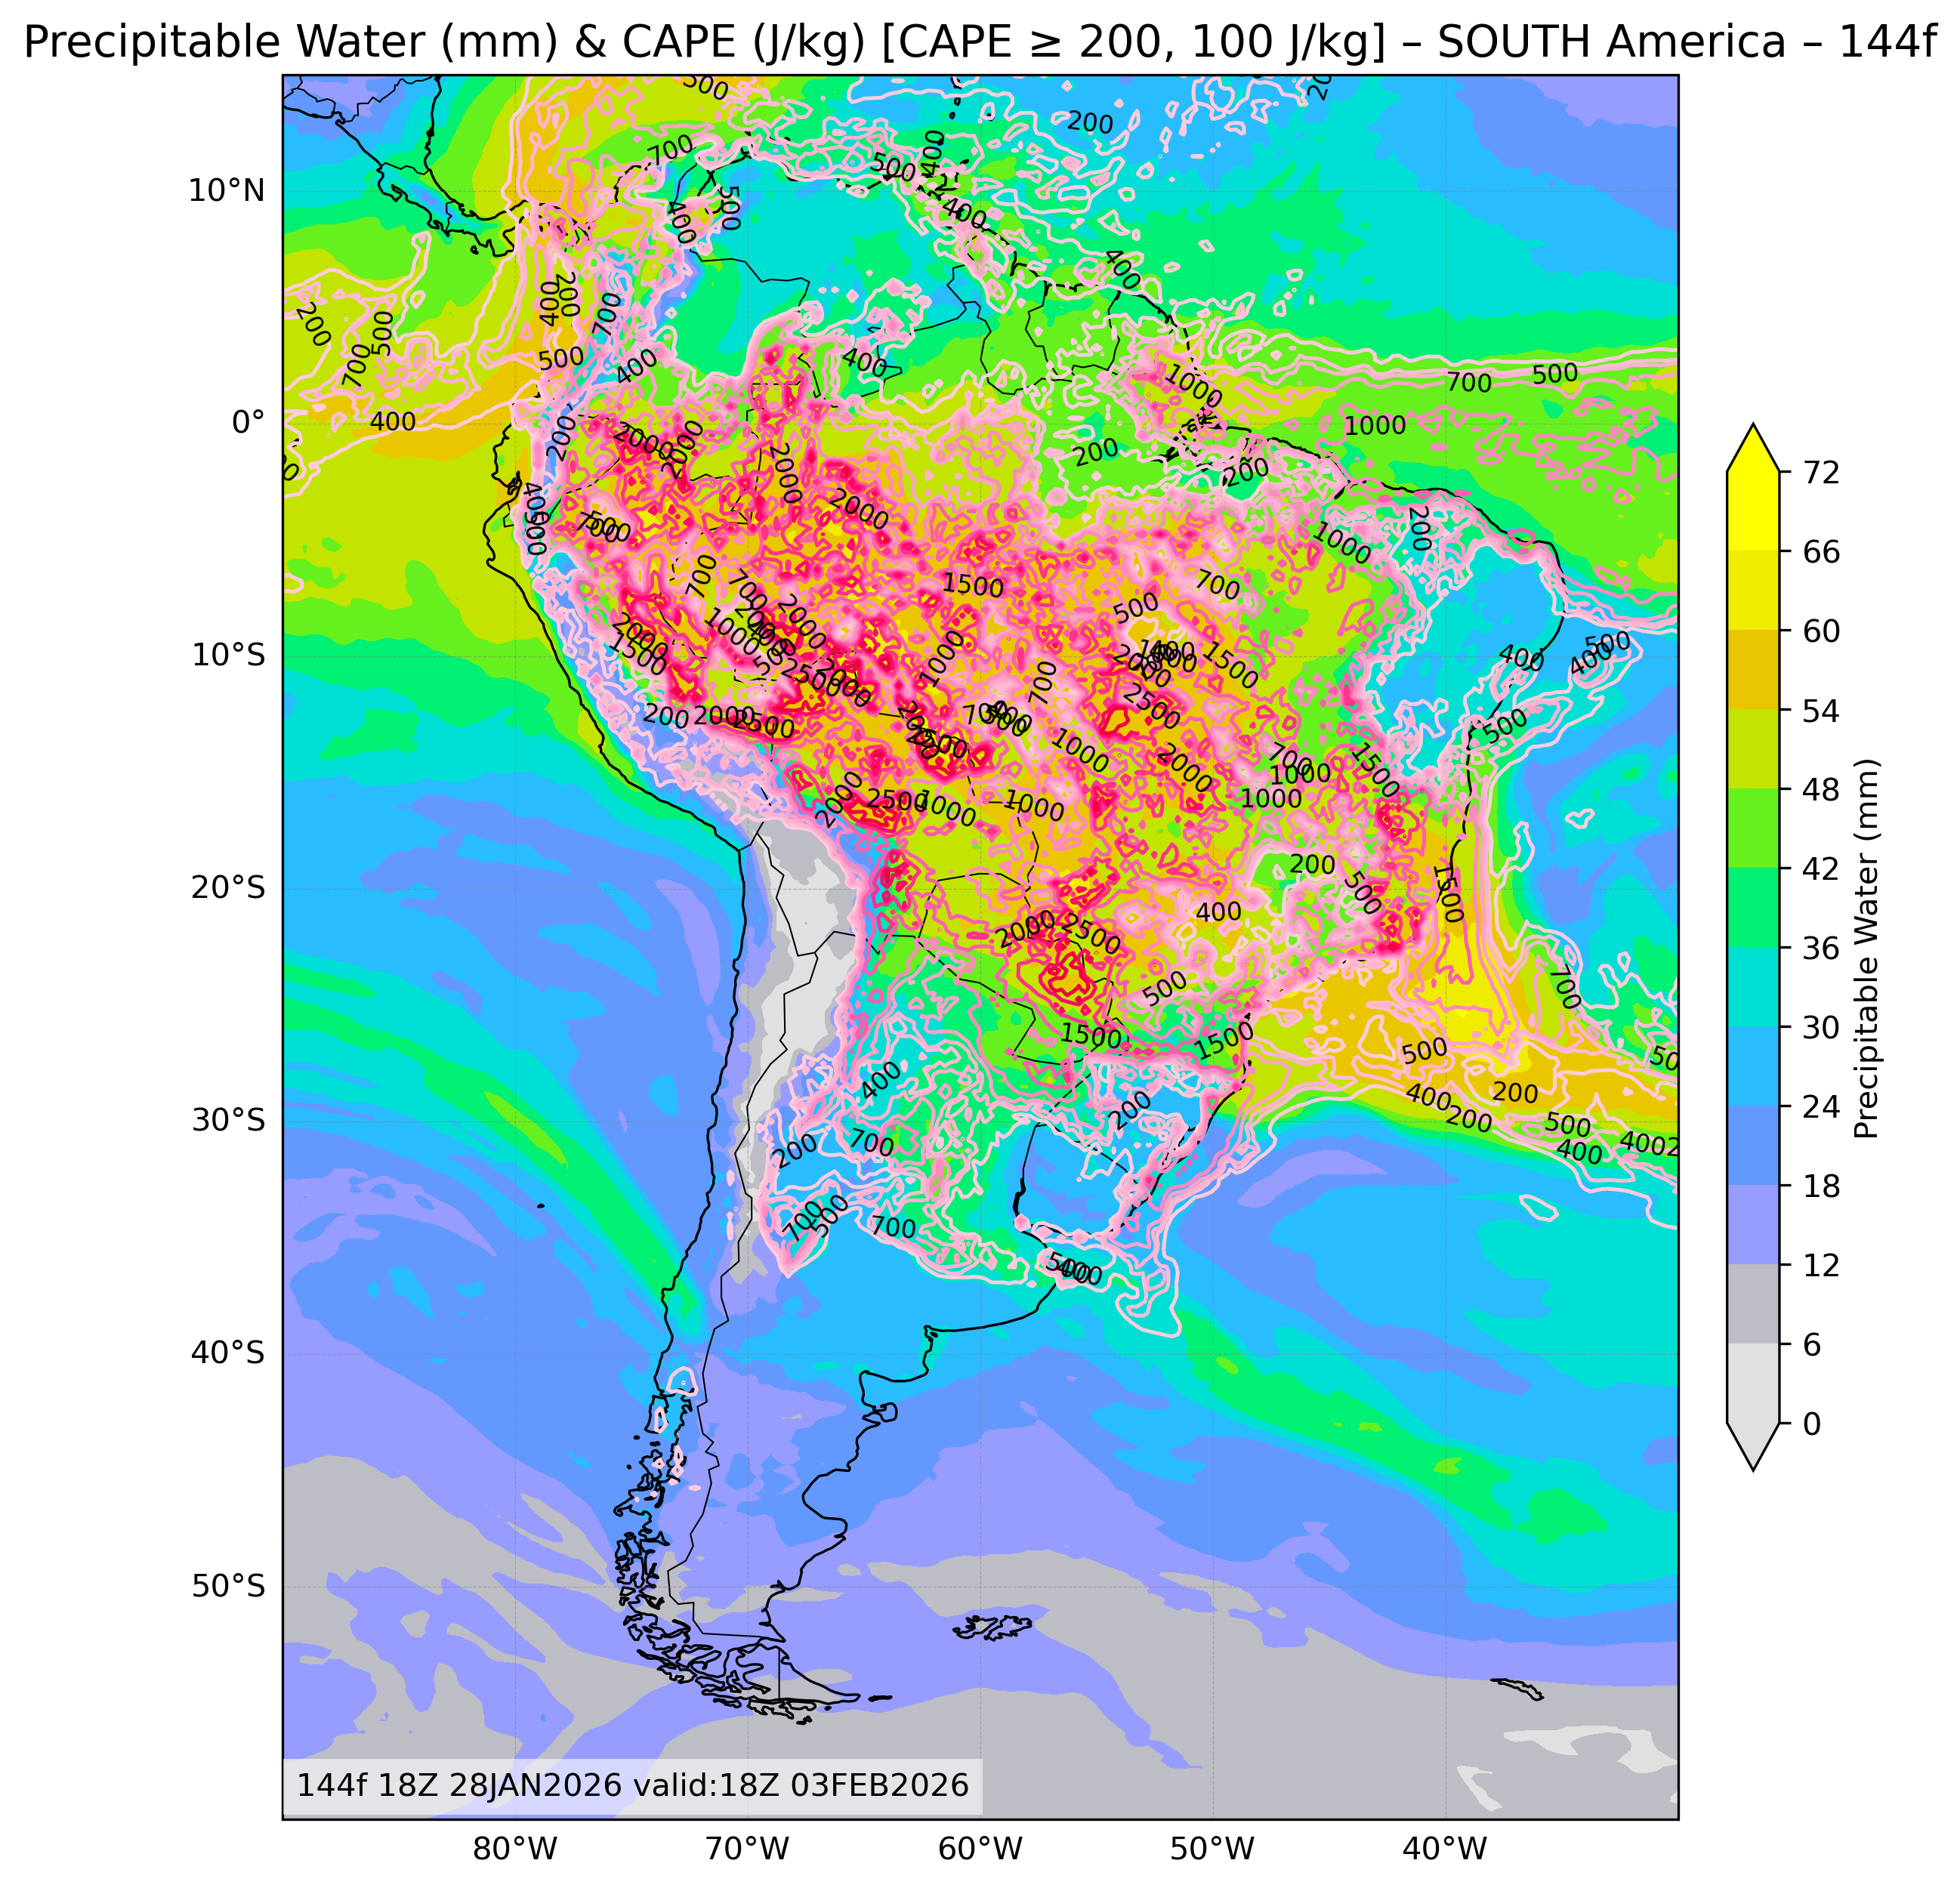
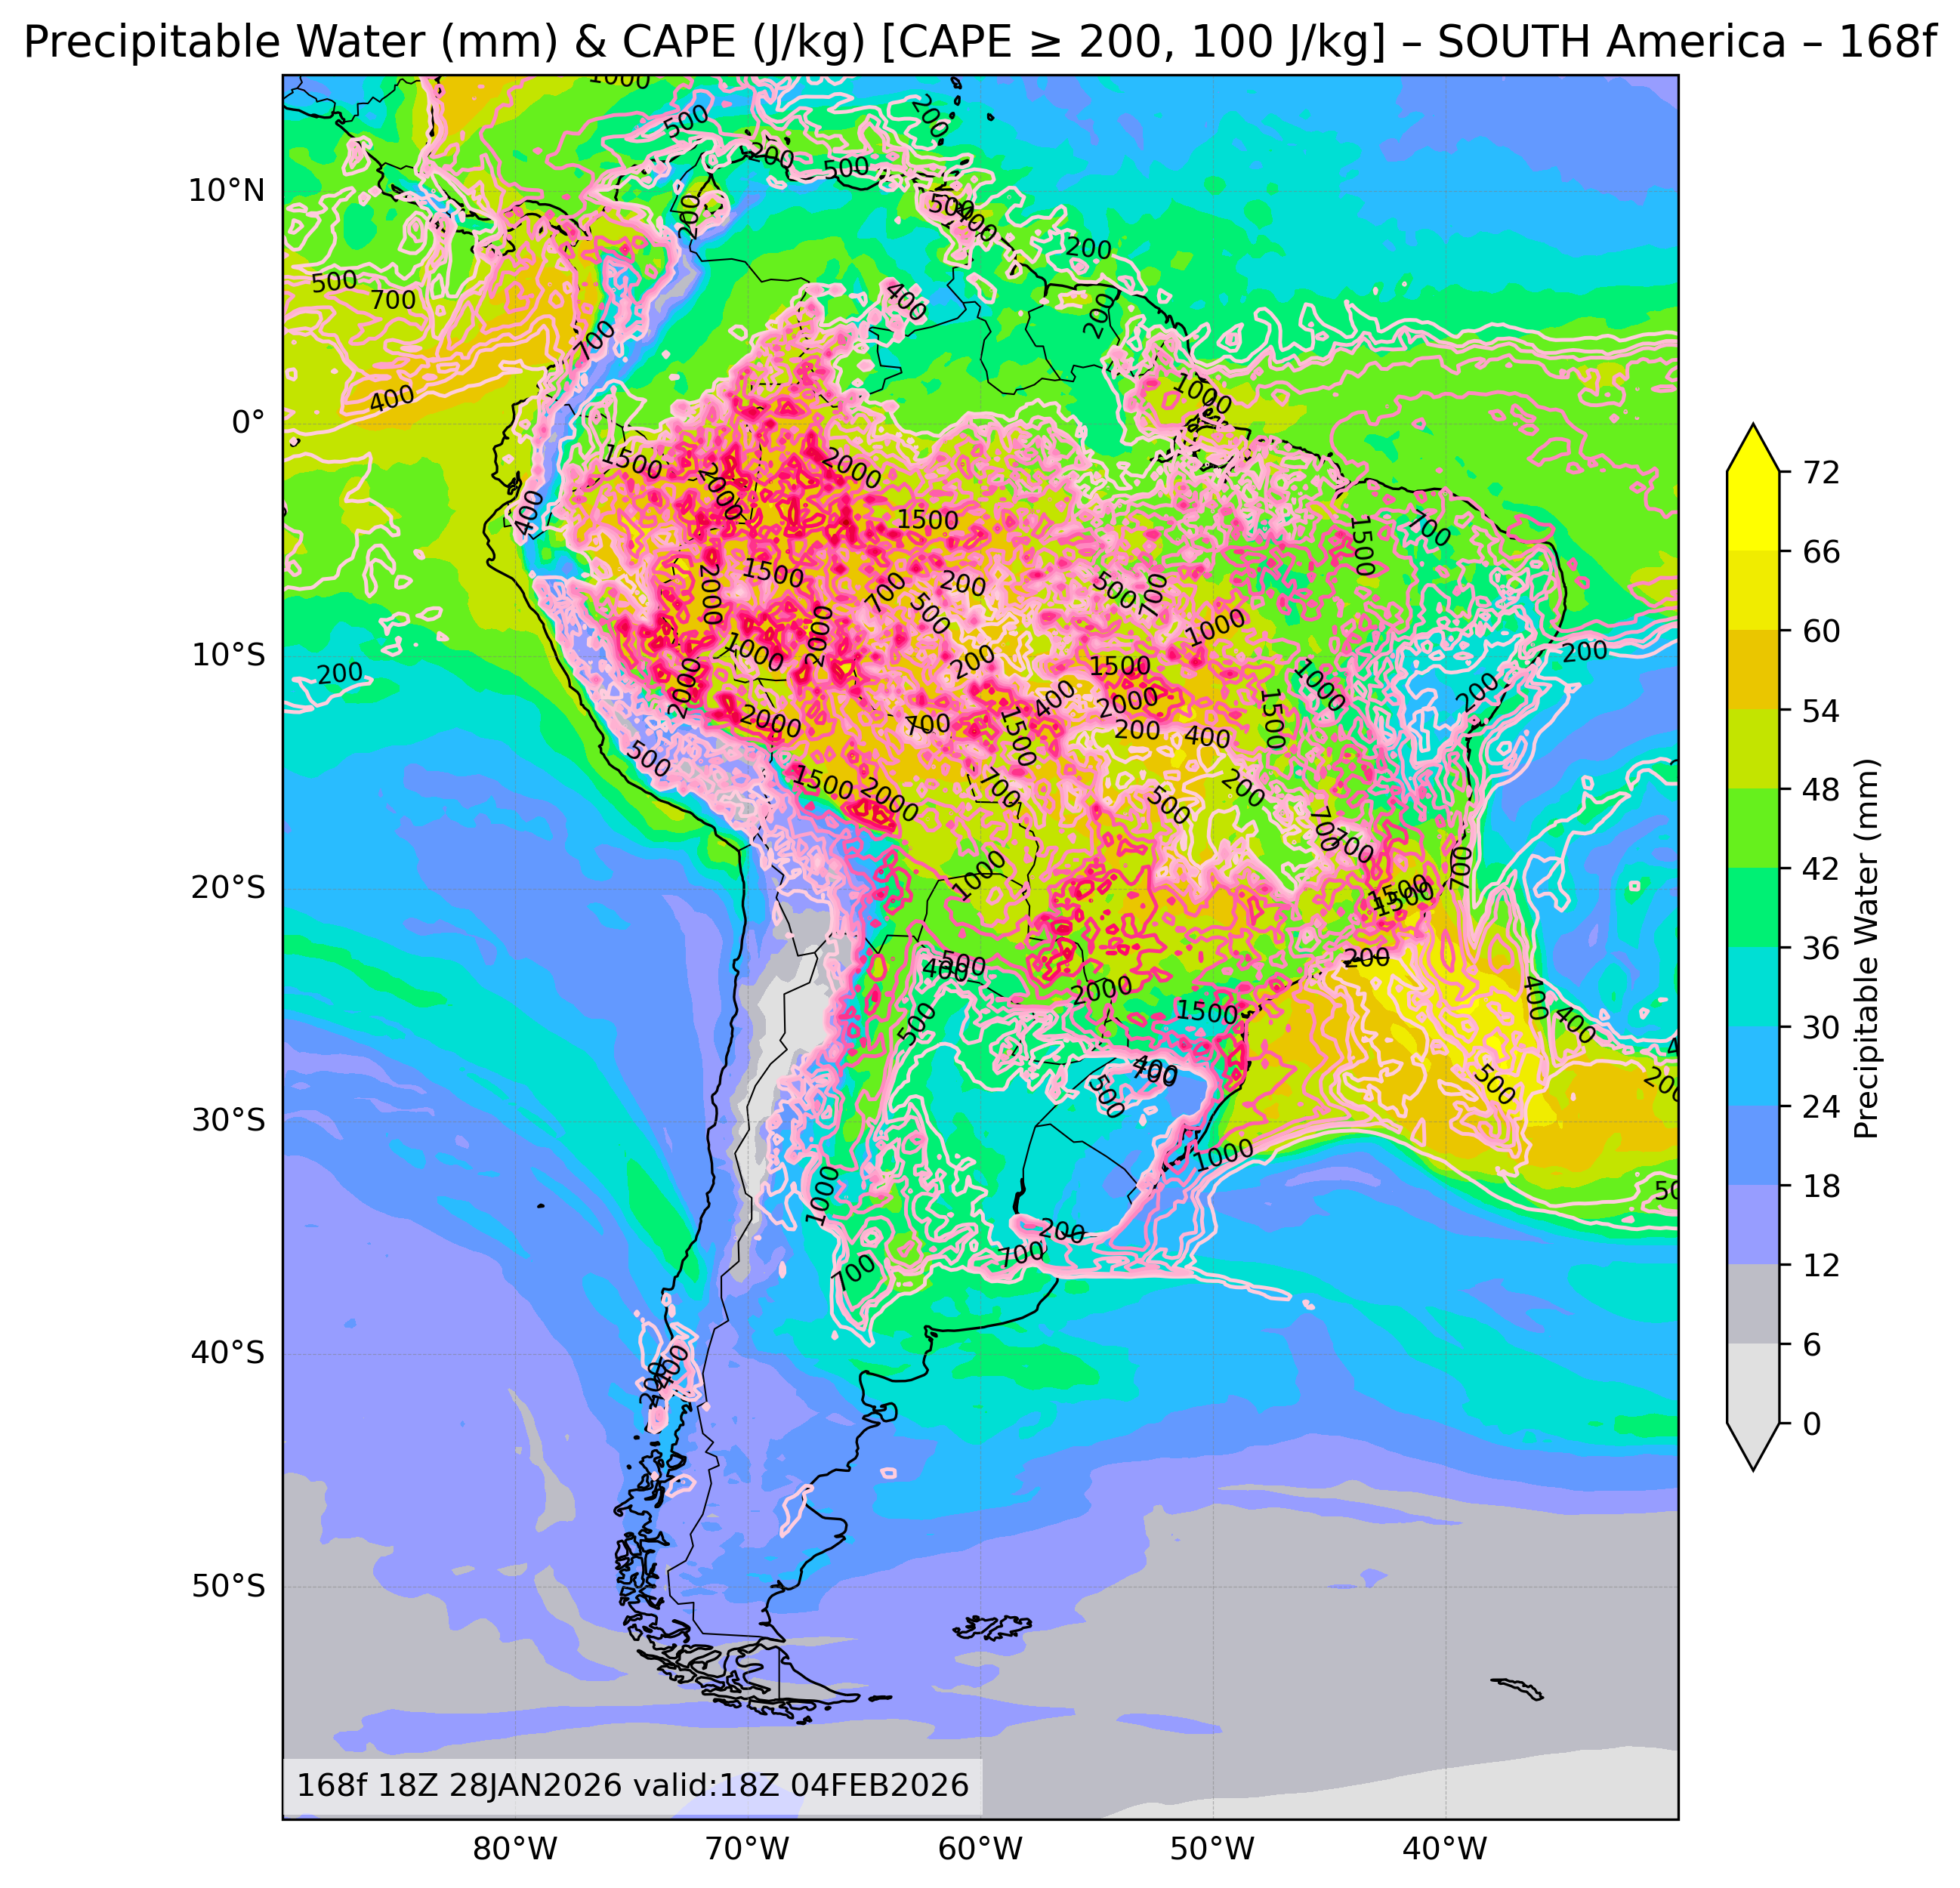
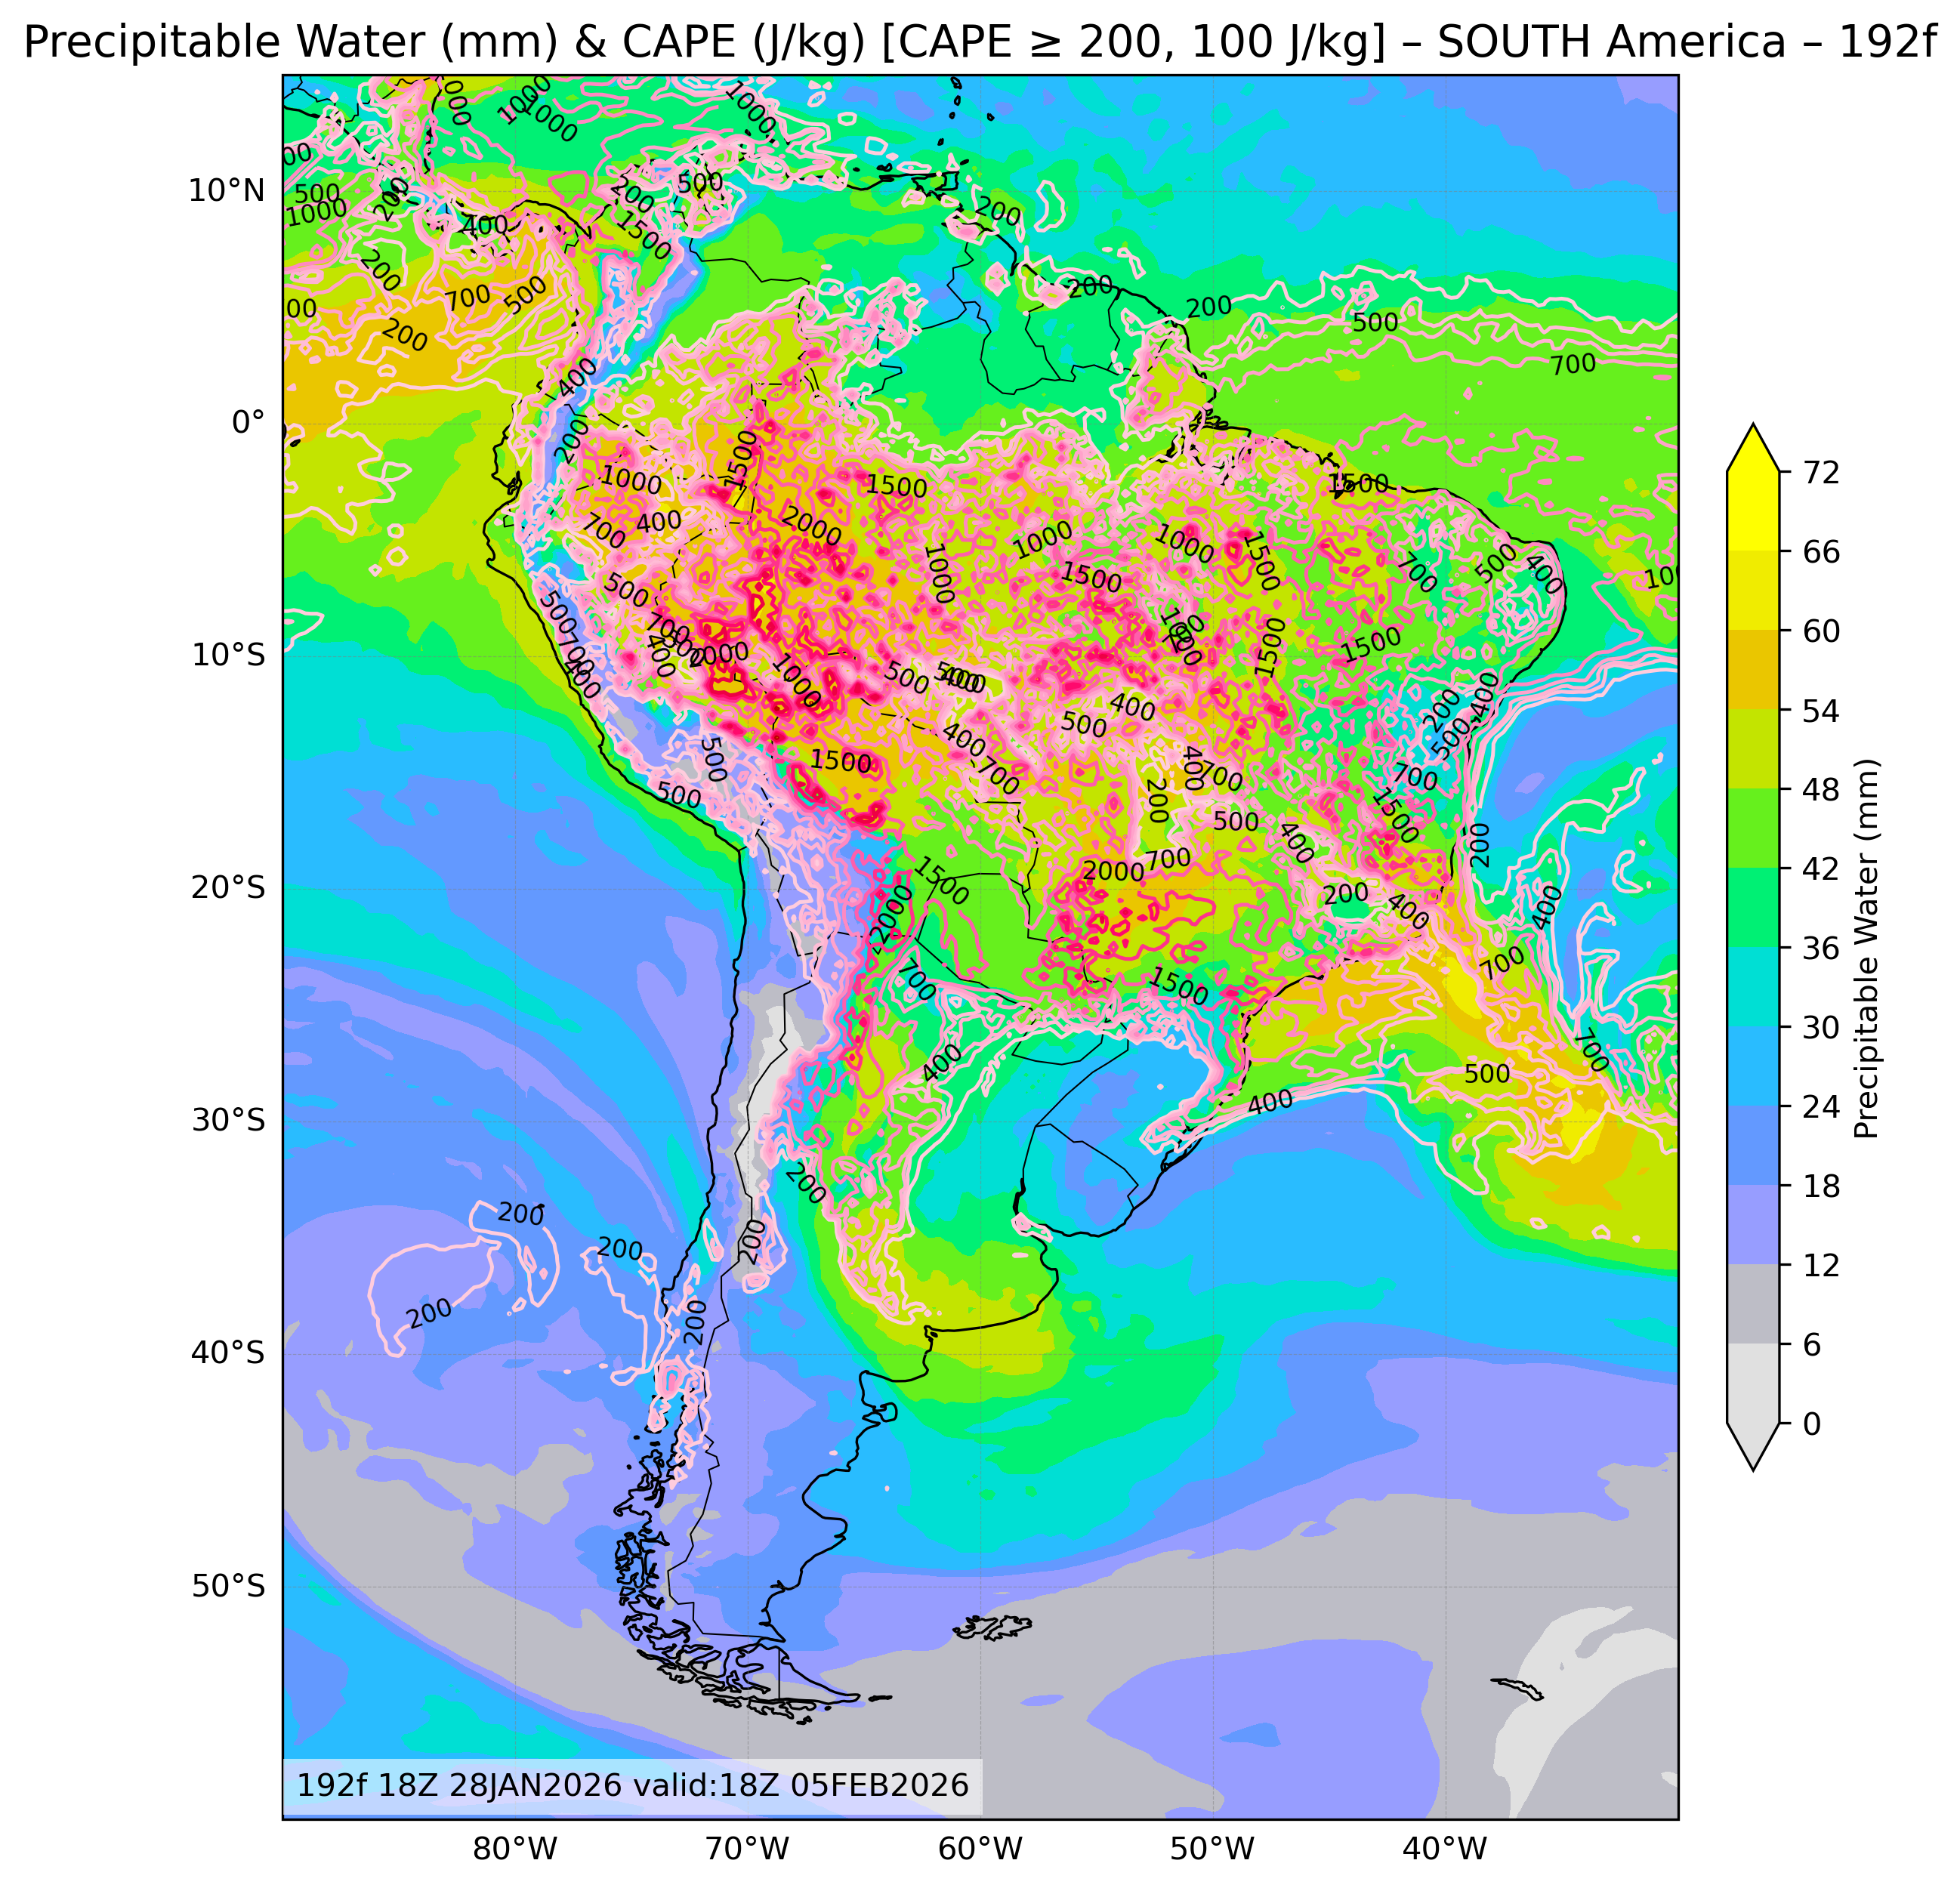
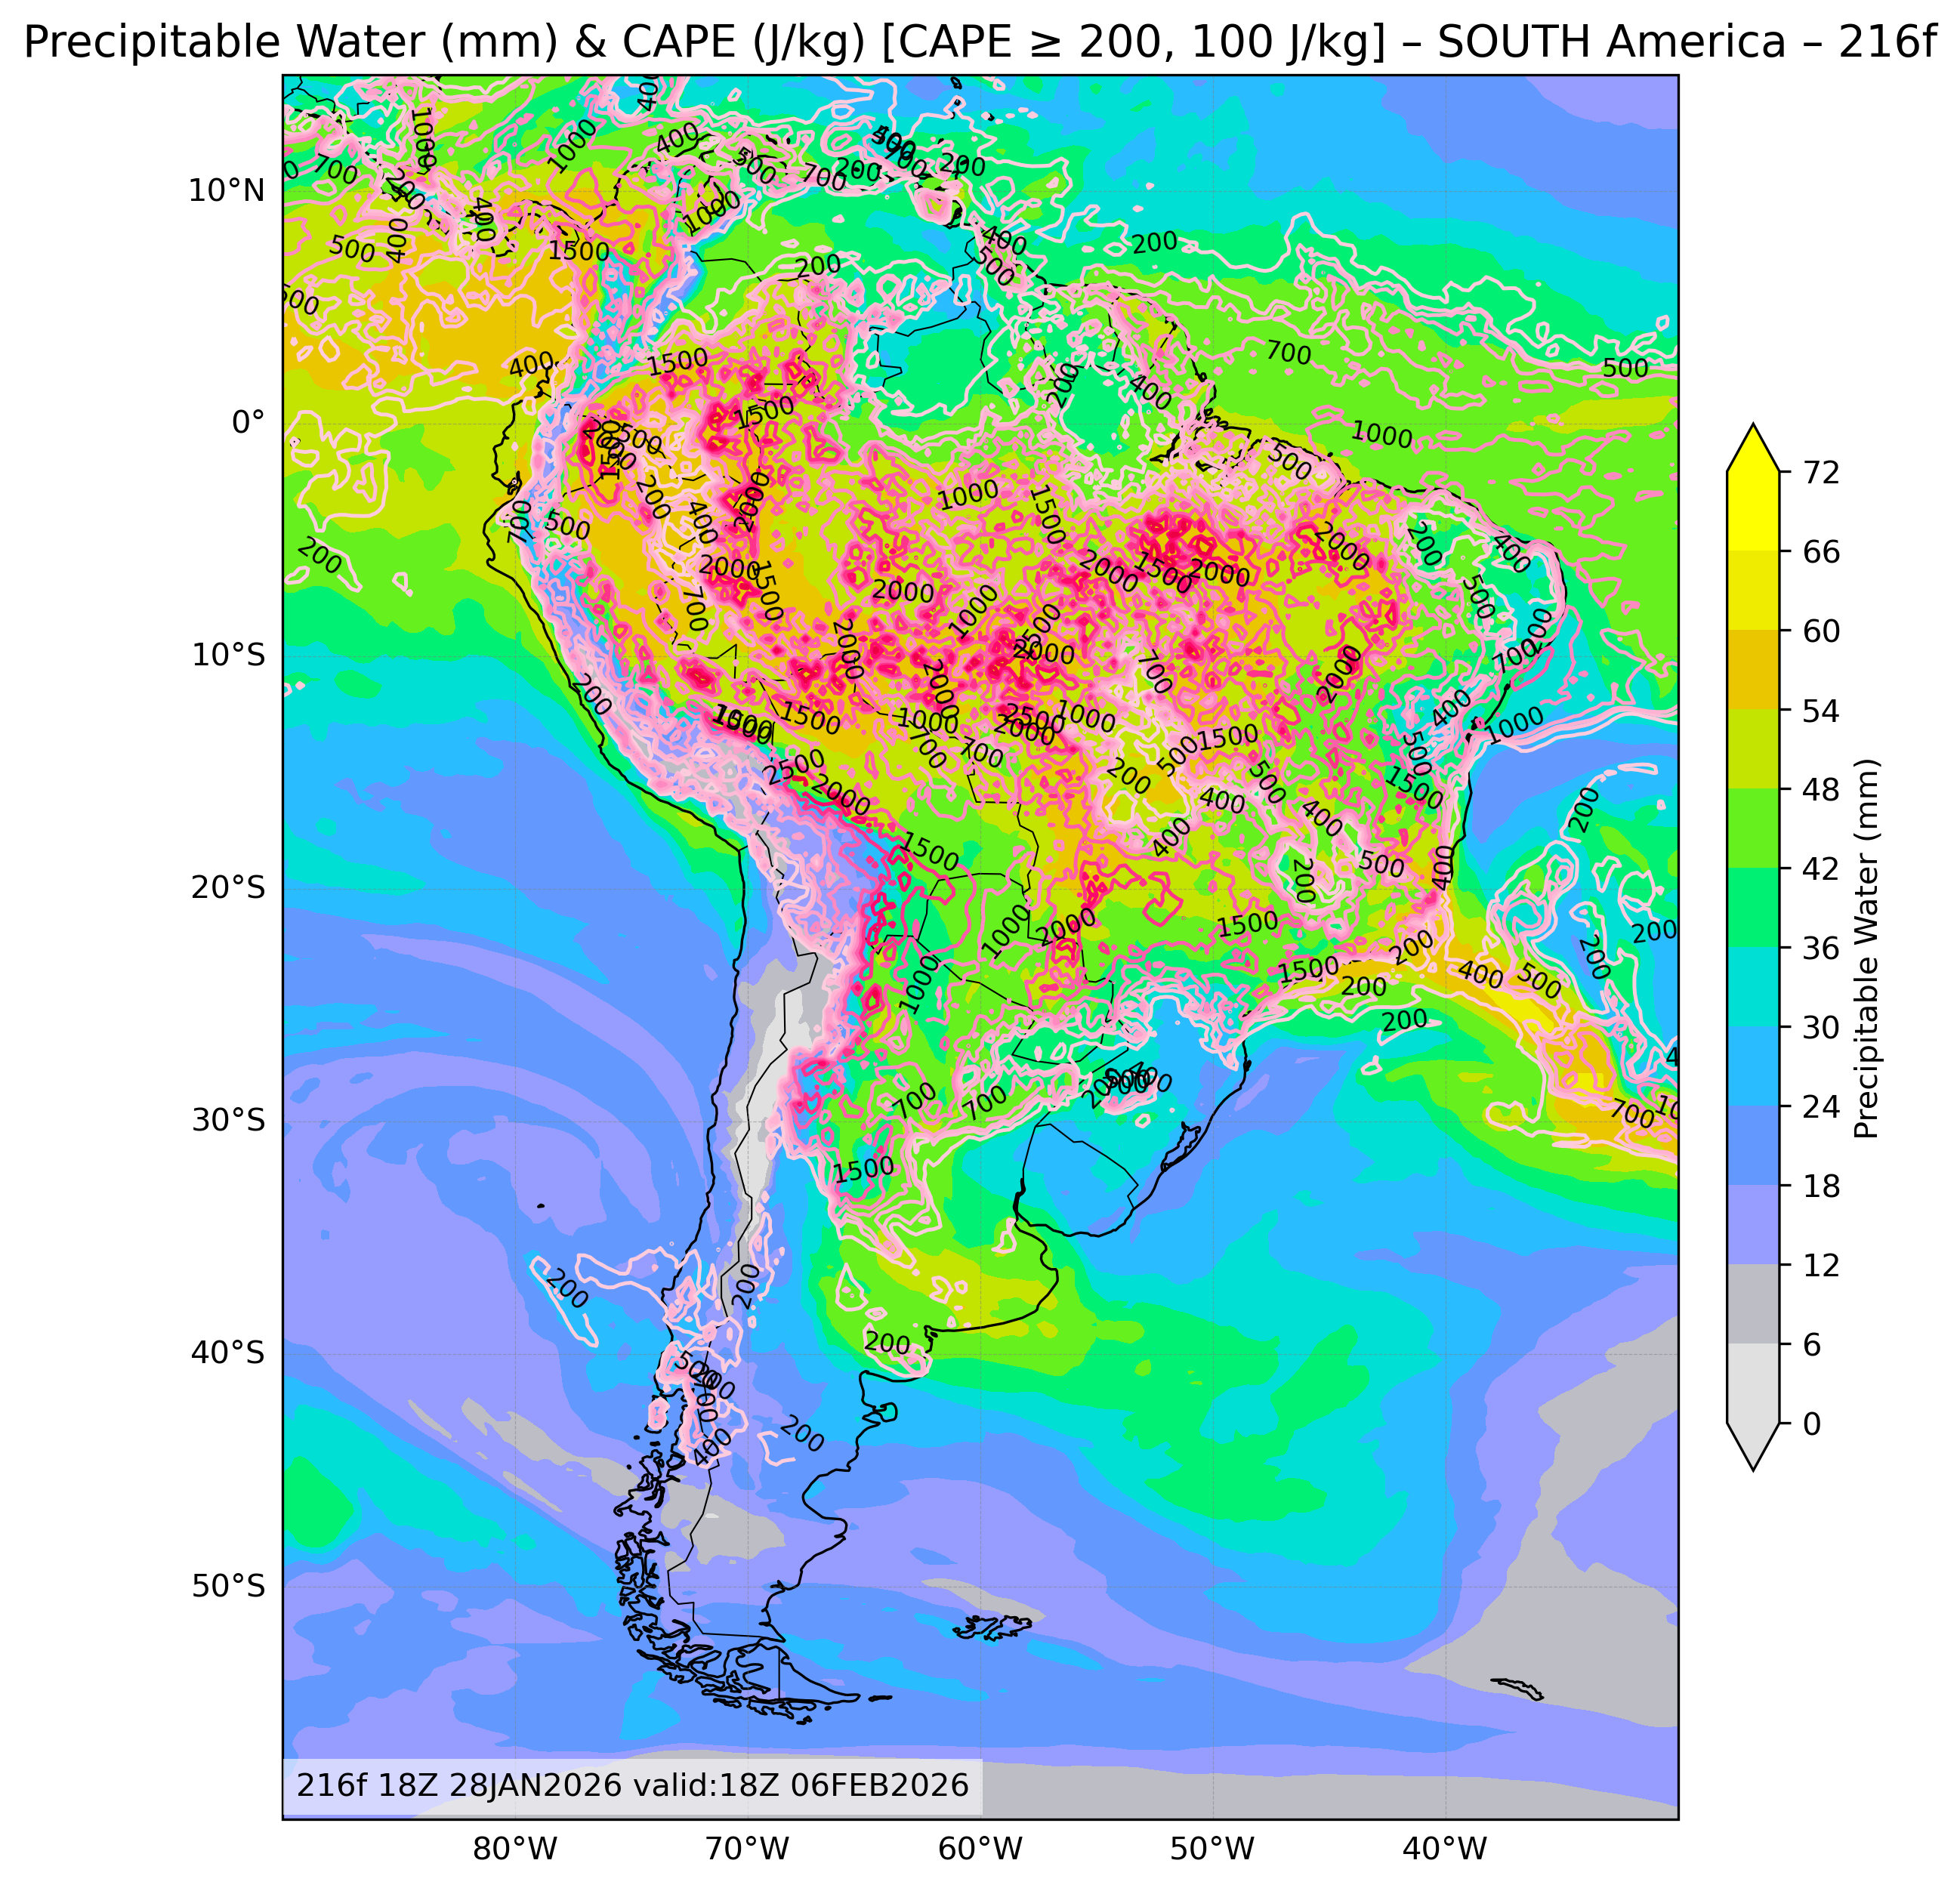
| Precipitable Water & Convective Available Potential Energy |
All Times |
🔍 | 🔍 | 🔍 | 🔍 | 🔍 |
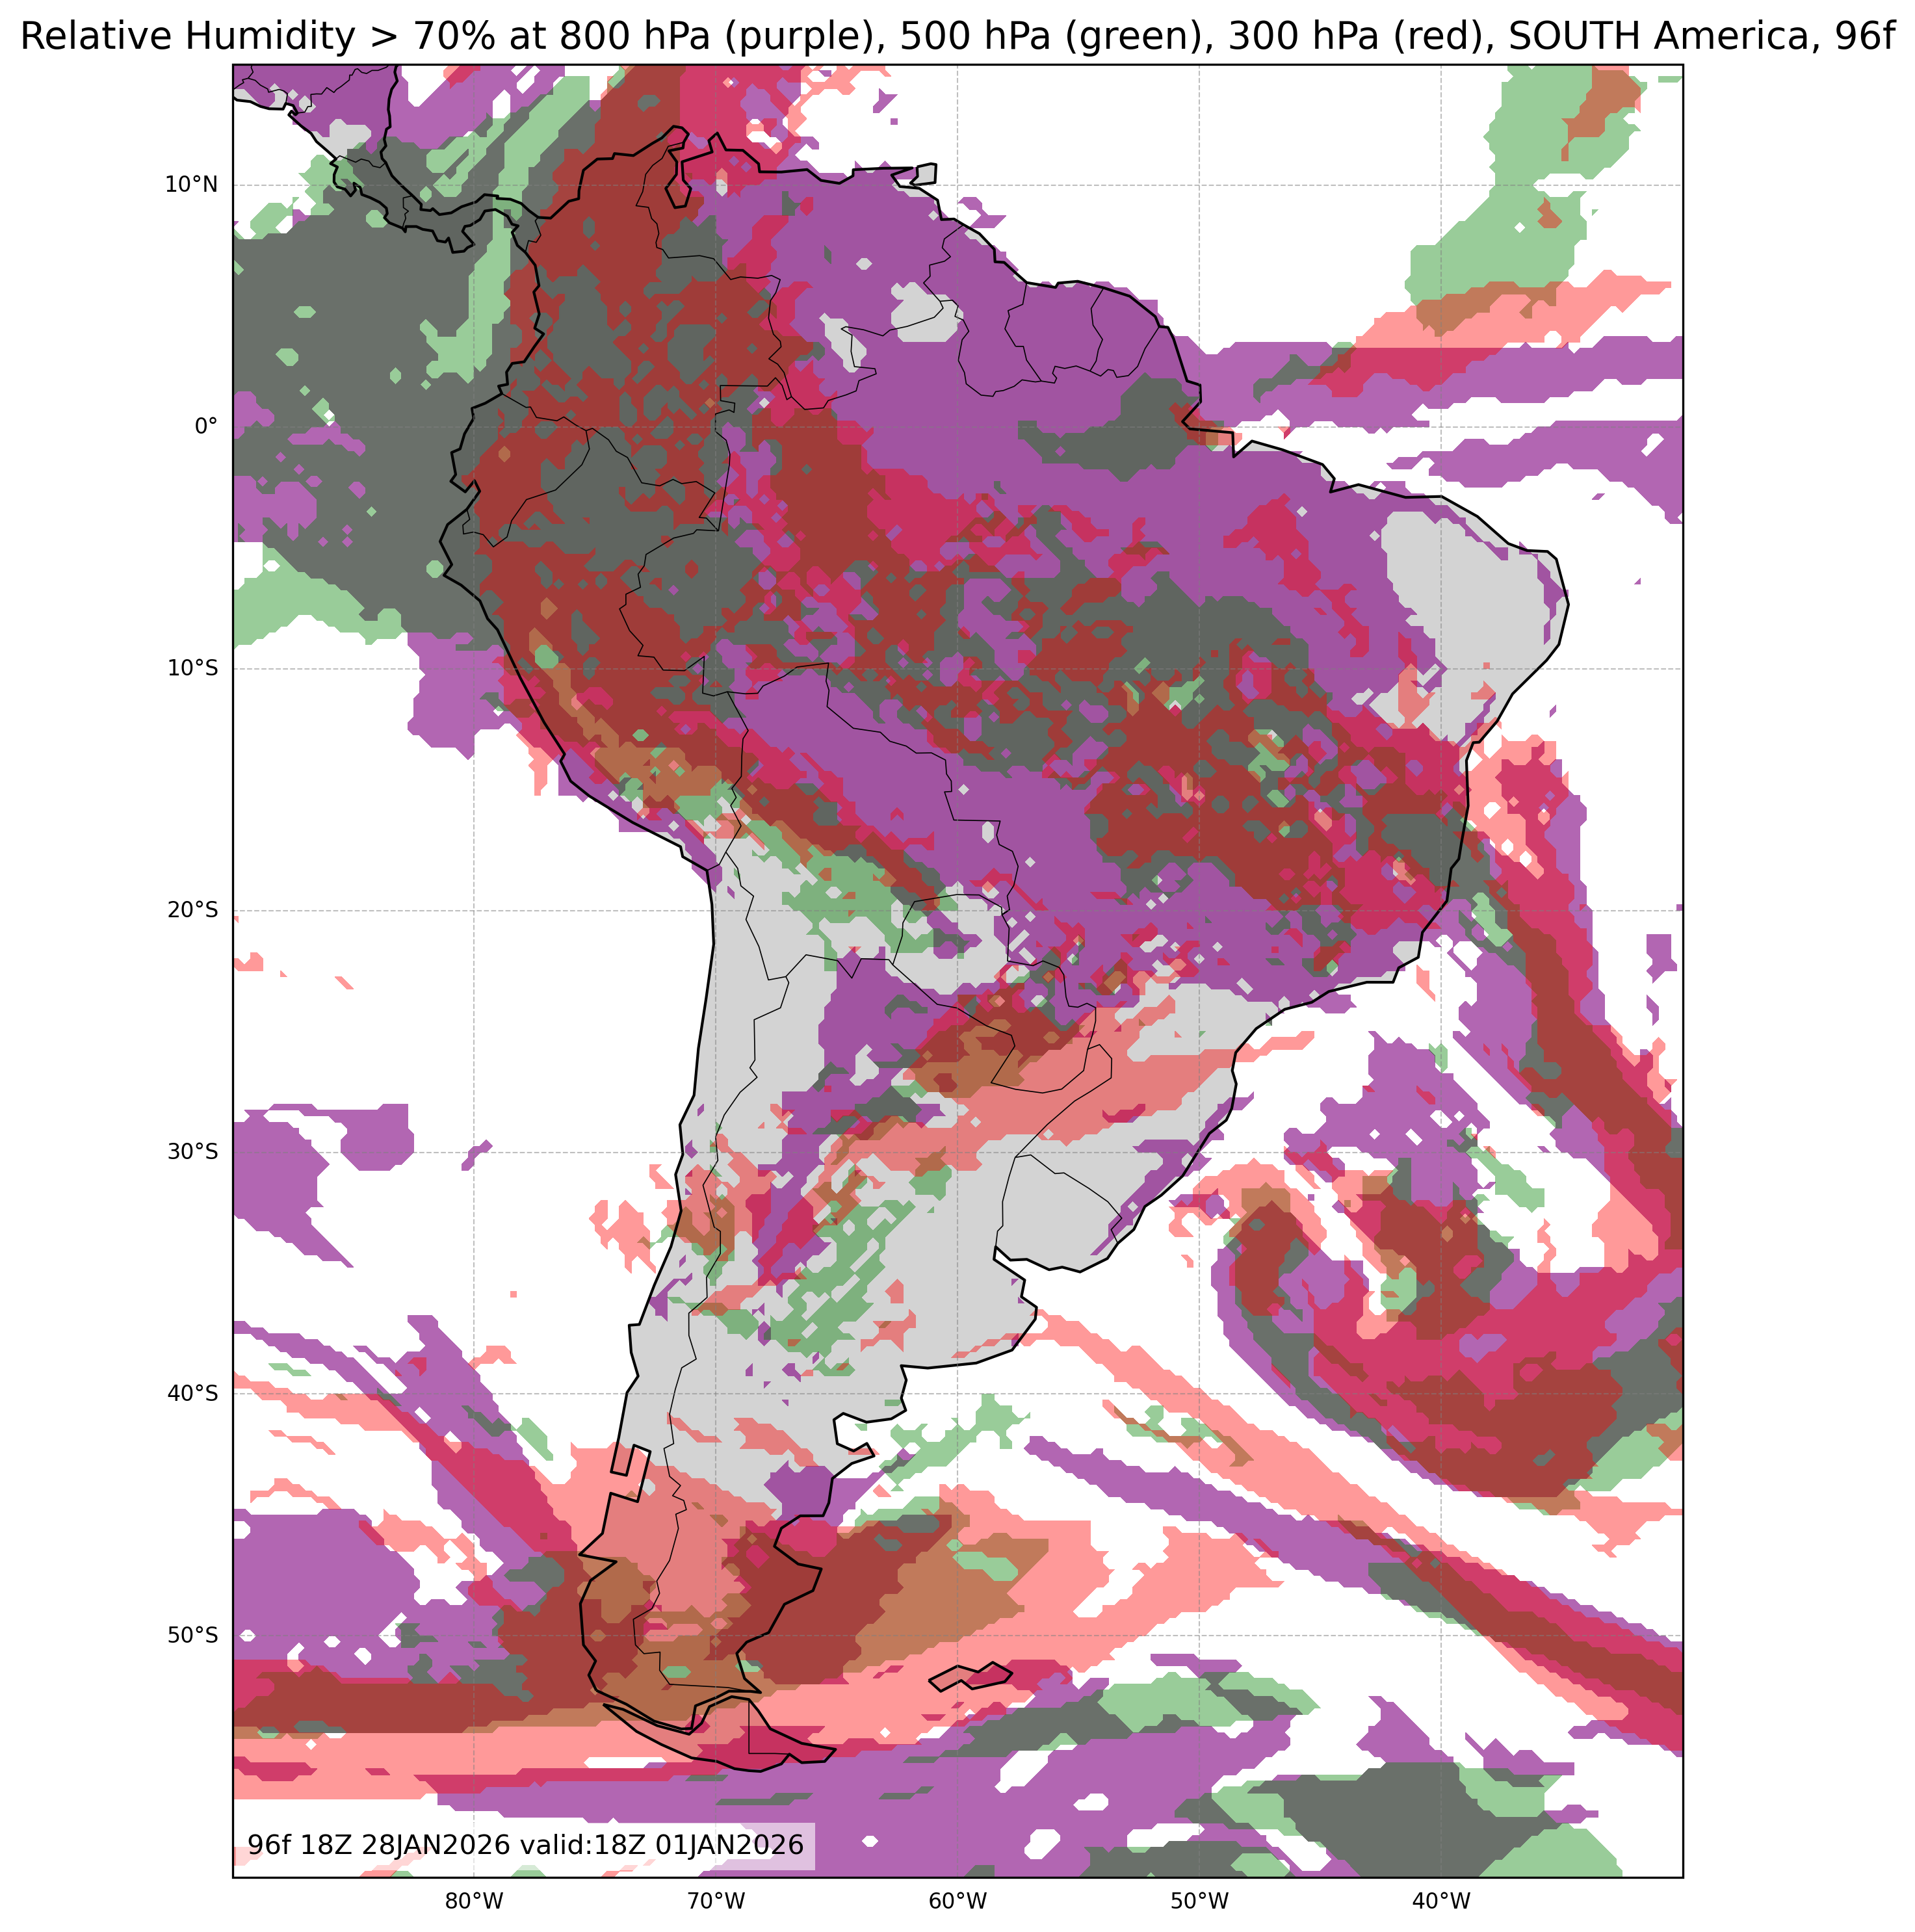
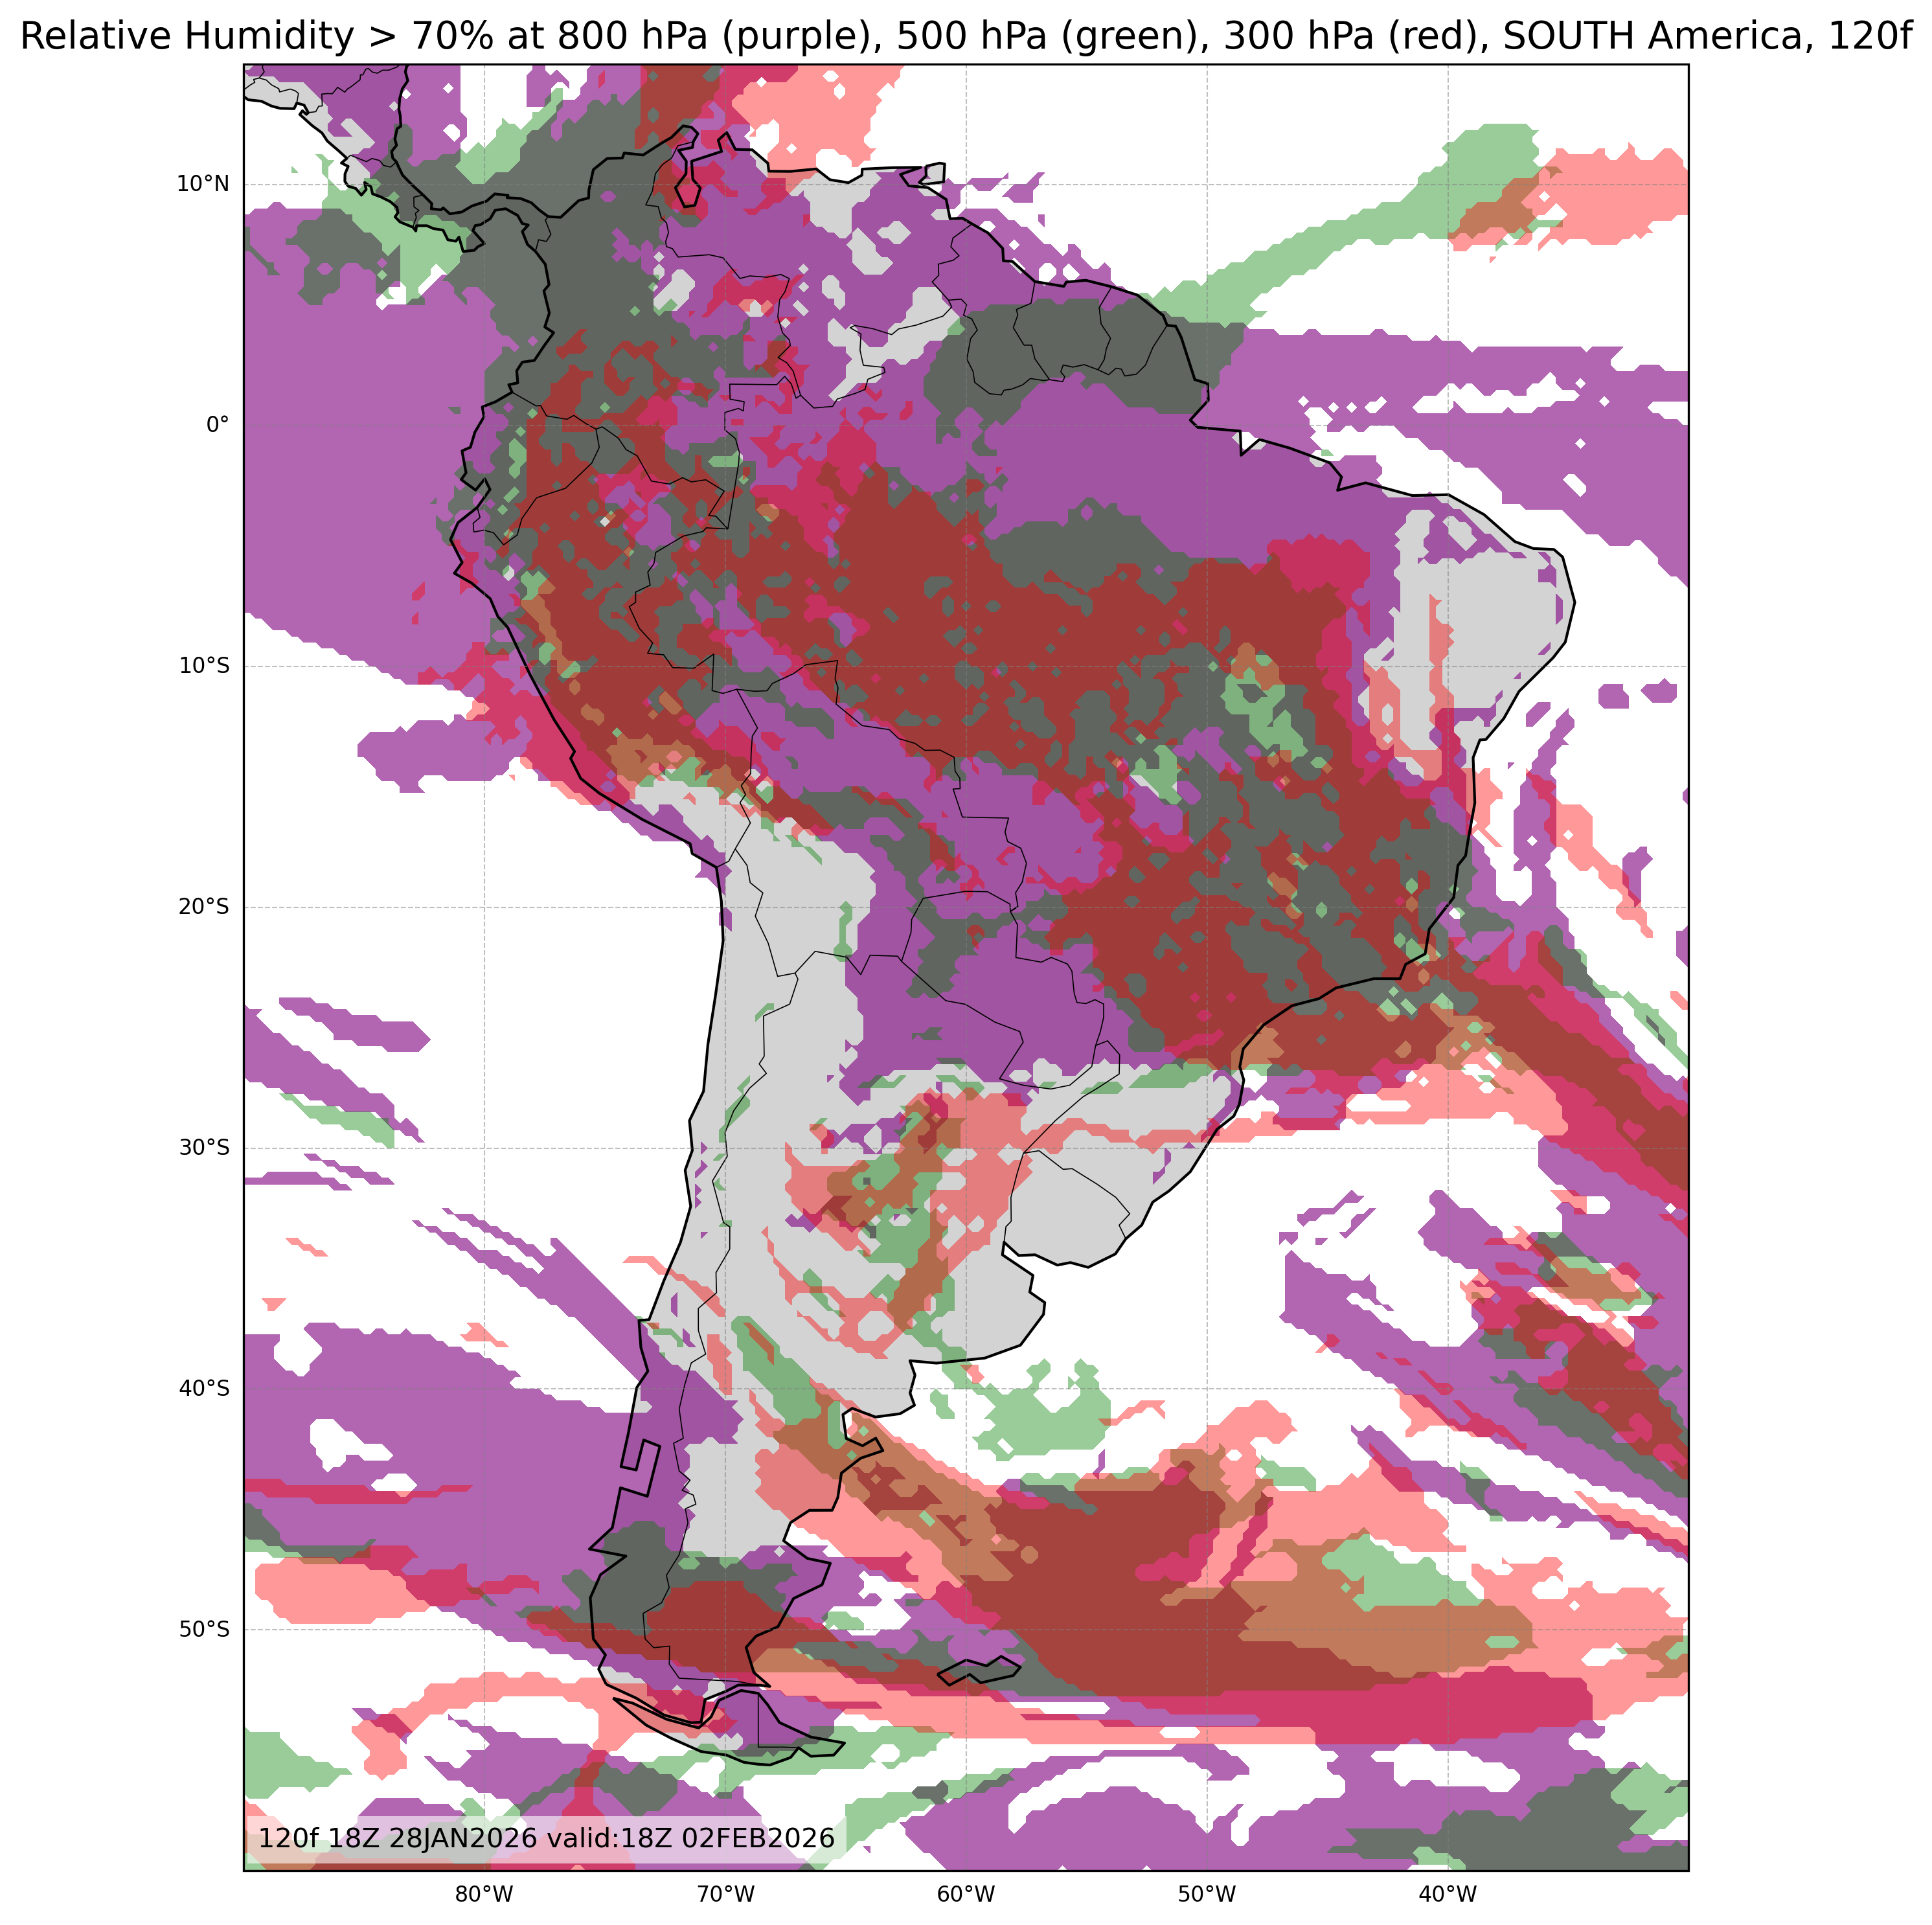
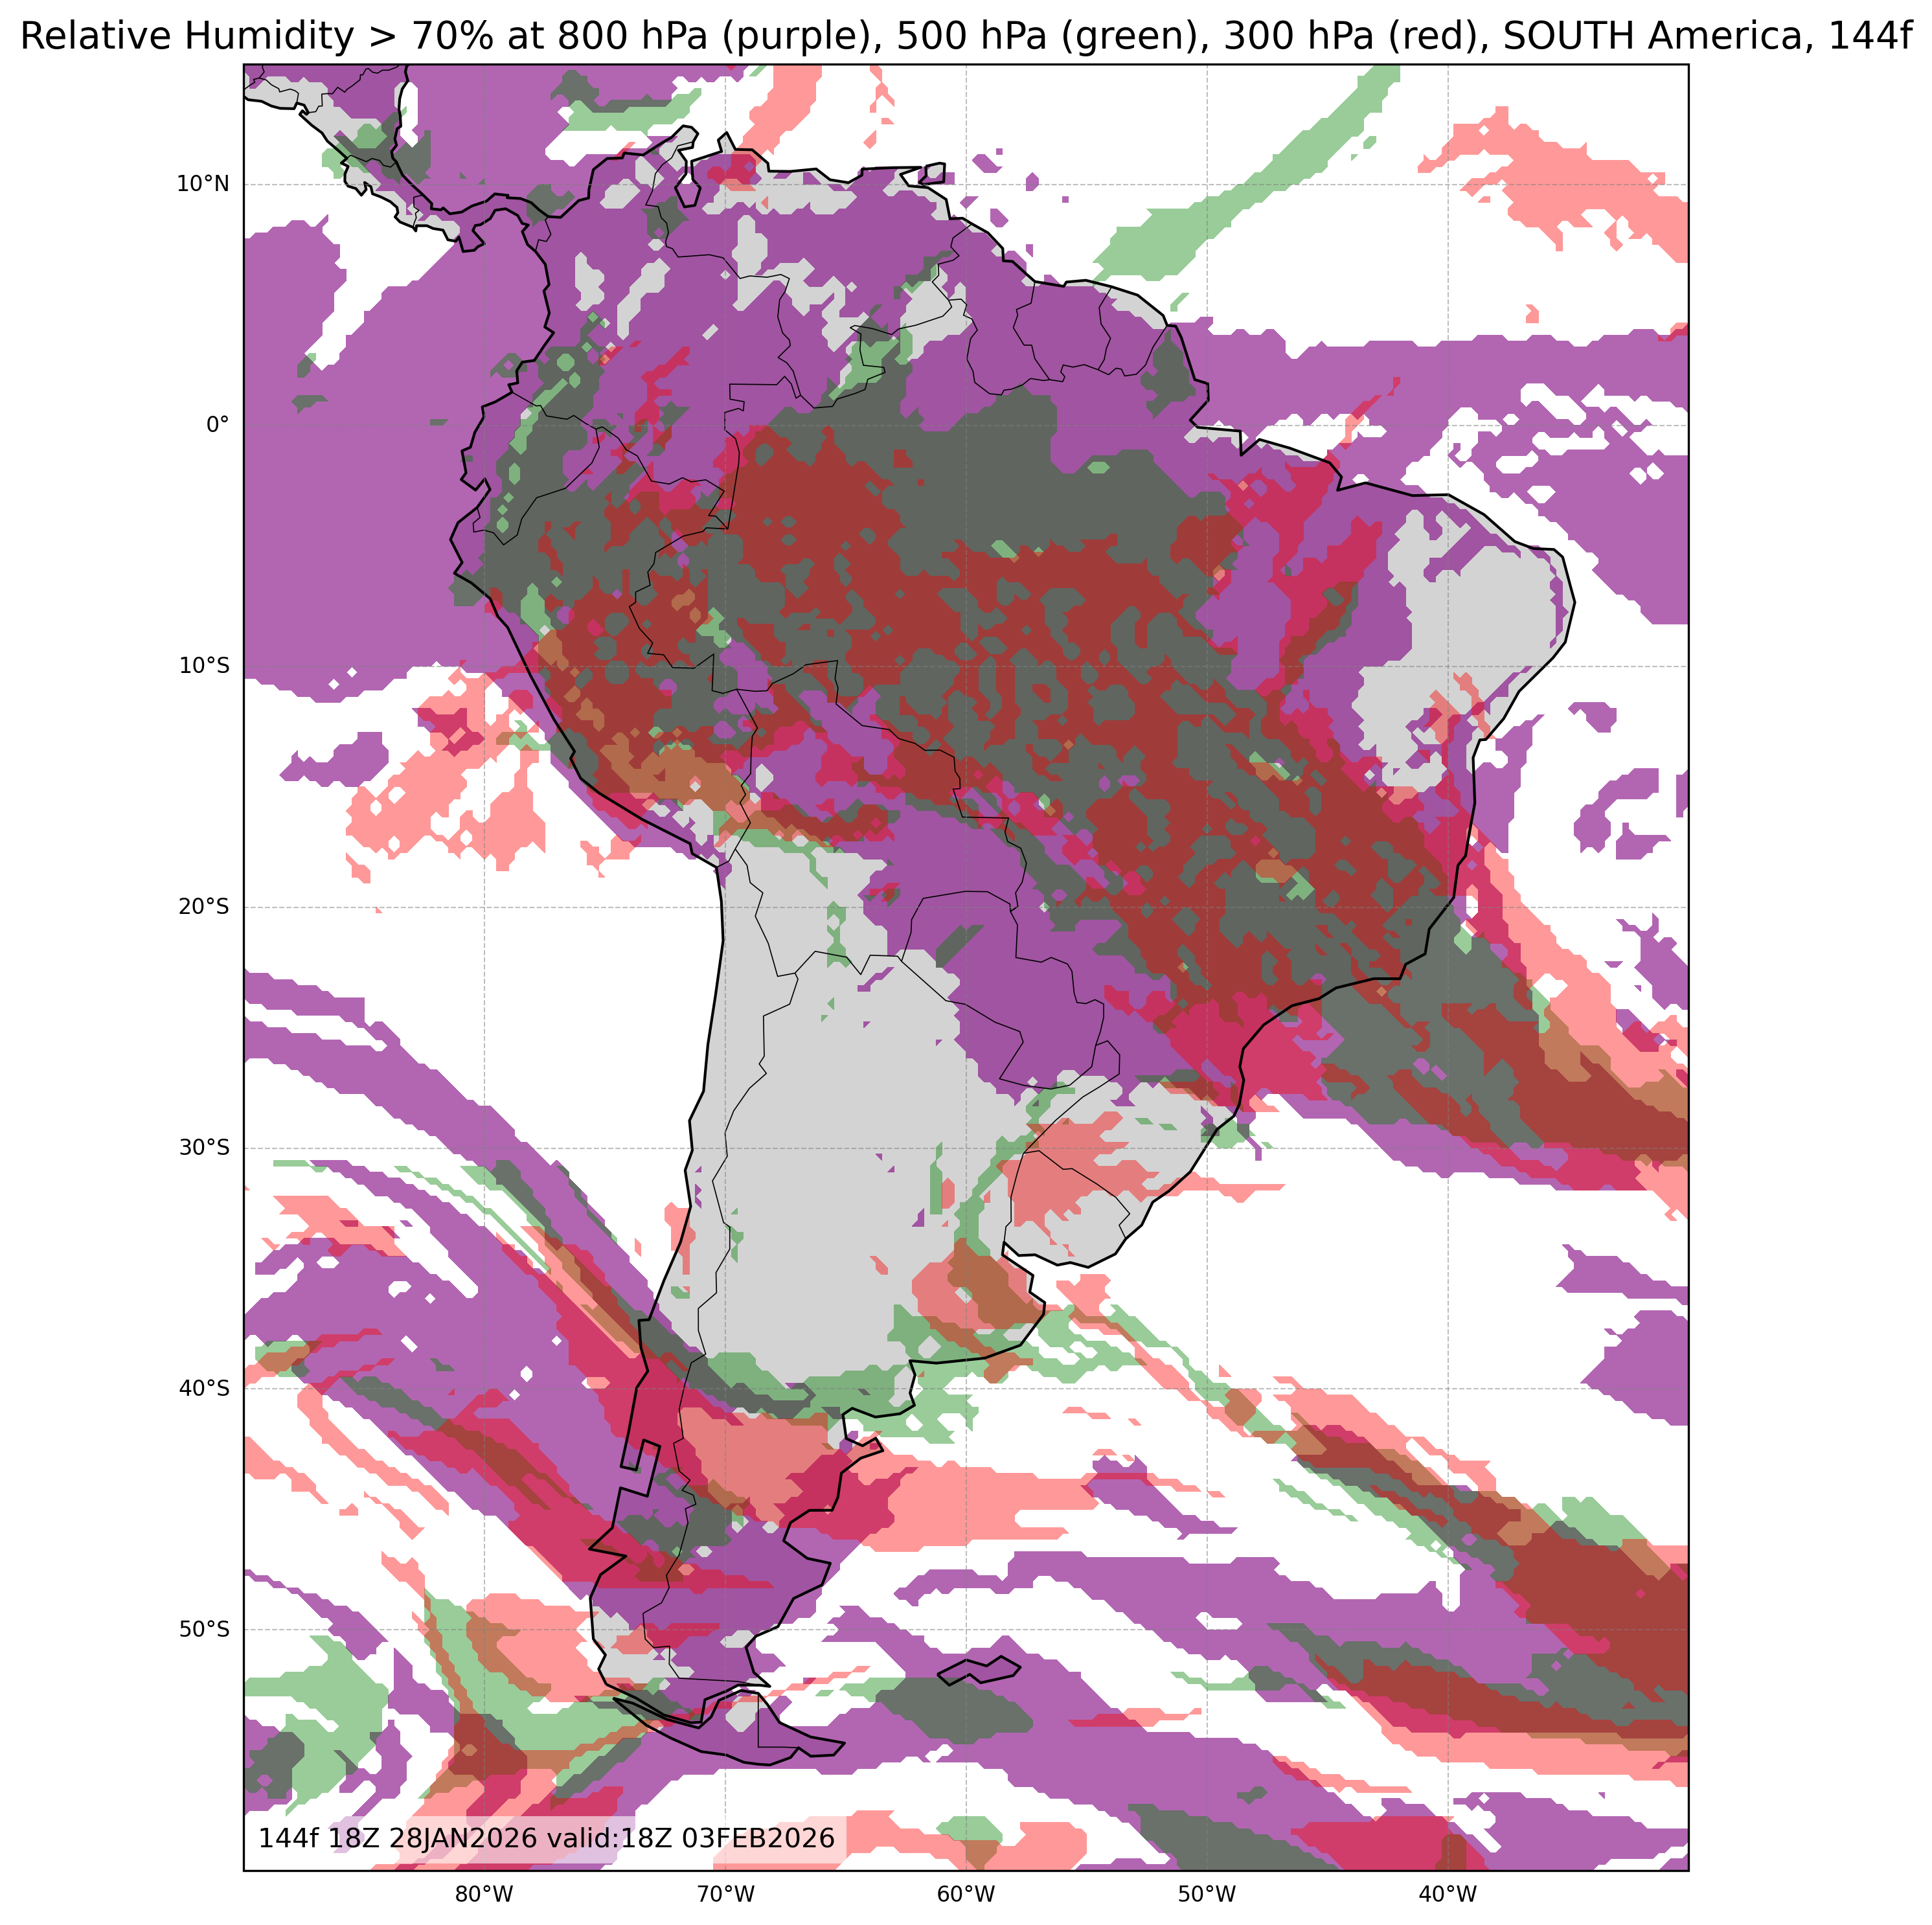
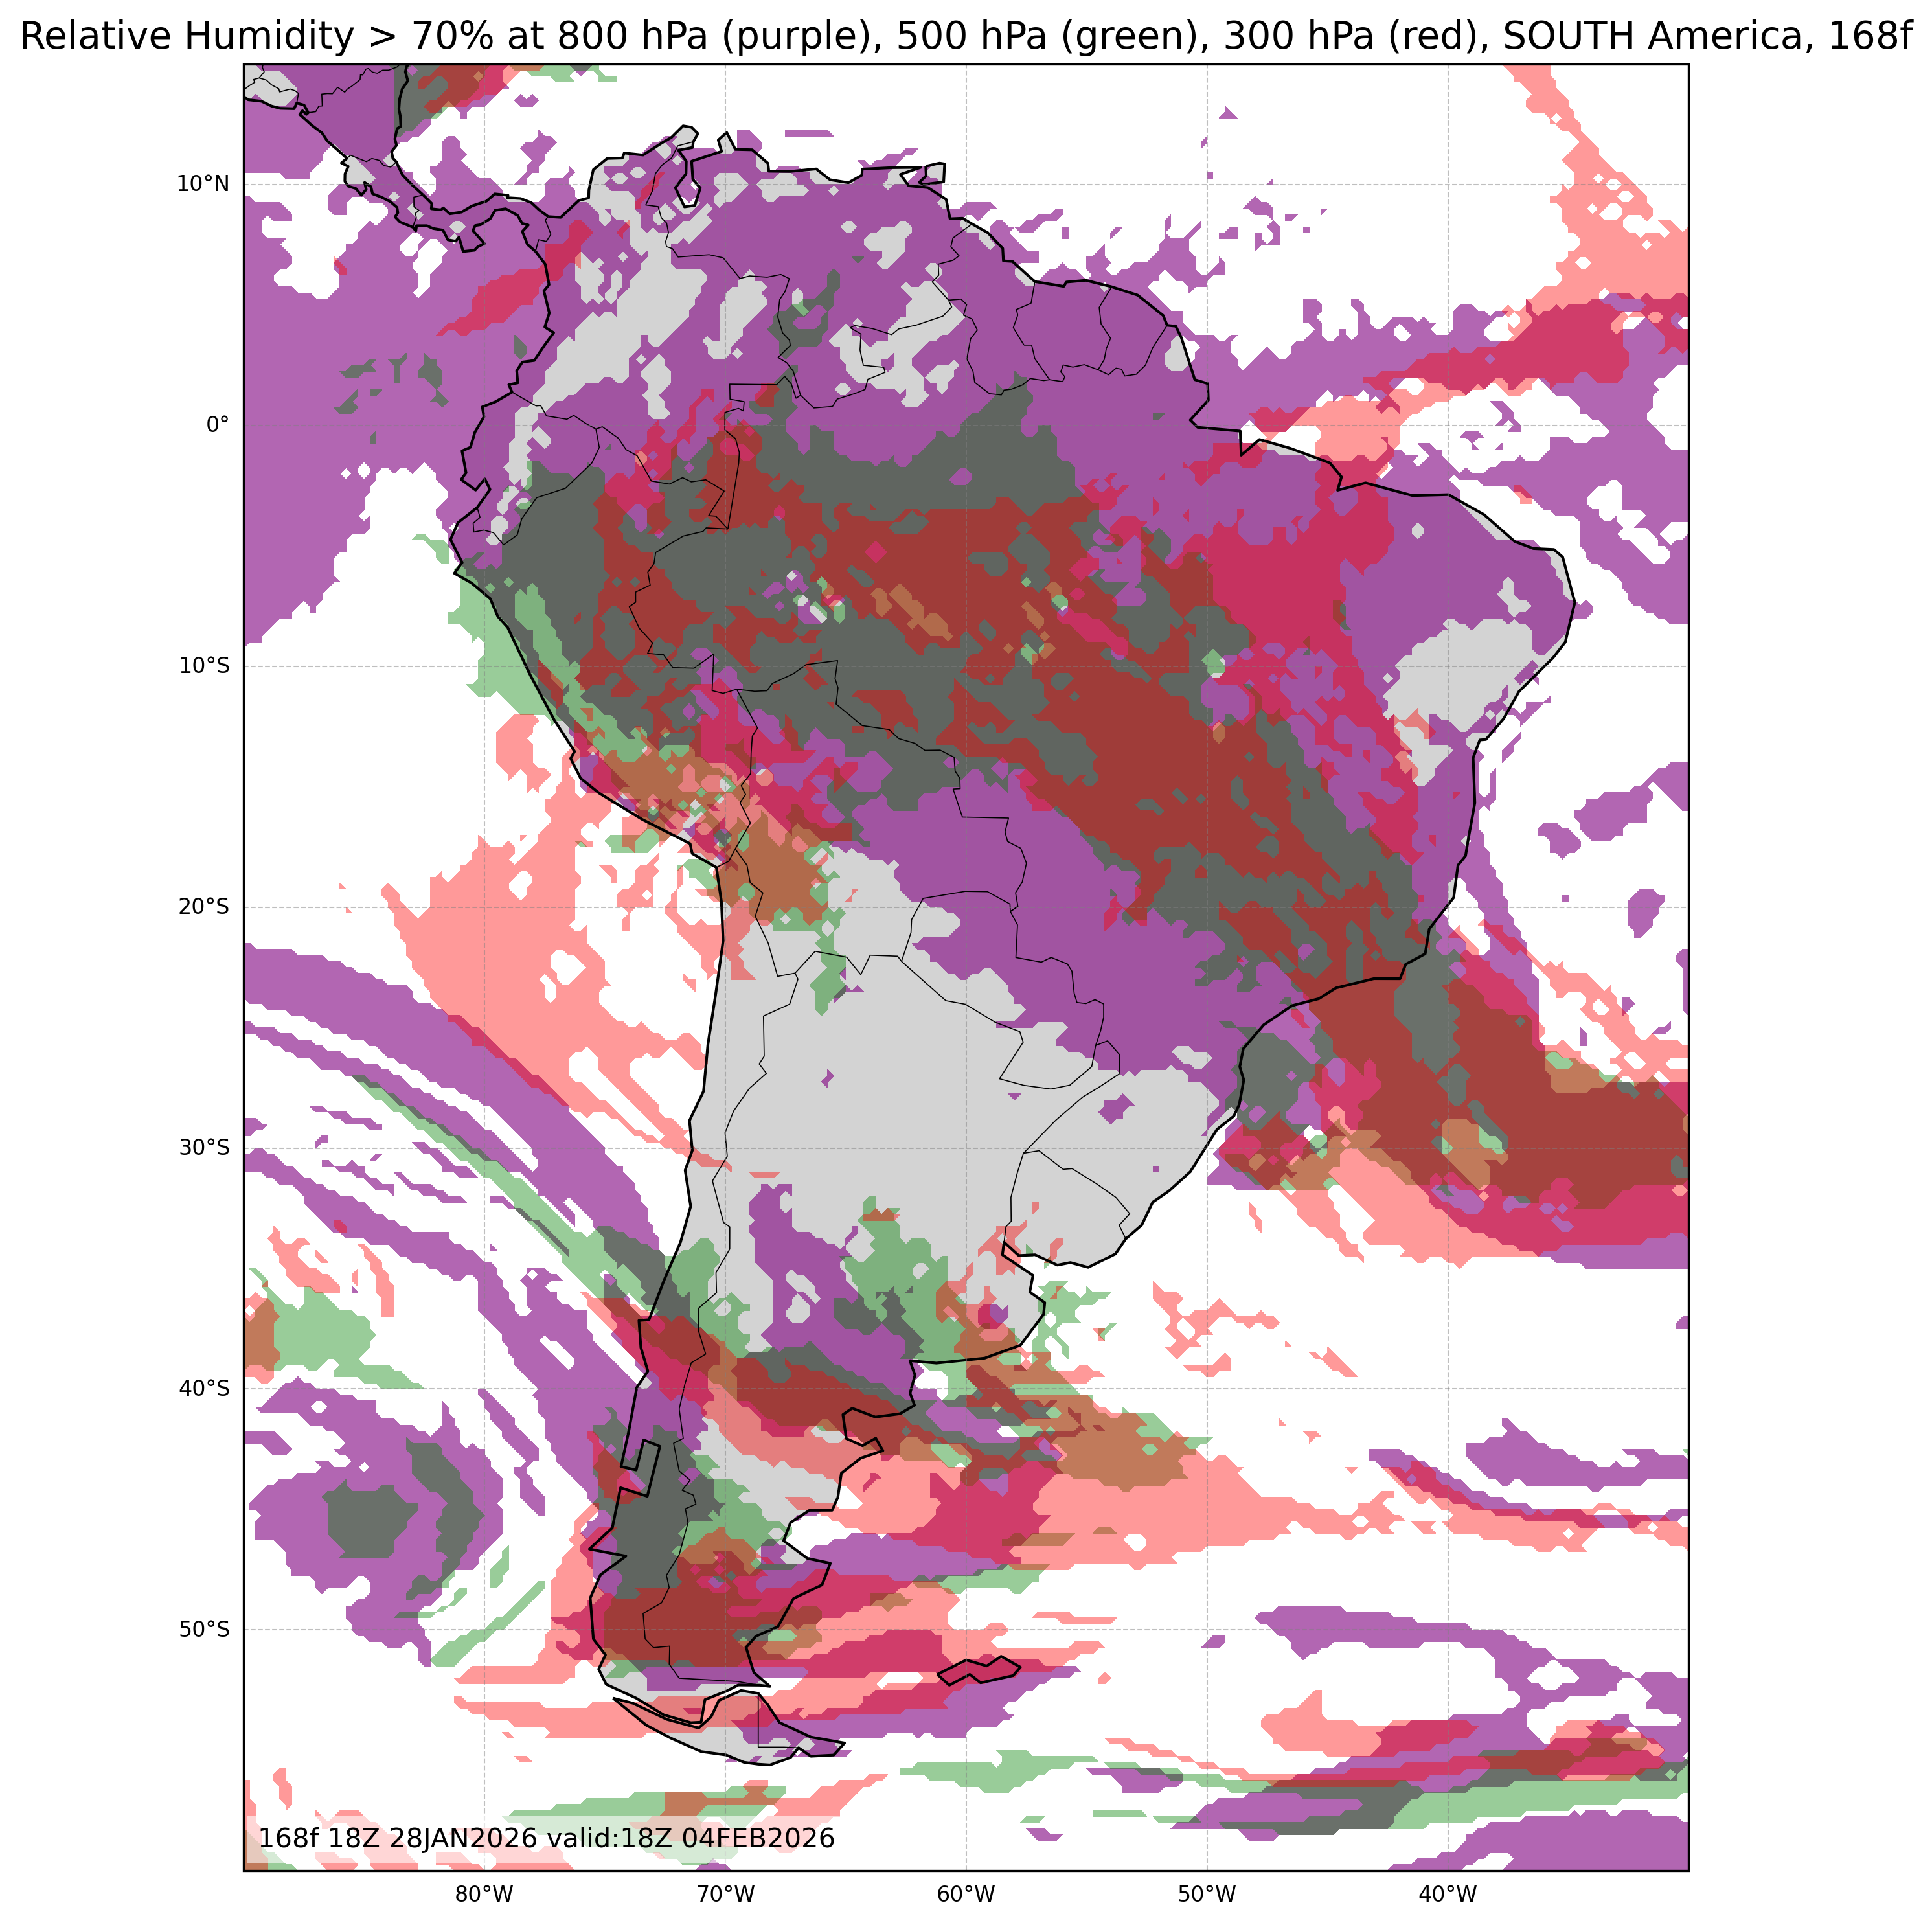
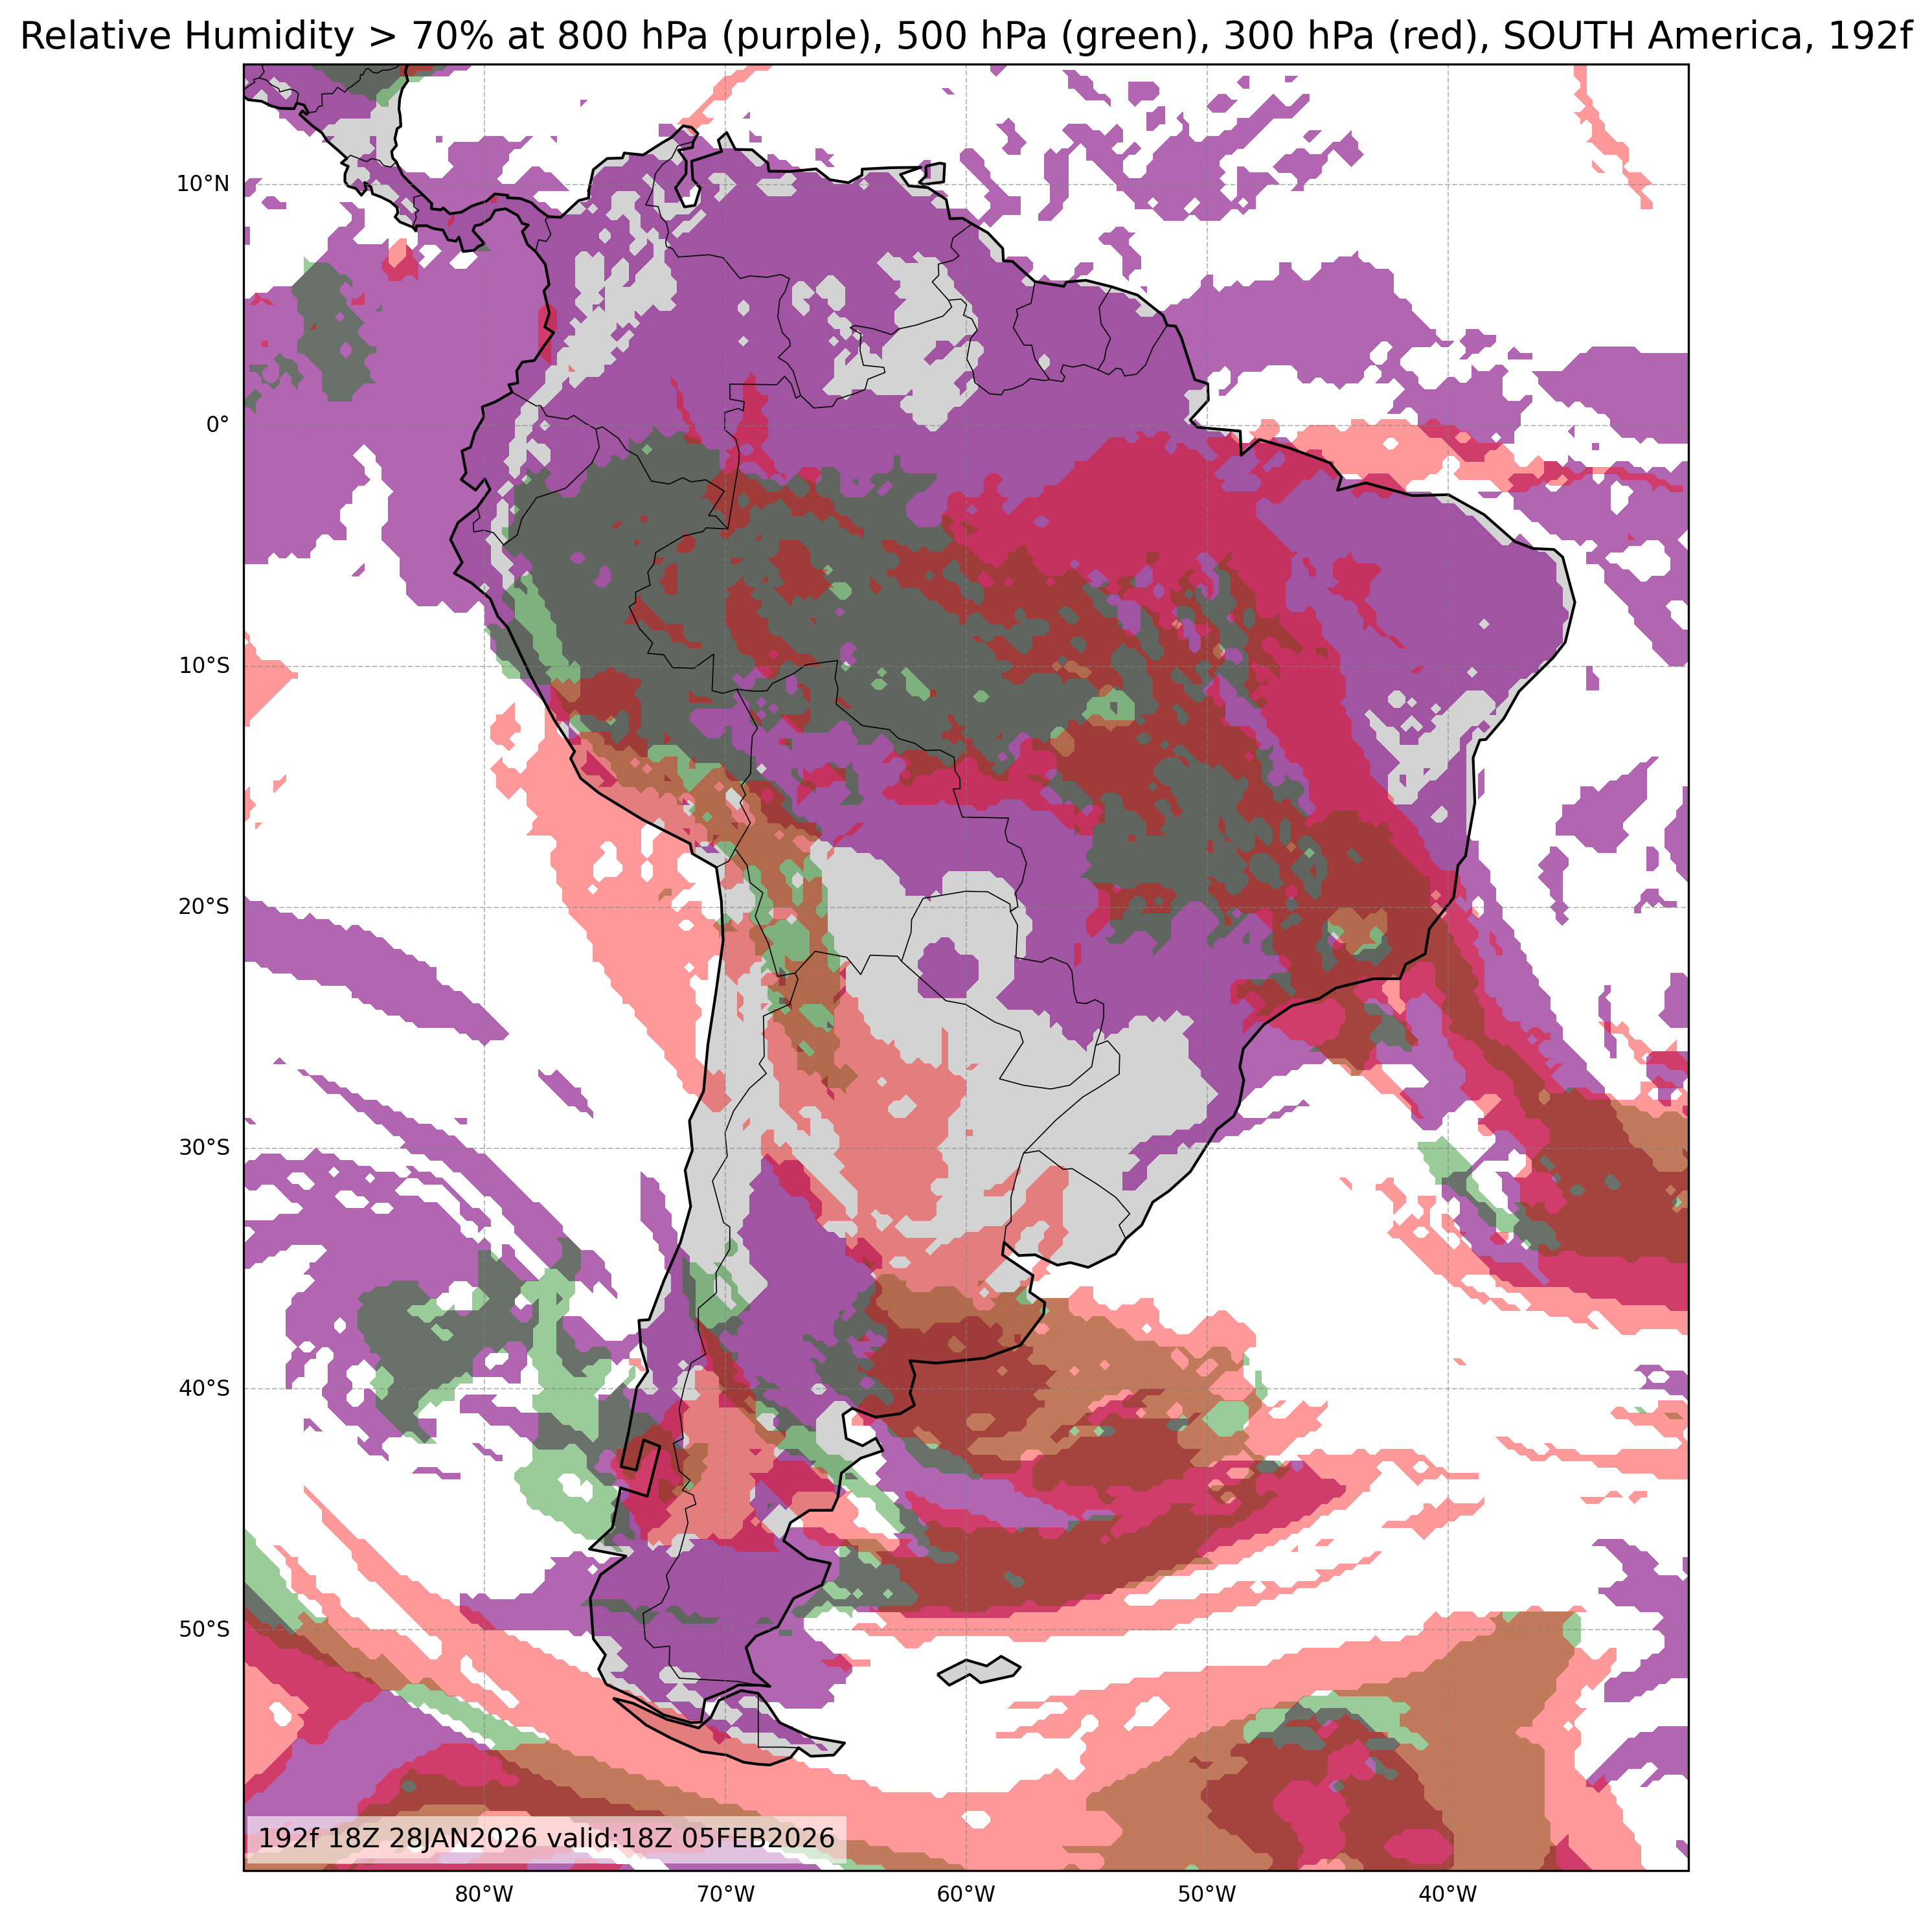
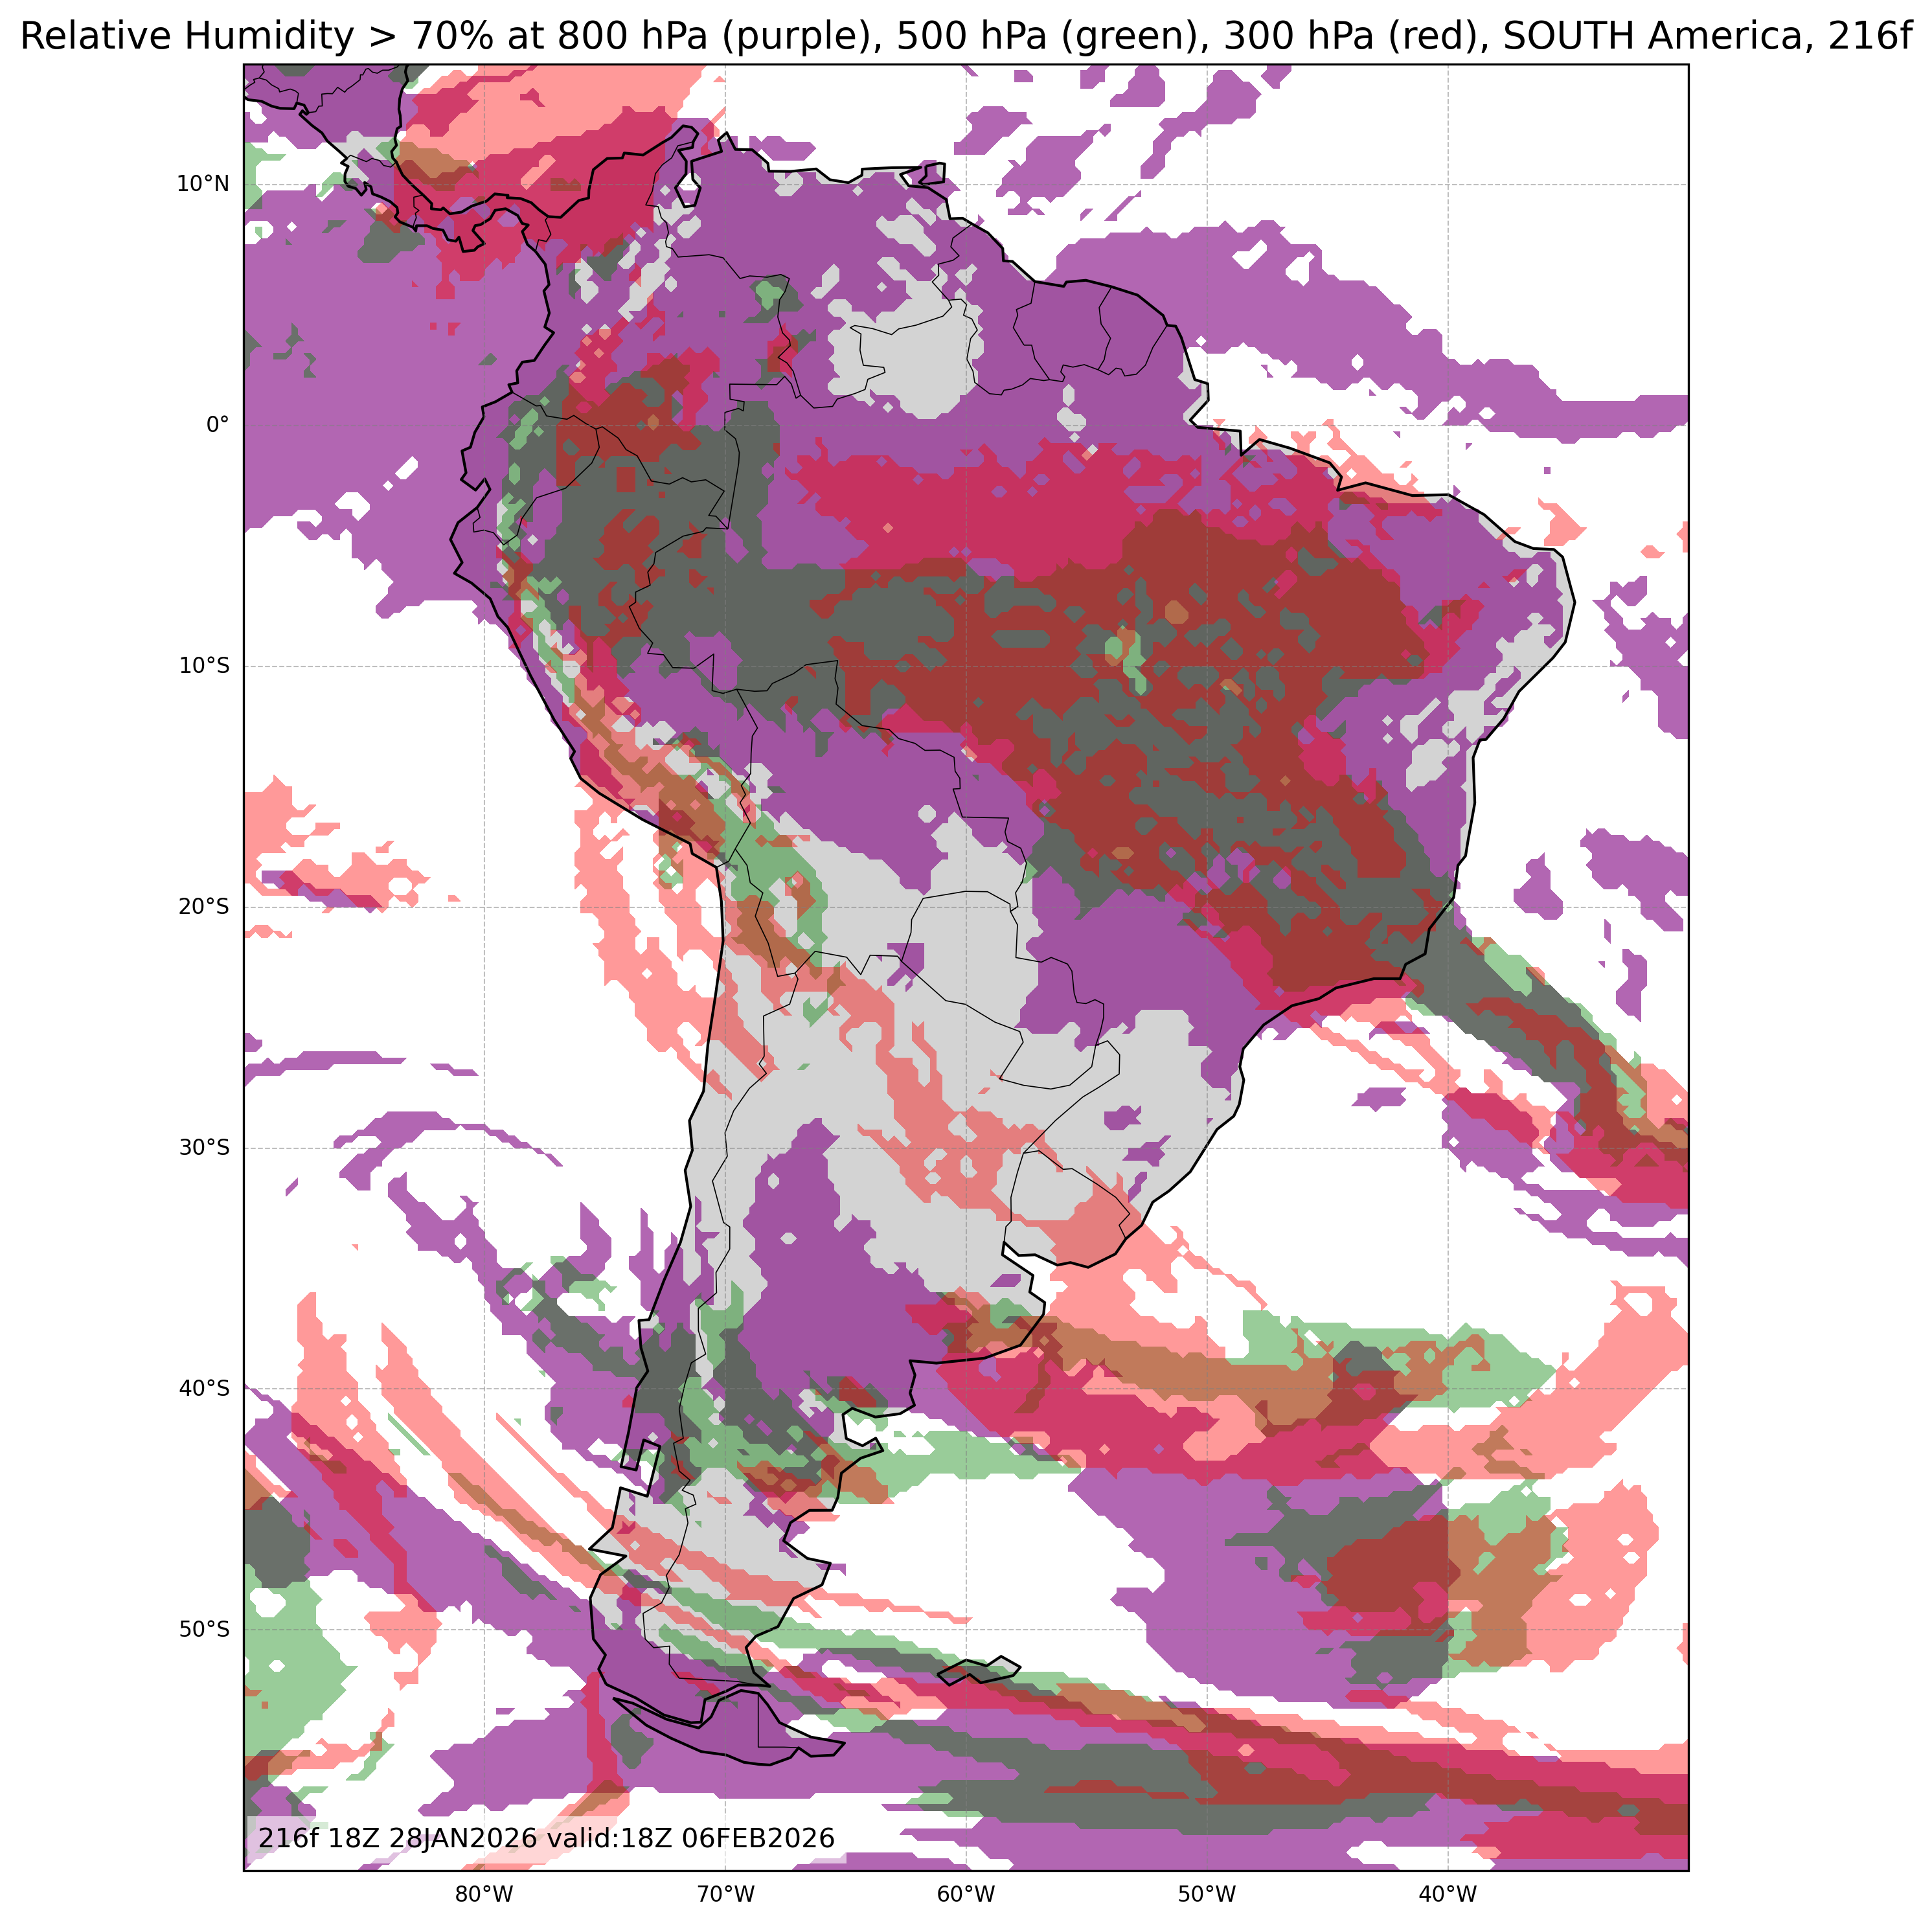
| Relative Humidity at 800, 500, & 300mb or Low, Middle, & High Cloud Cover |
All Times |
🔍 | 🔍 | 🔍 | 🔍 | 🔍 |
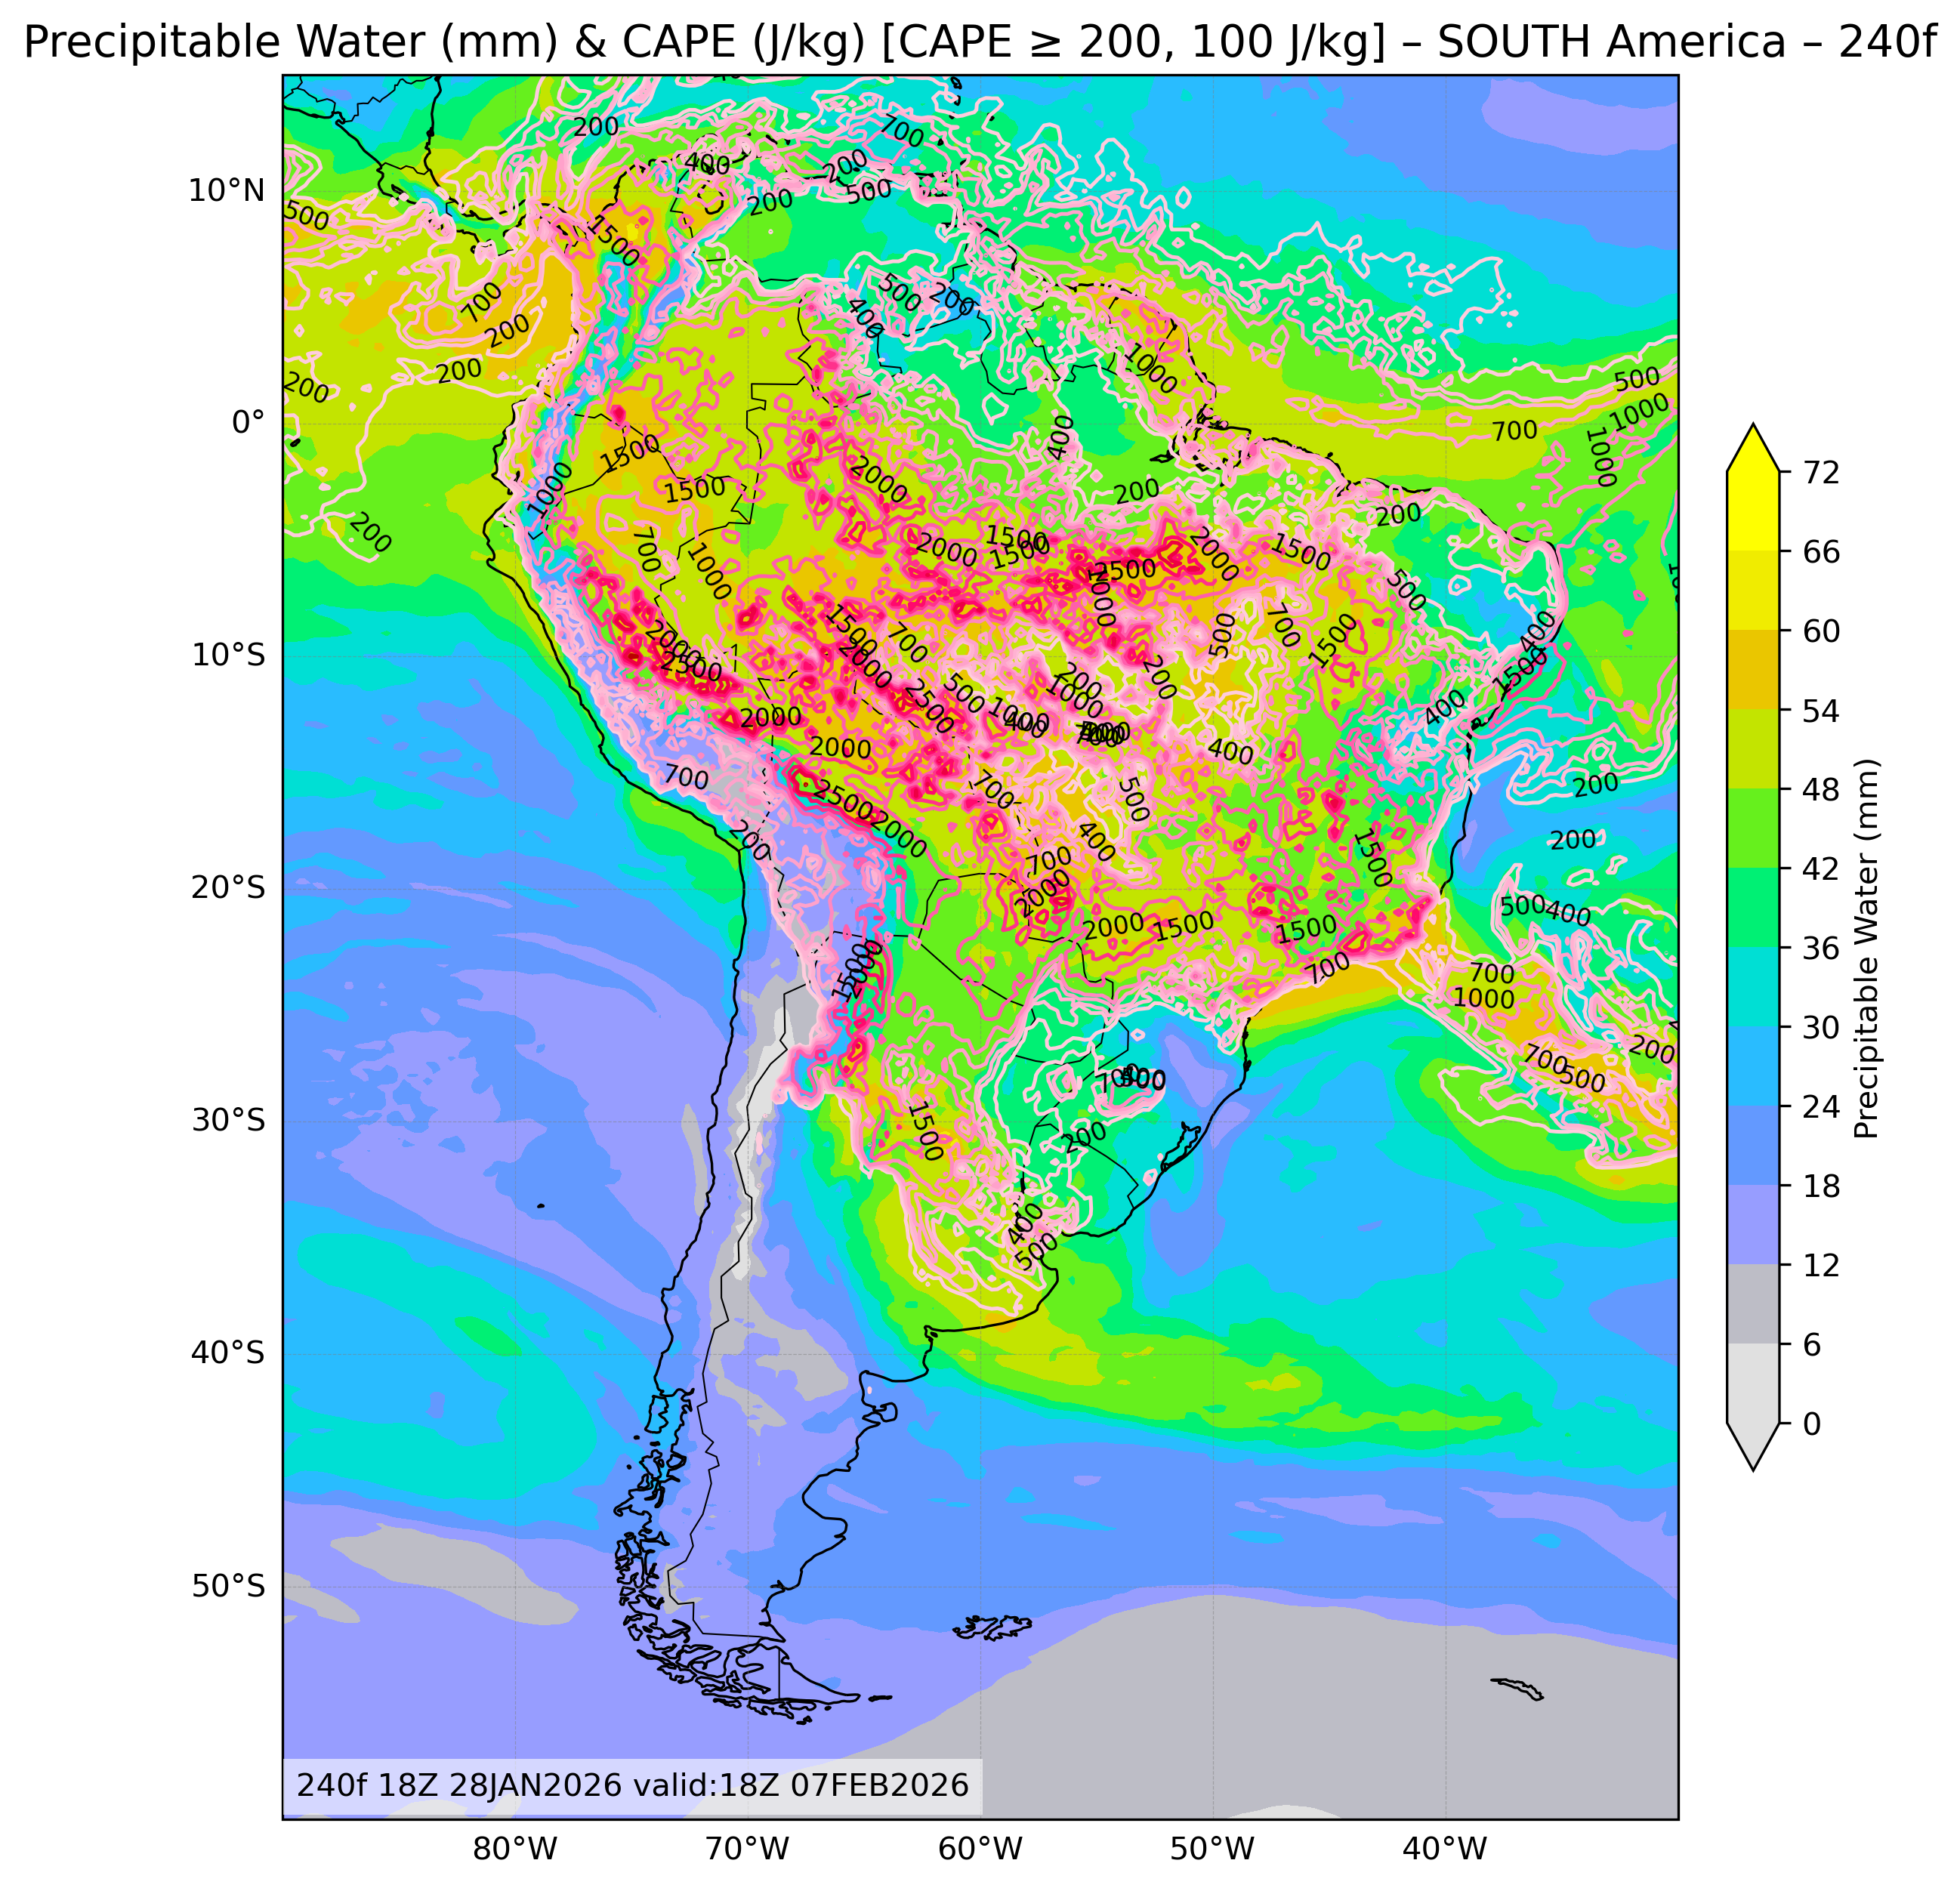
| Weather Map Images | Time: | Day 10 240 Hours |
Day 11 264 Hours |
Day 12 288 Hours |
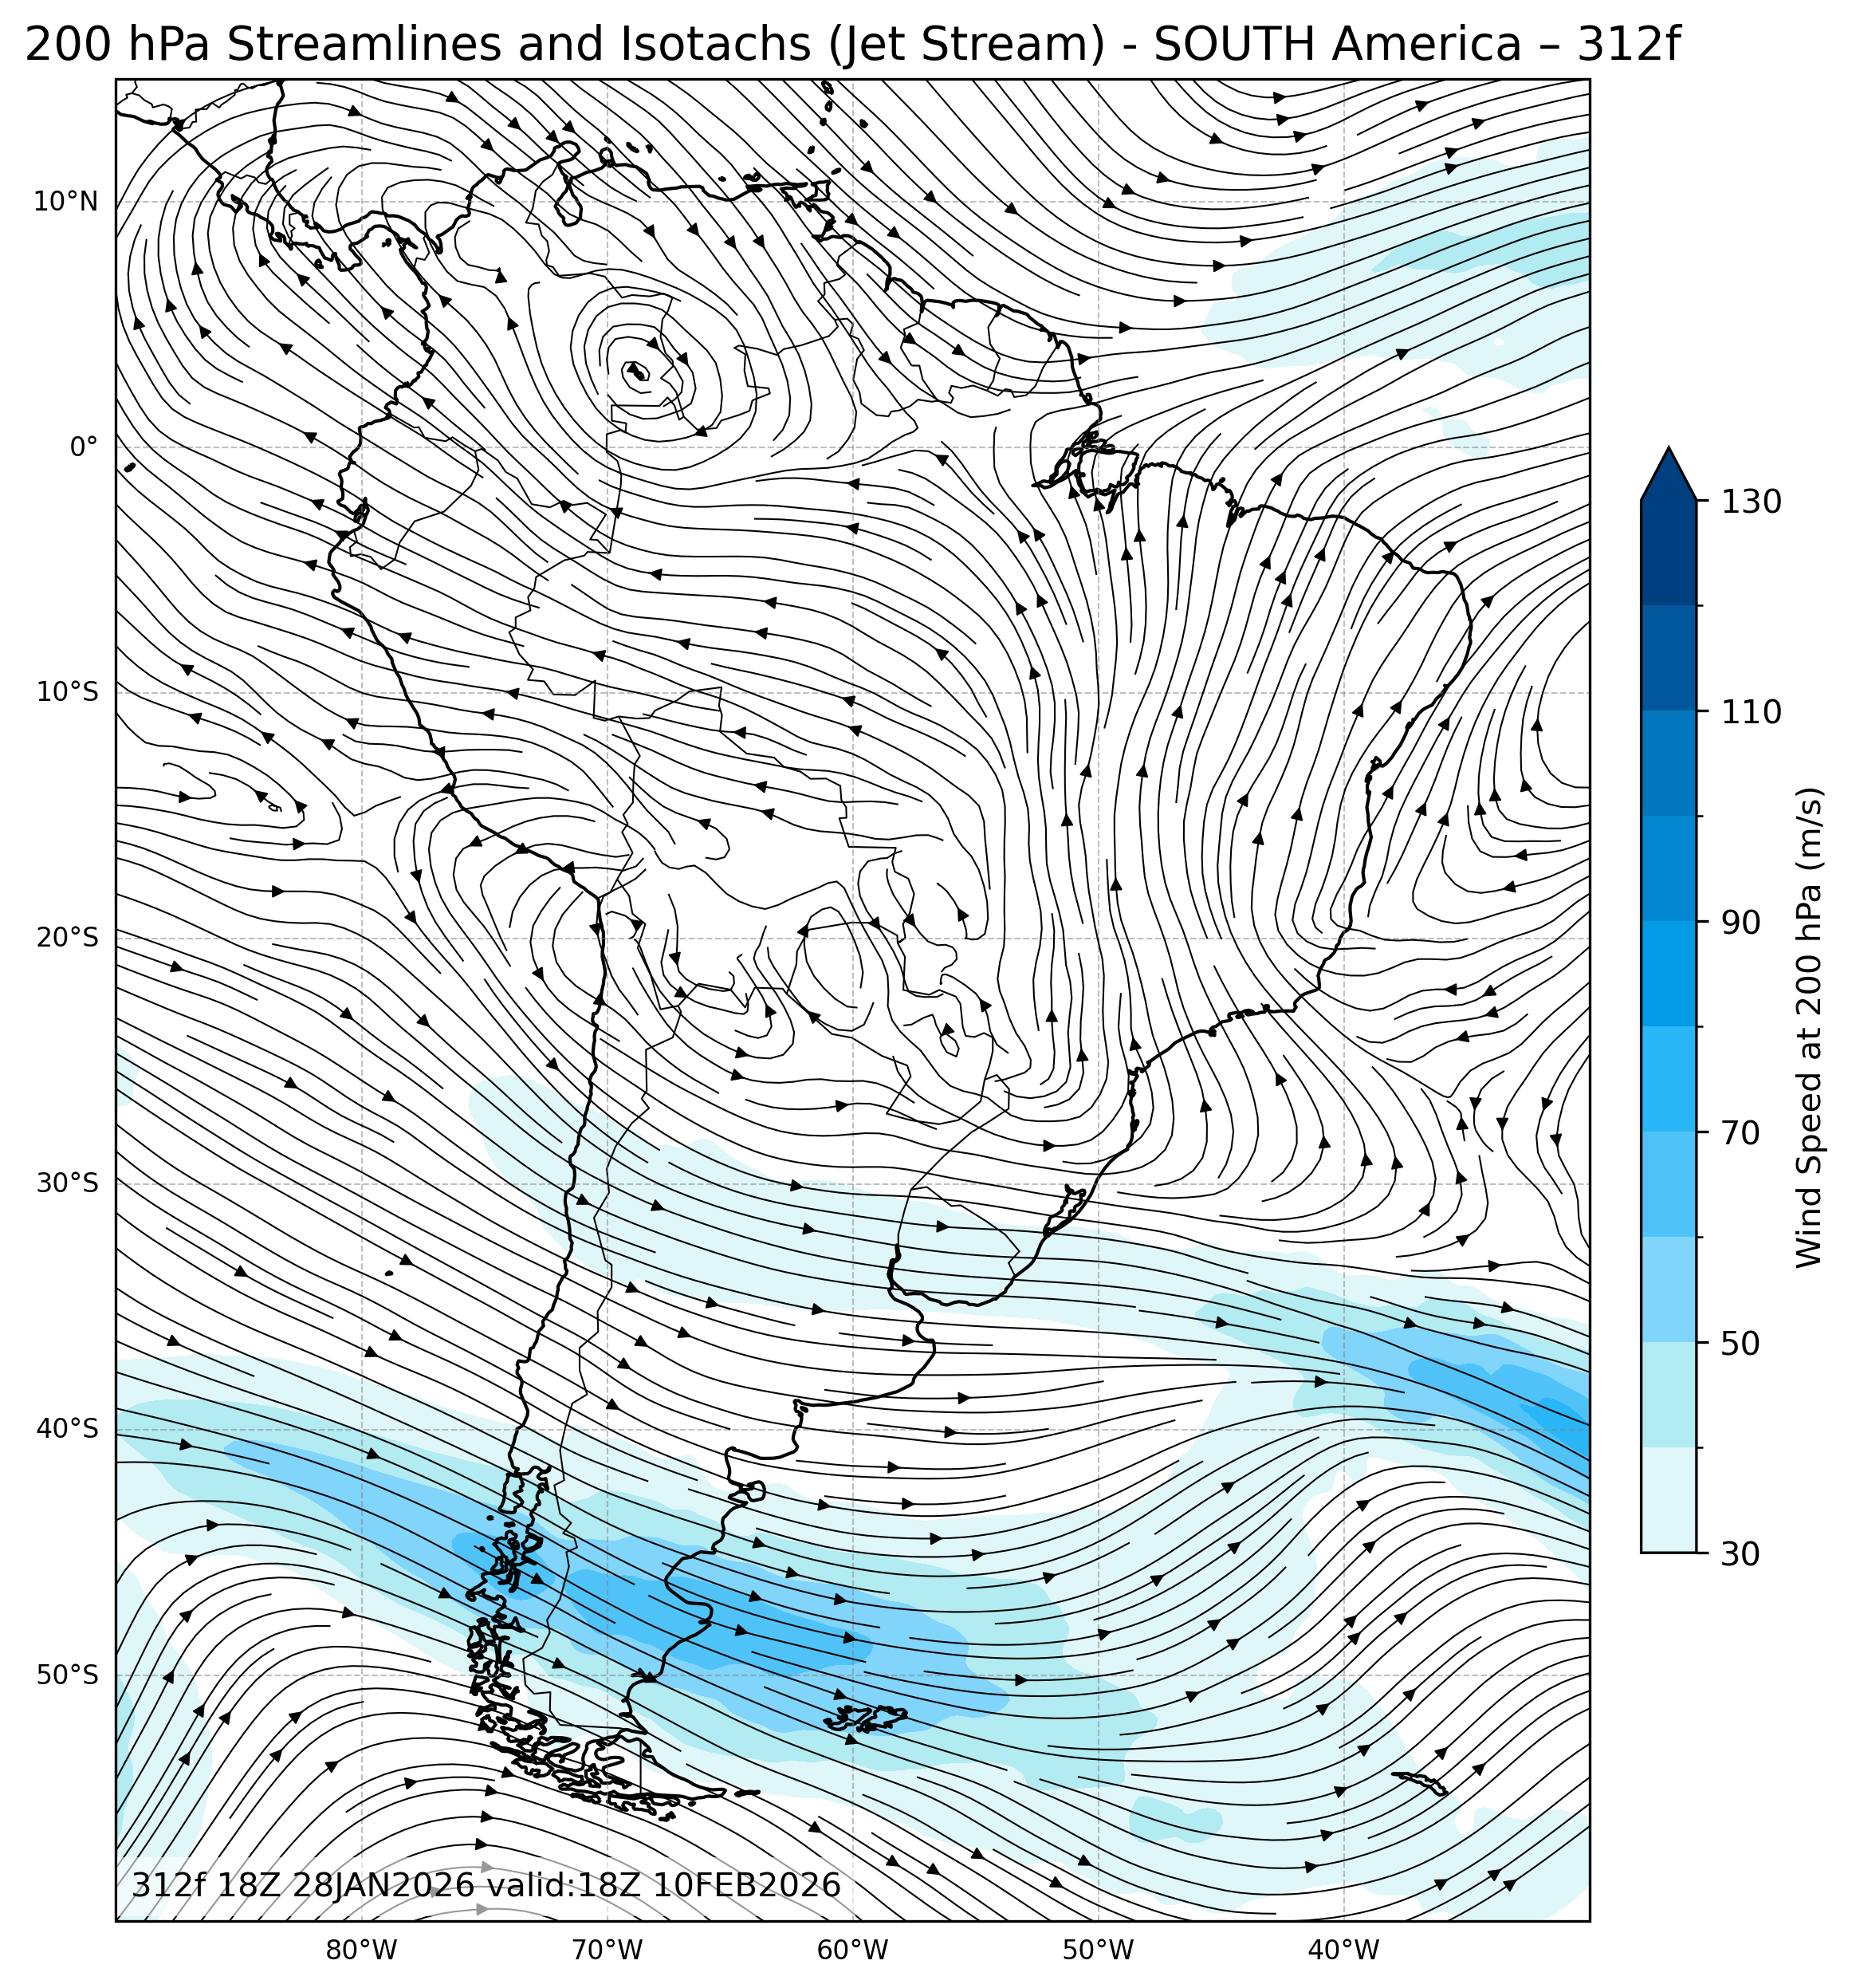
Day 13 312 Hours |
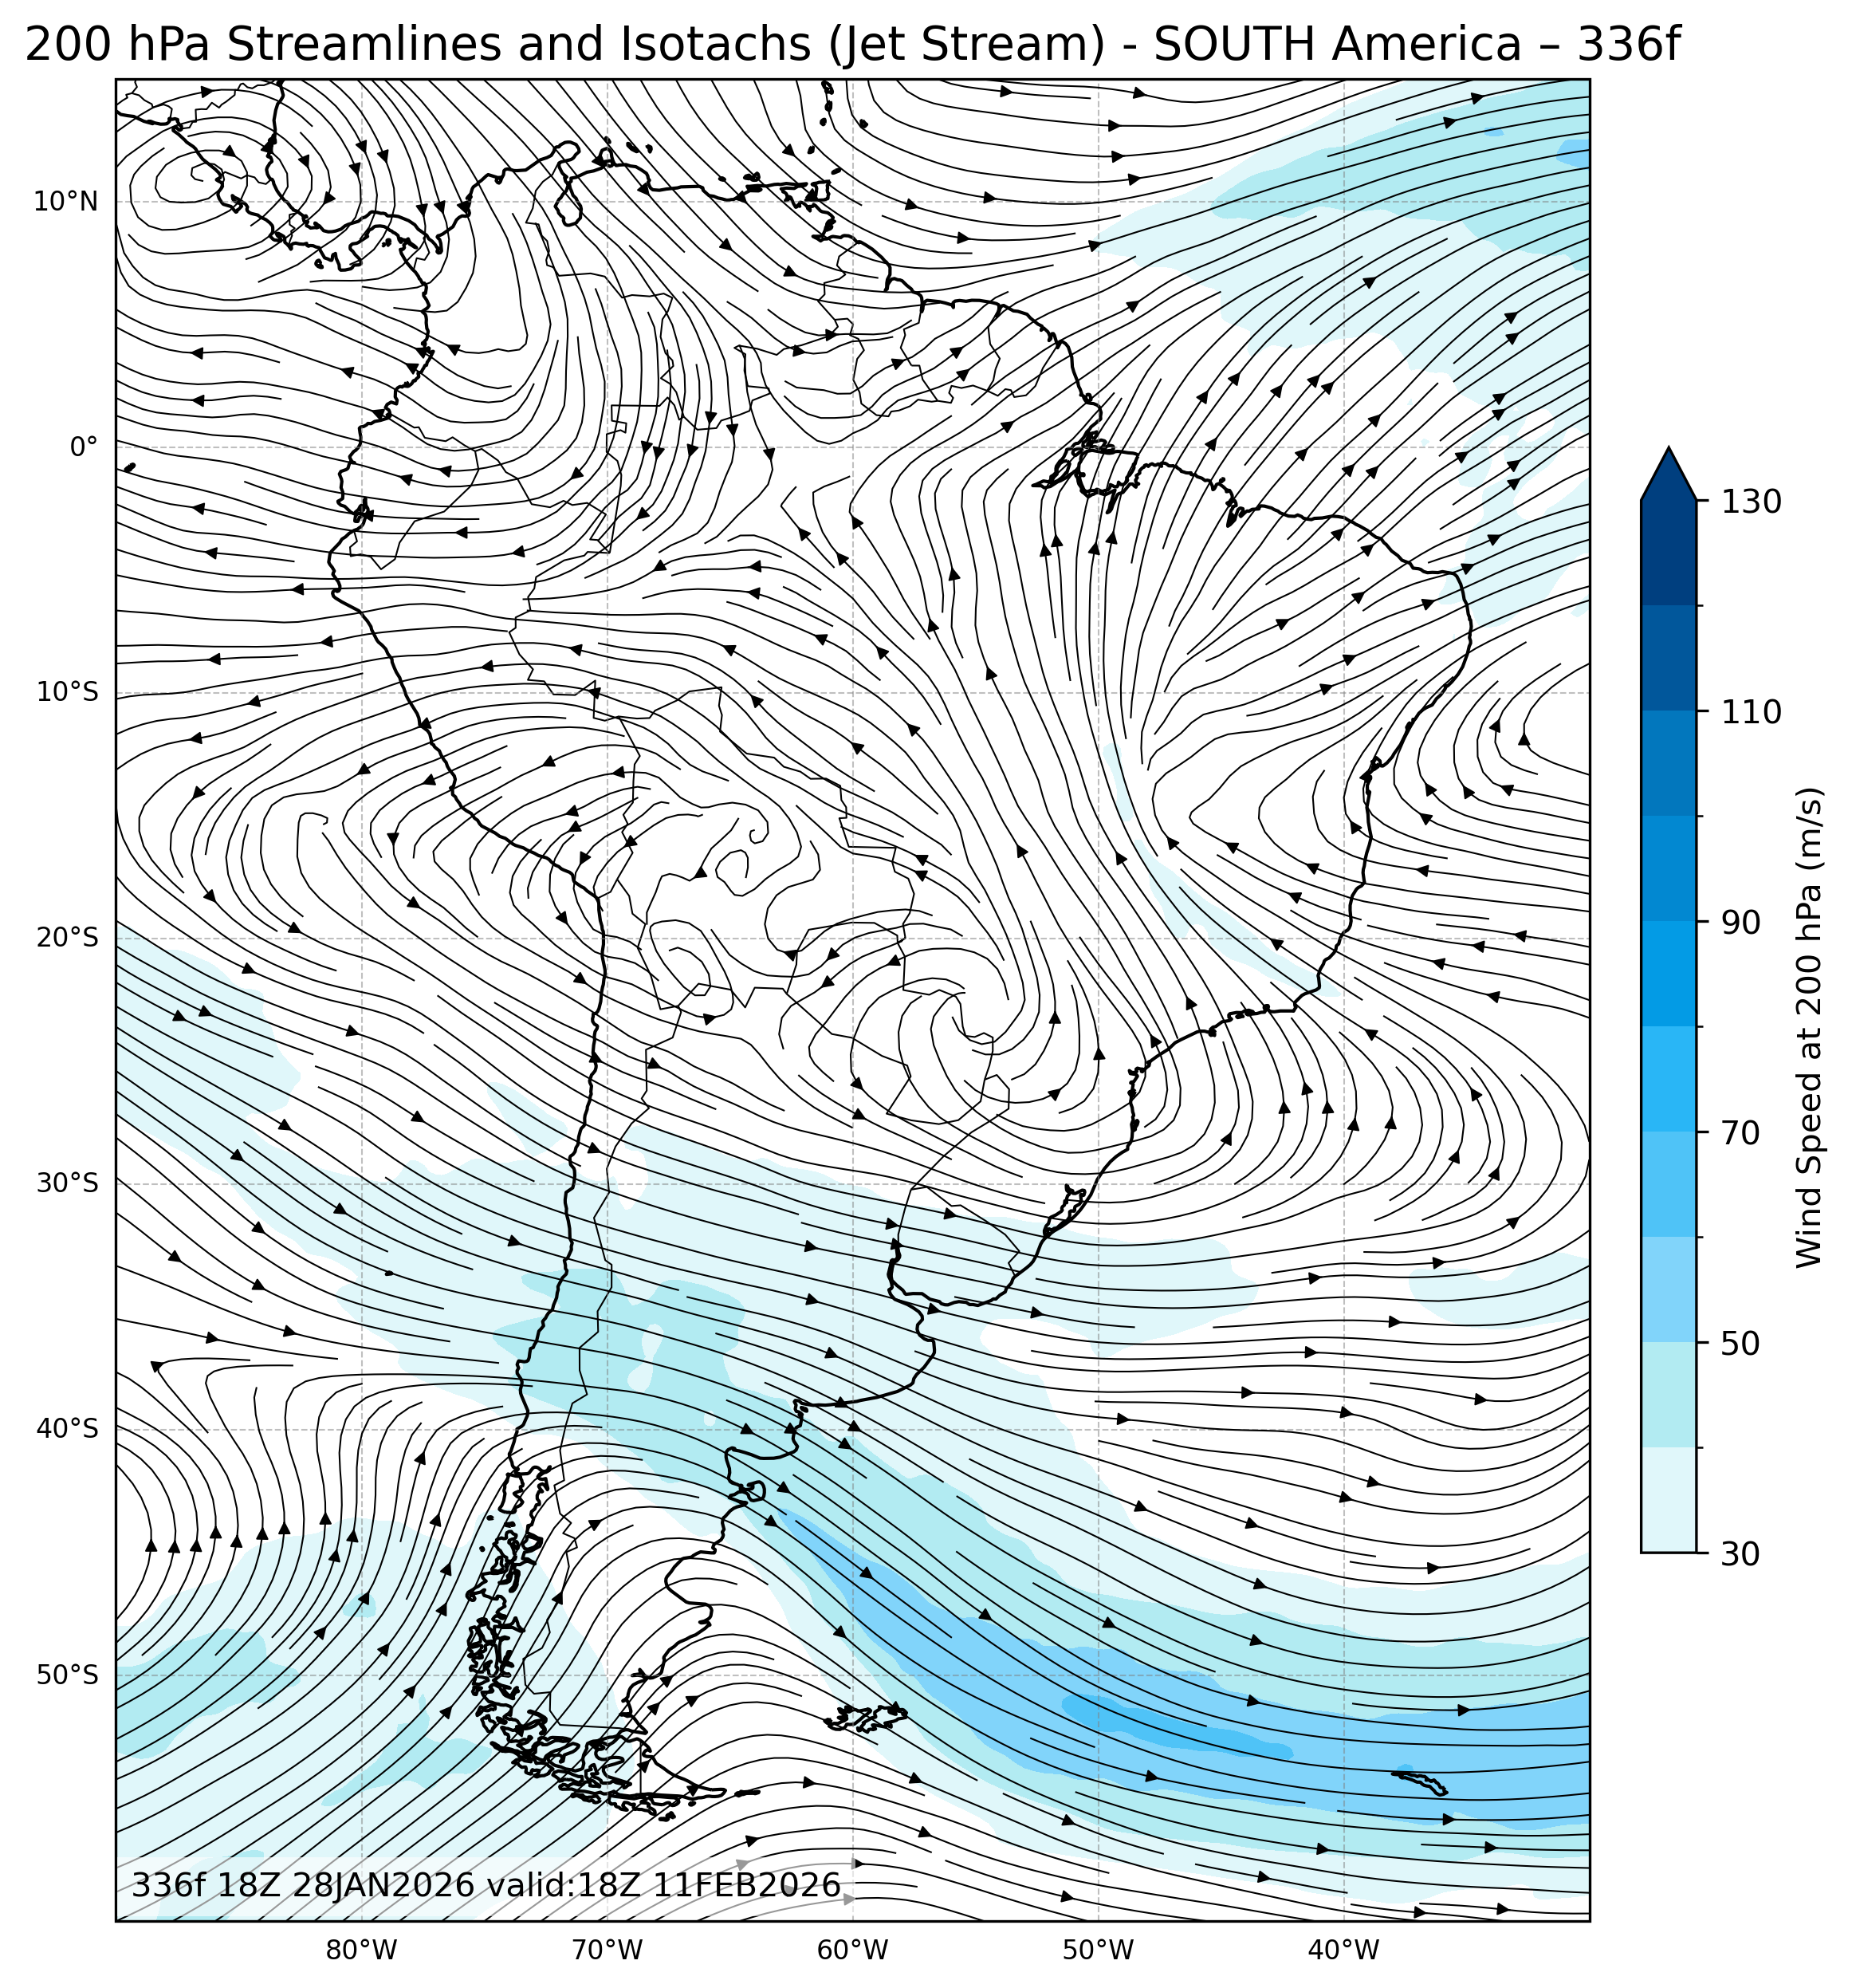
Day 14 336 Hours |
| Field: | All Fields |
All Fields |
All Fields |
All Fields |
All Fields |
|
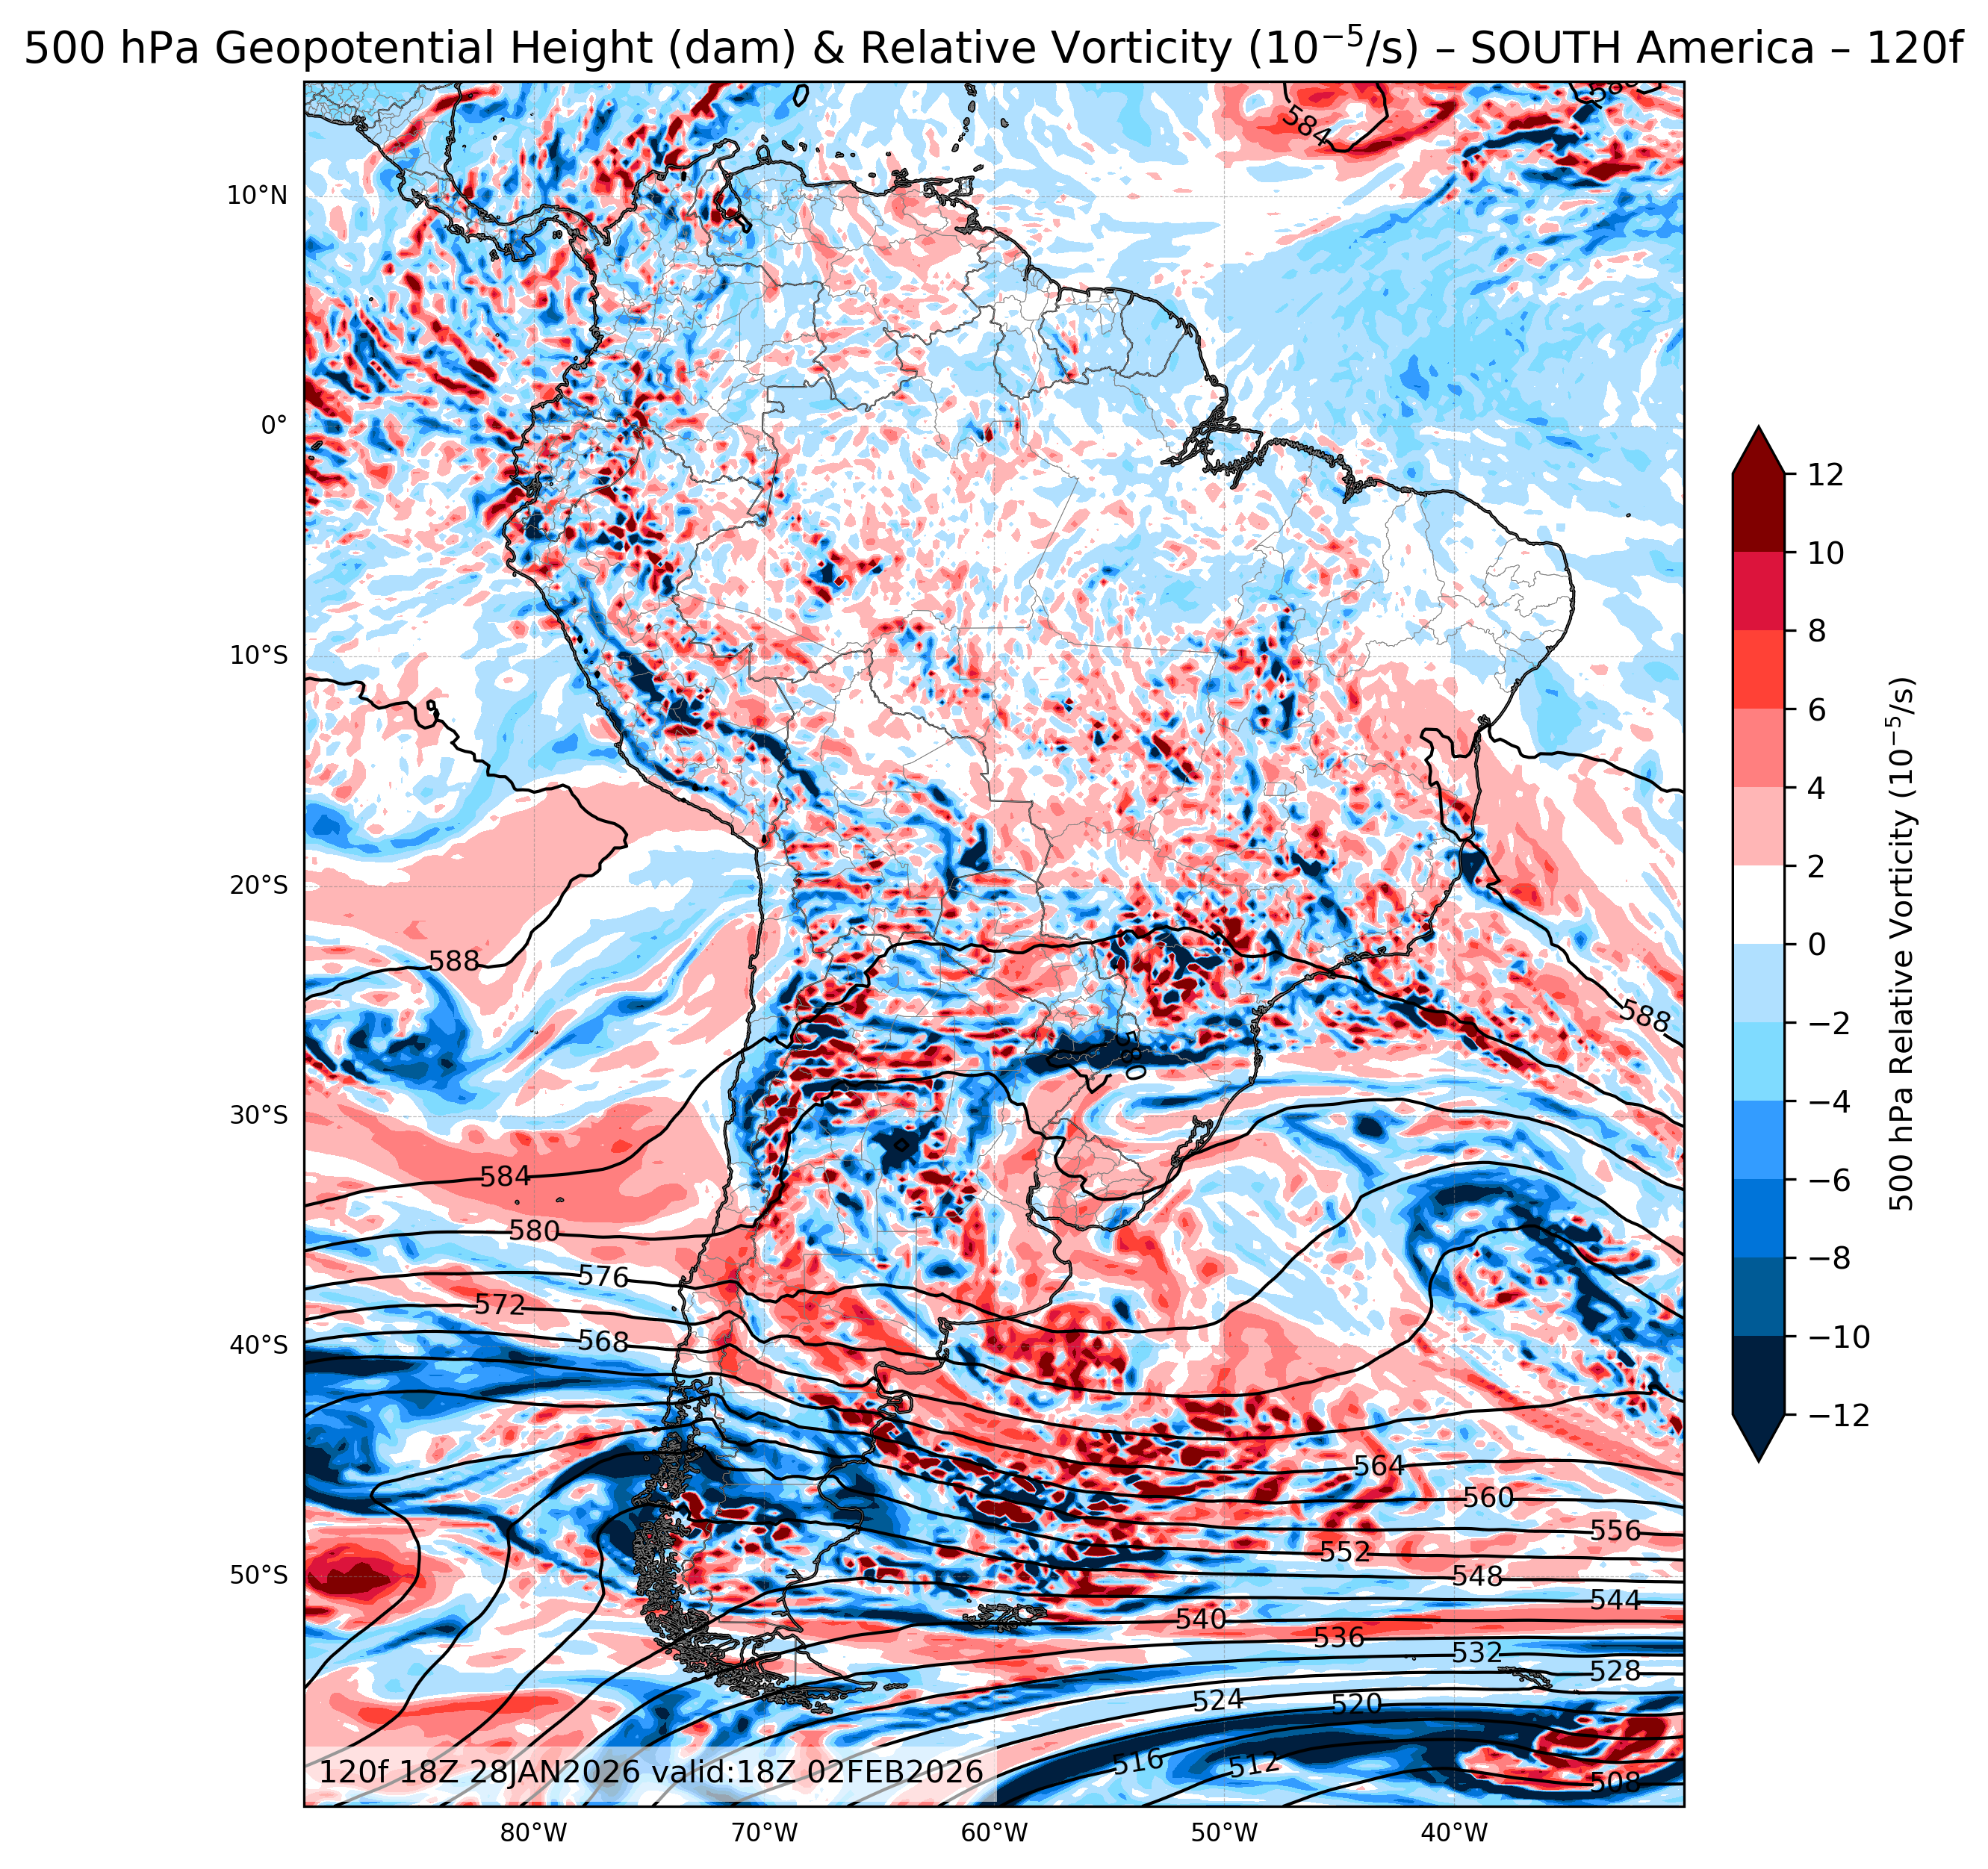
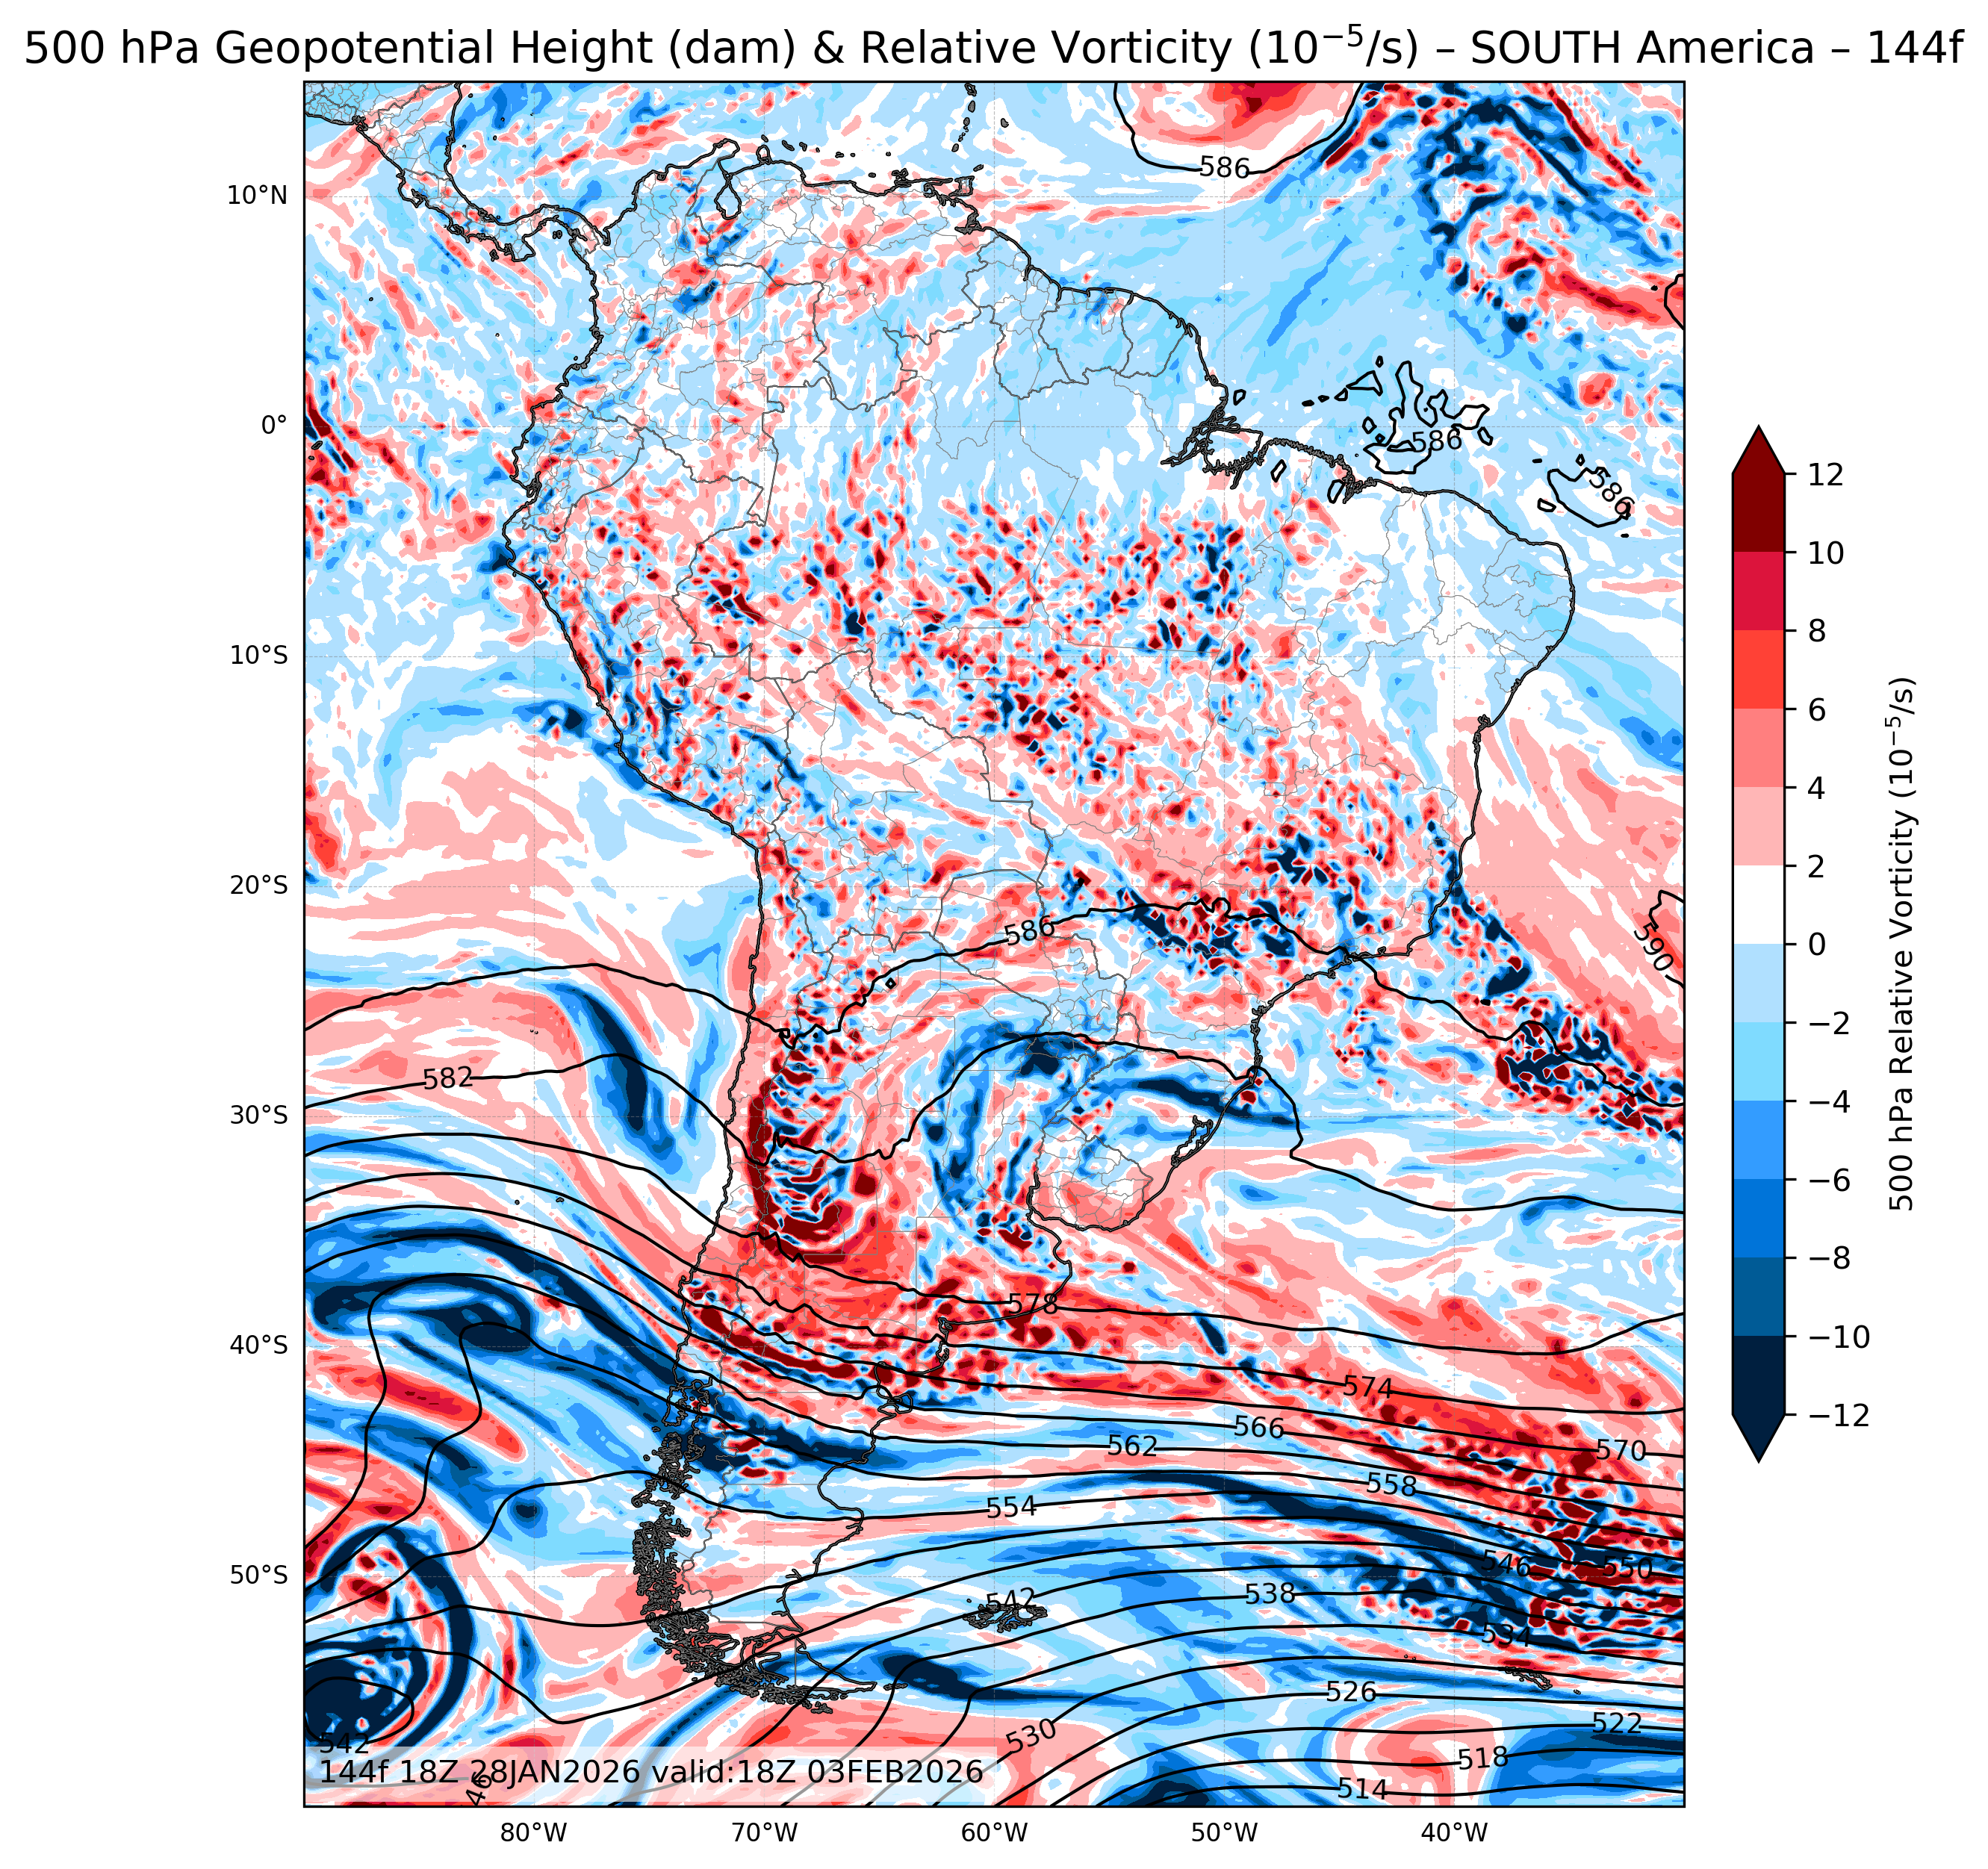
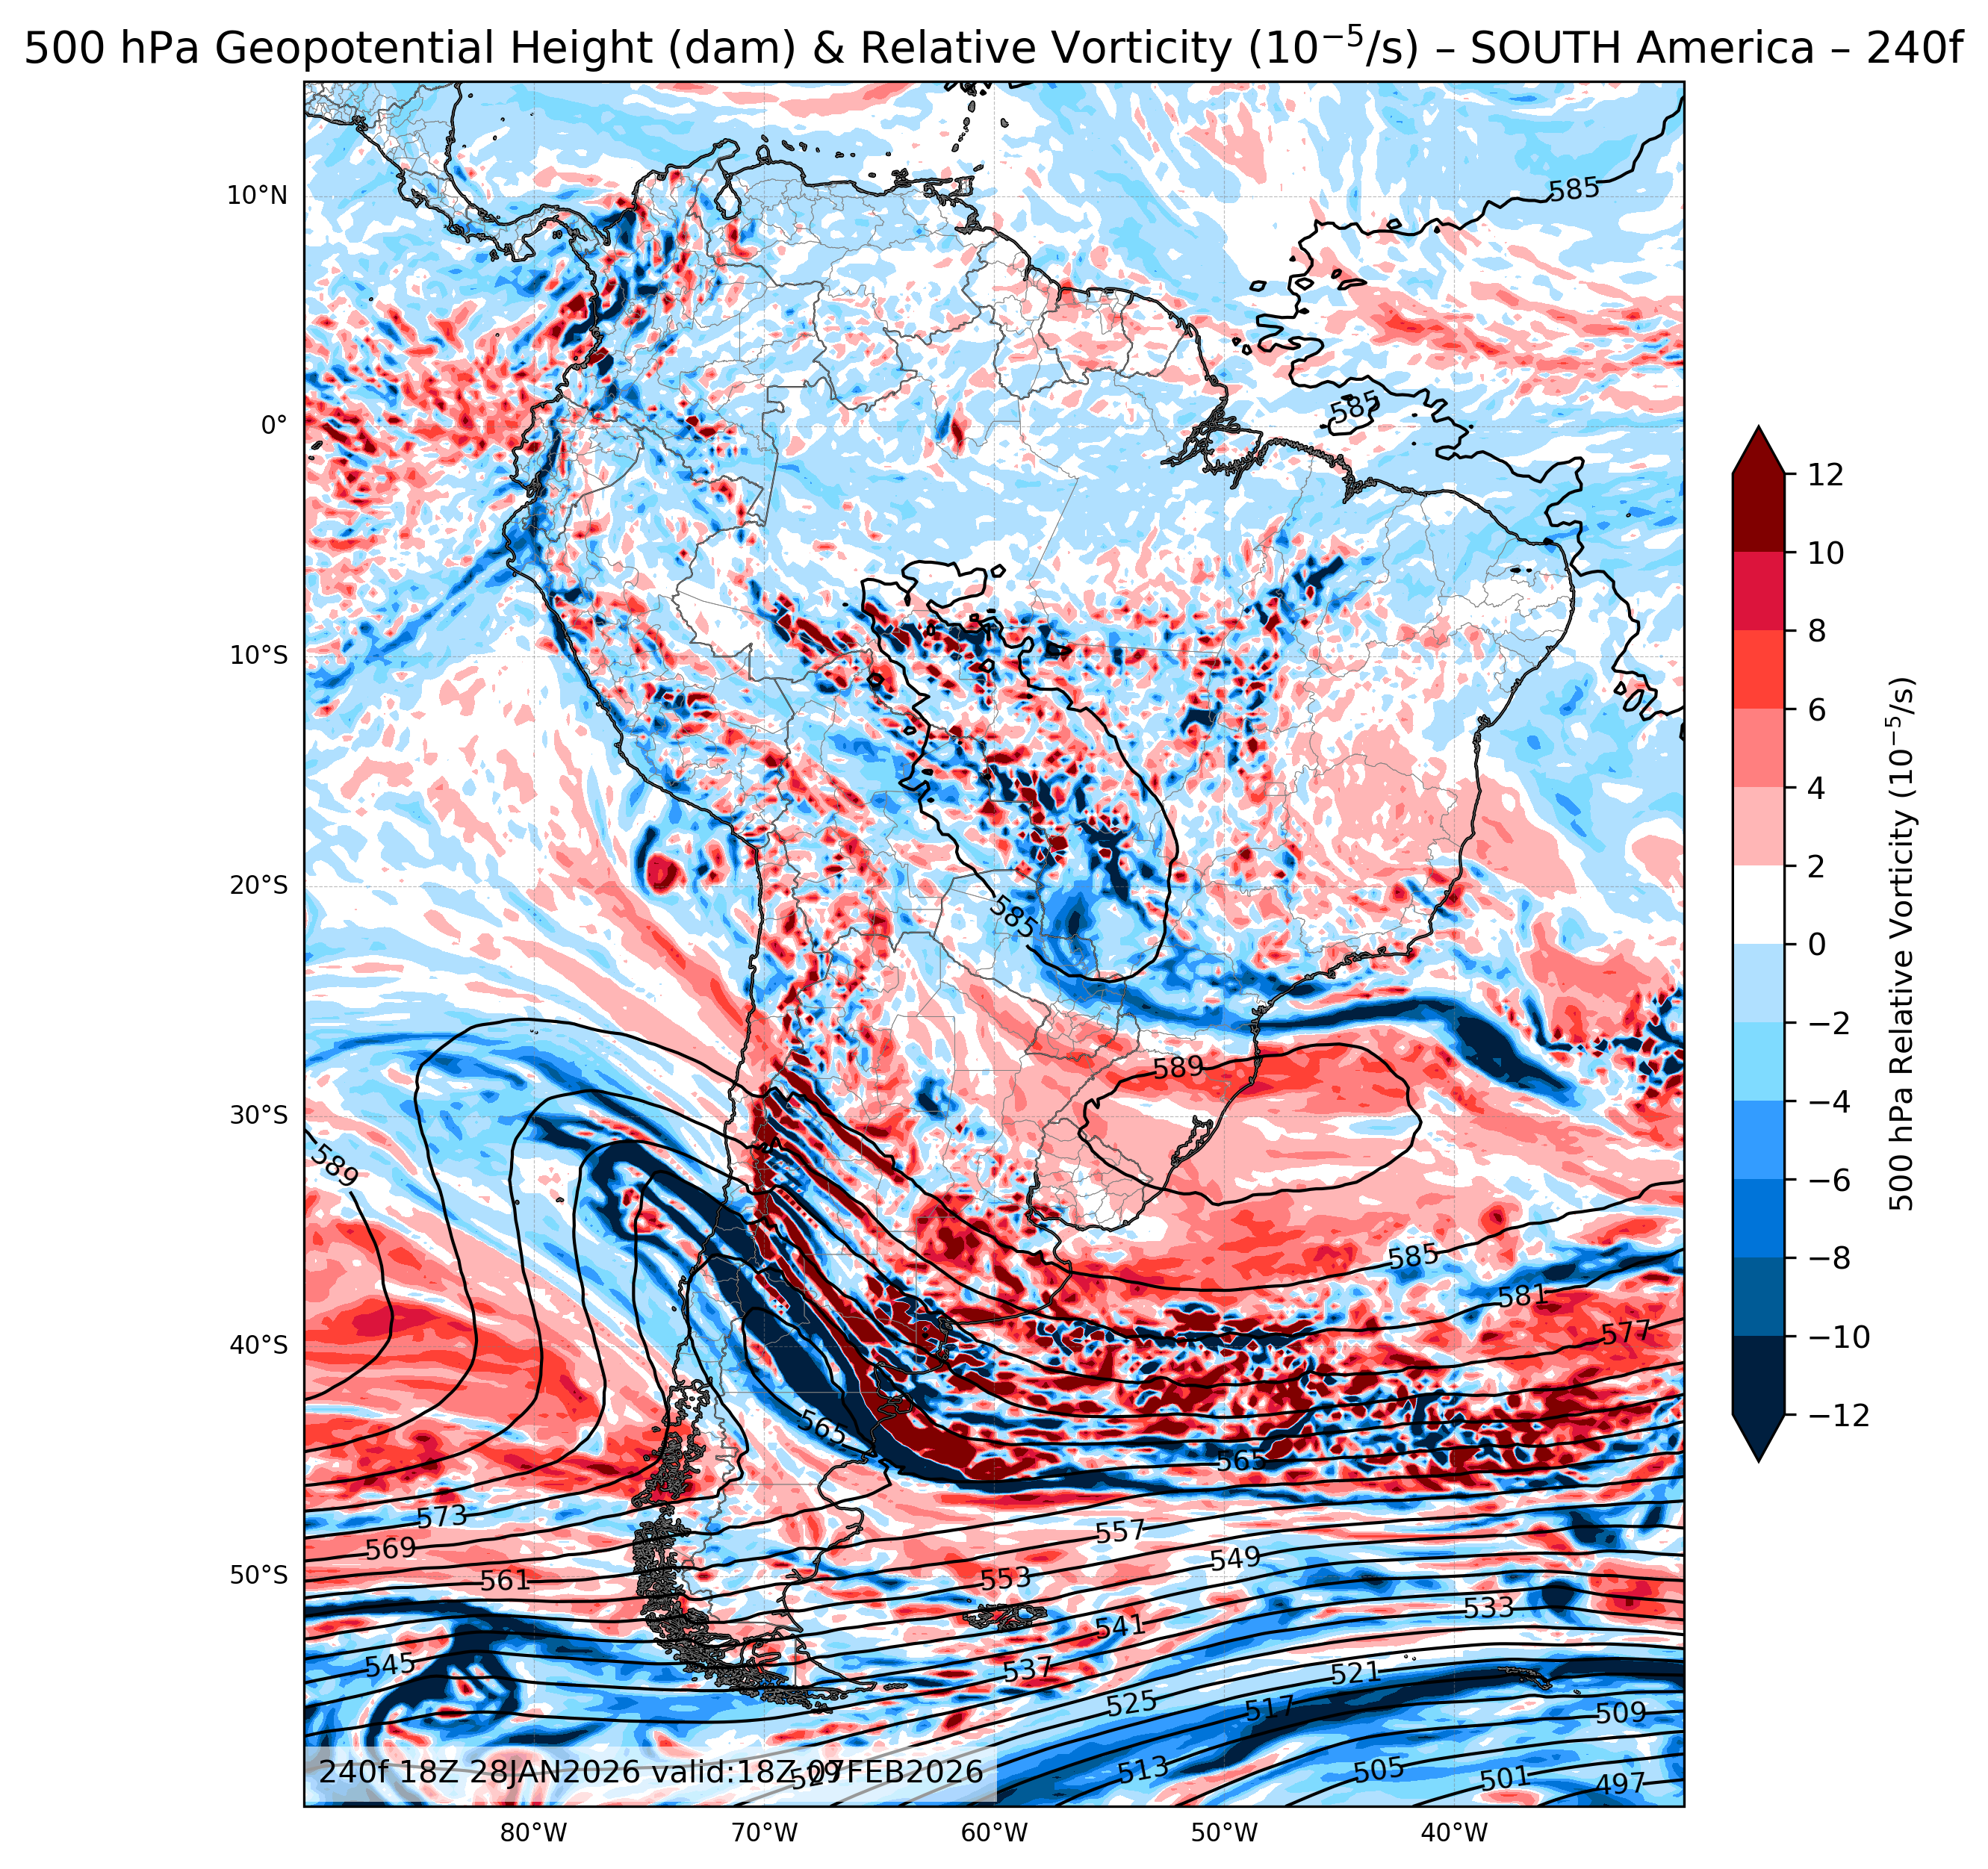
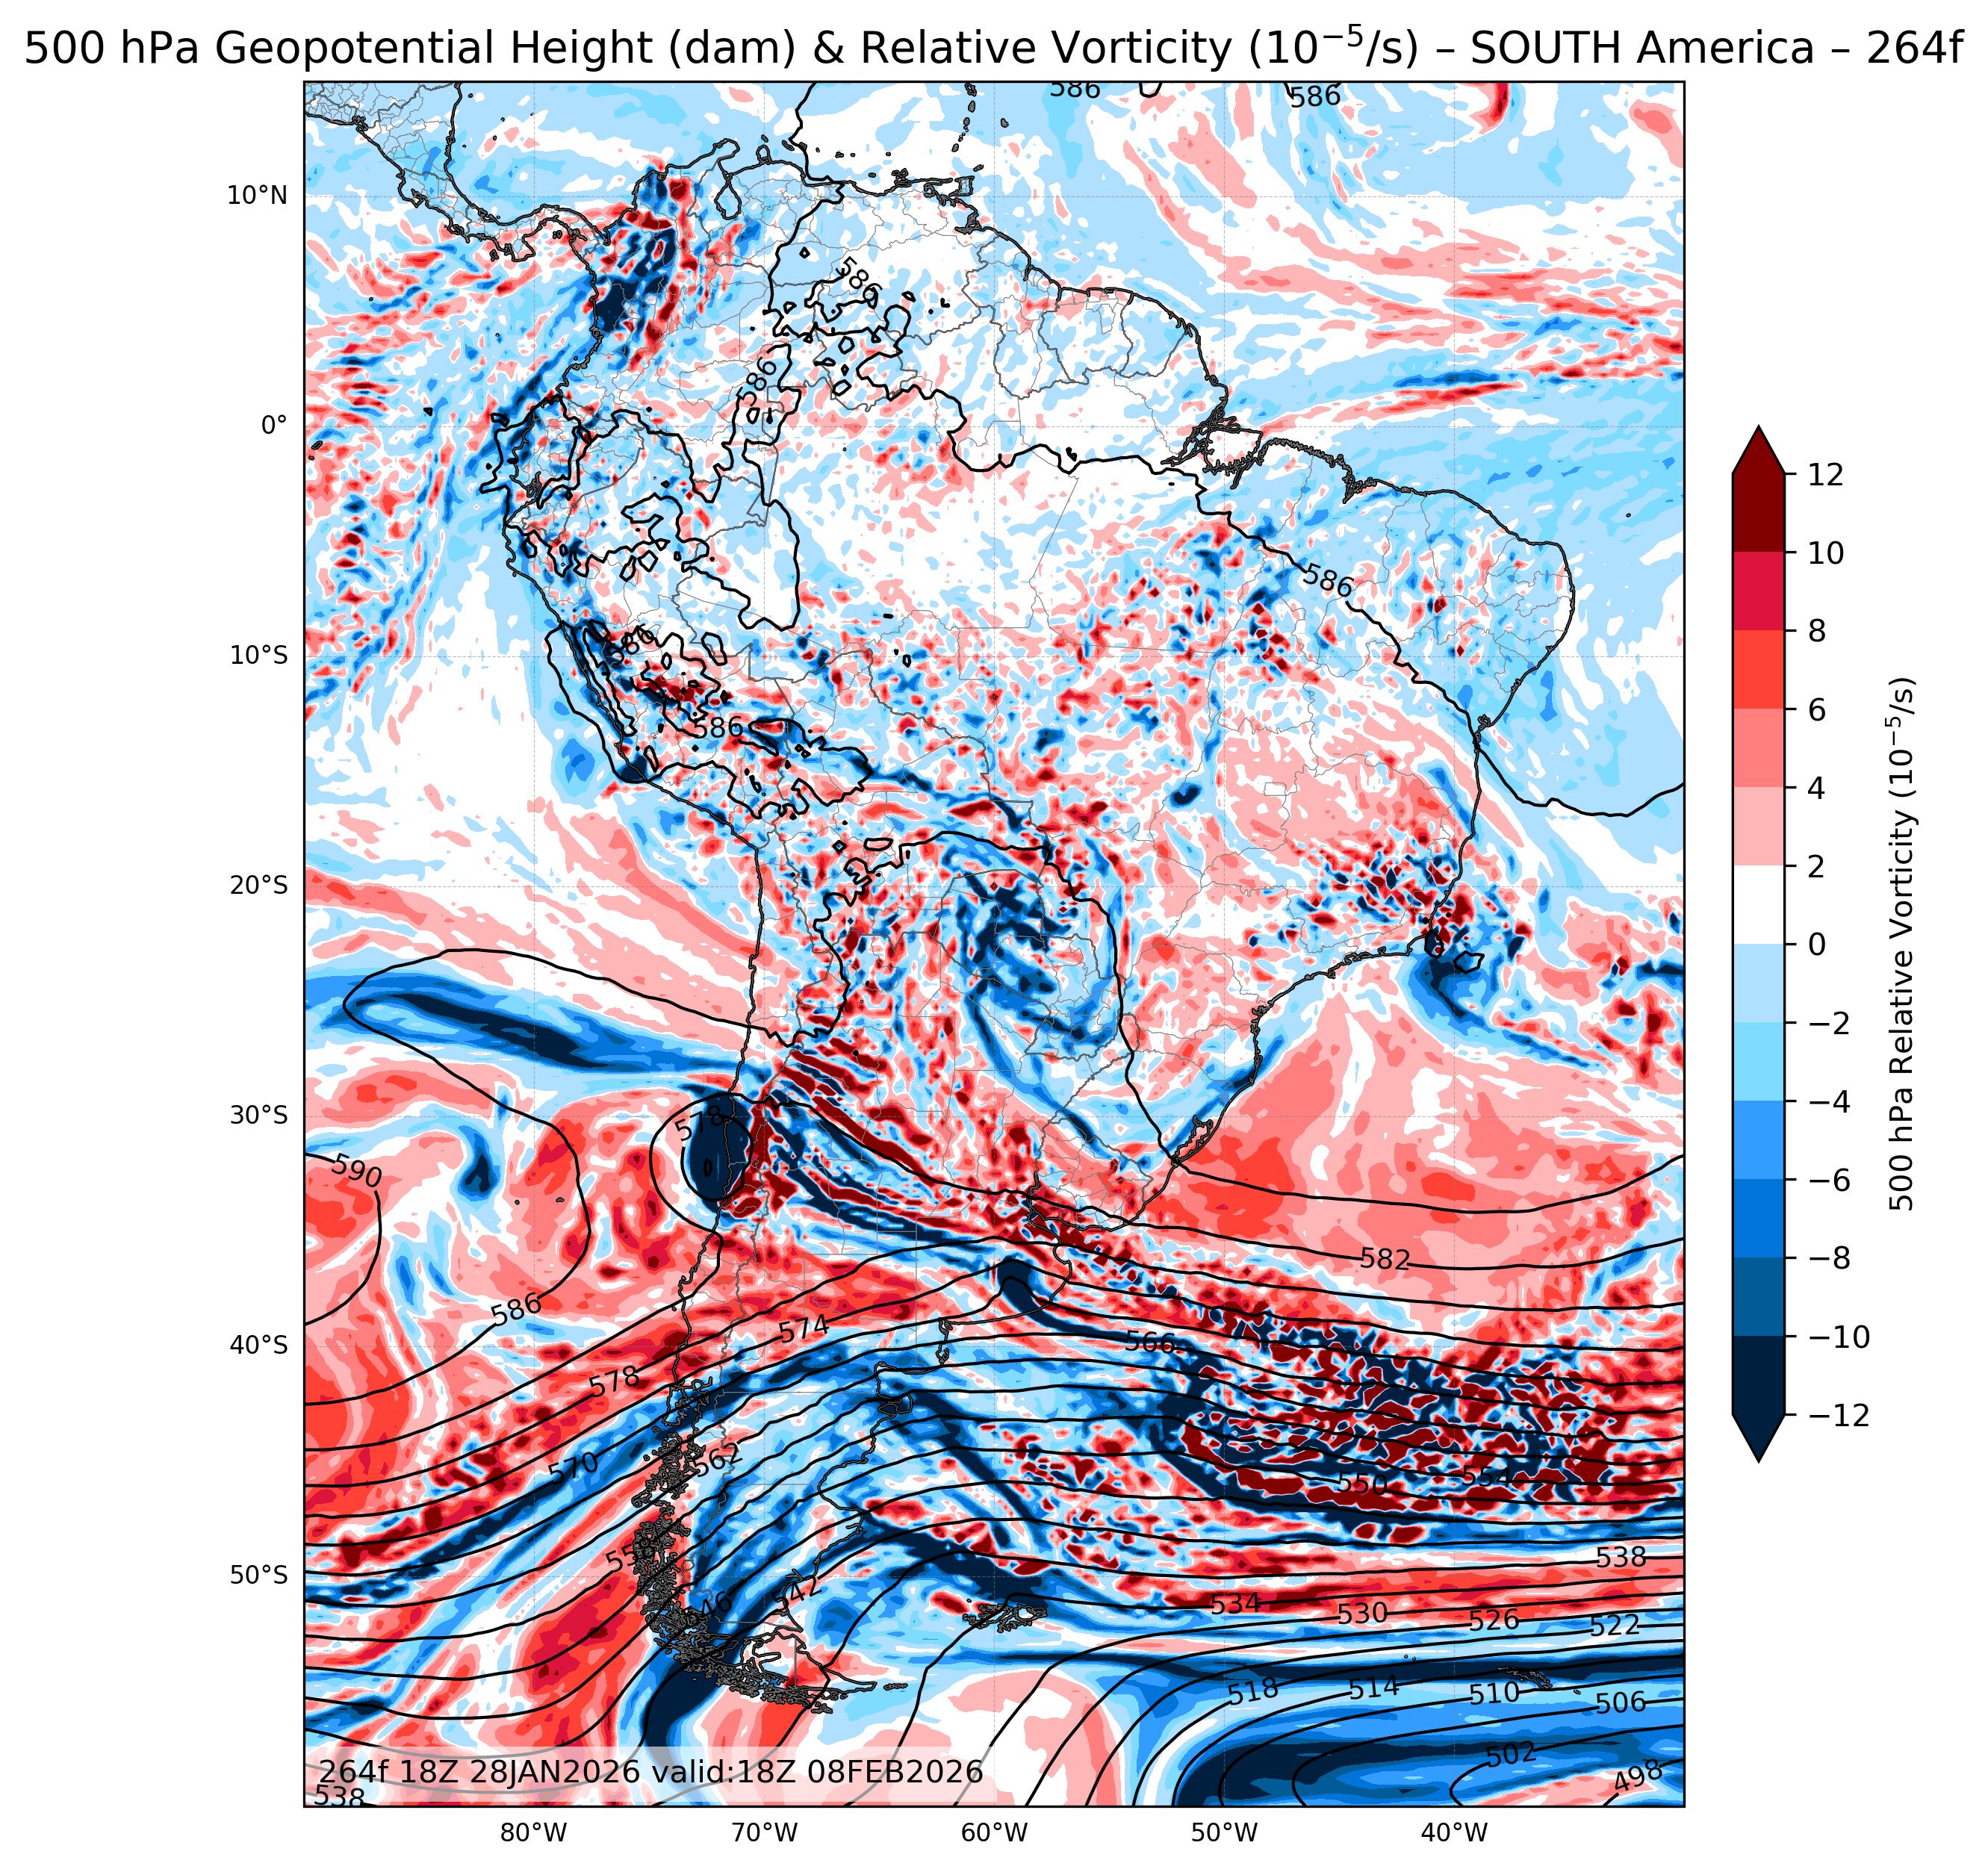
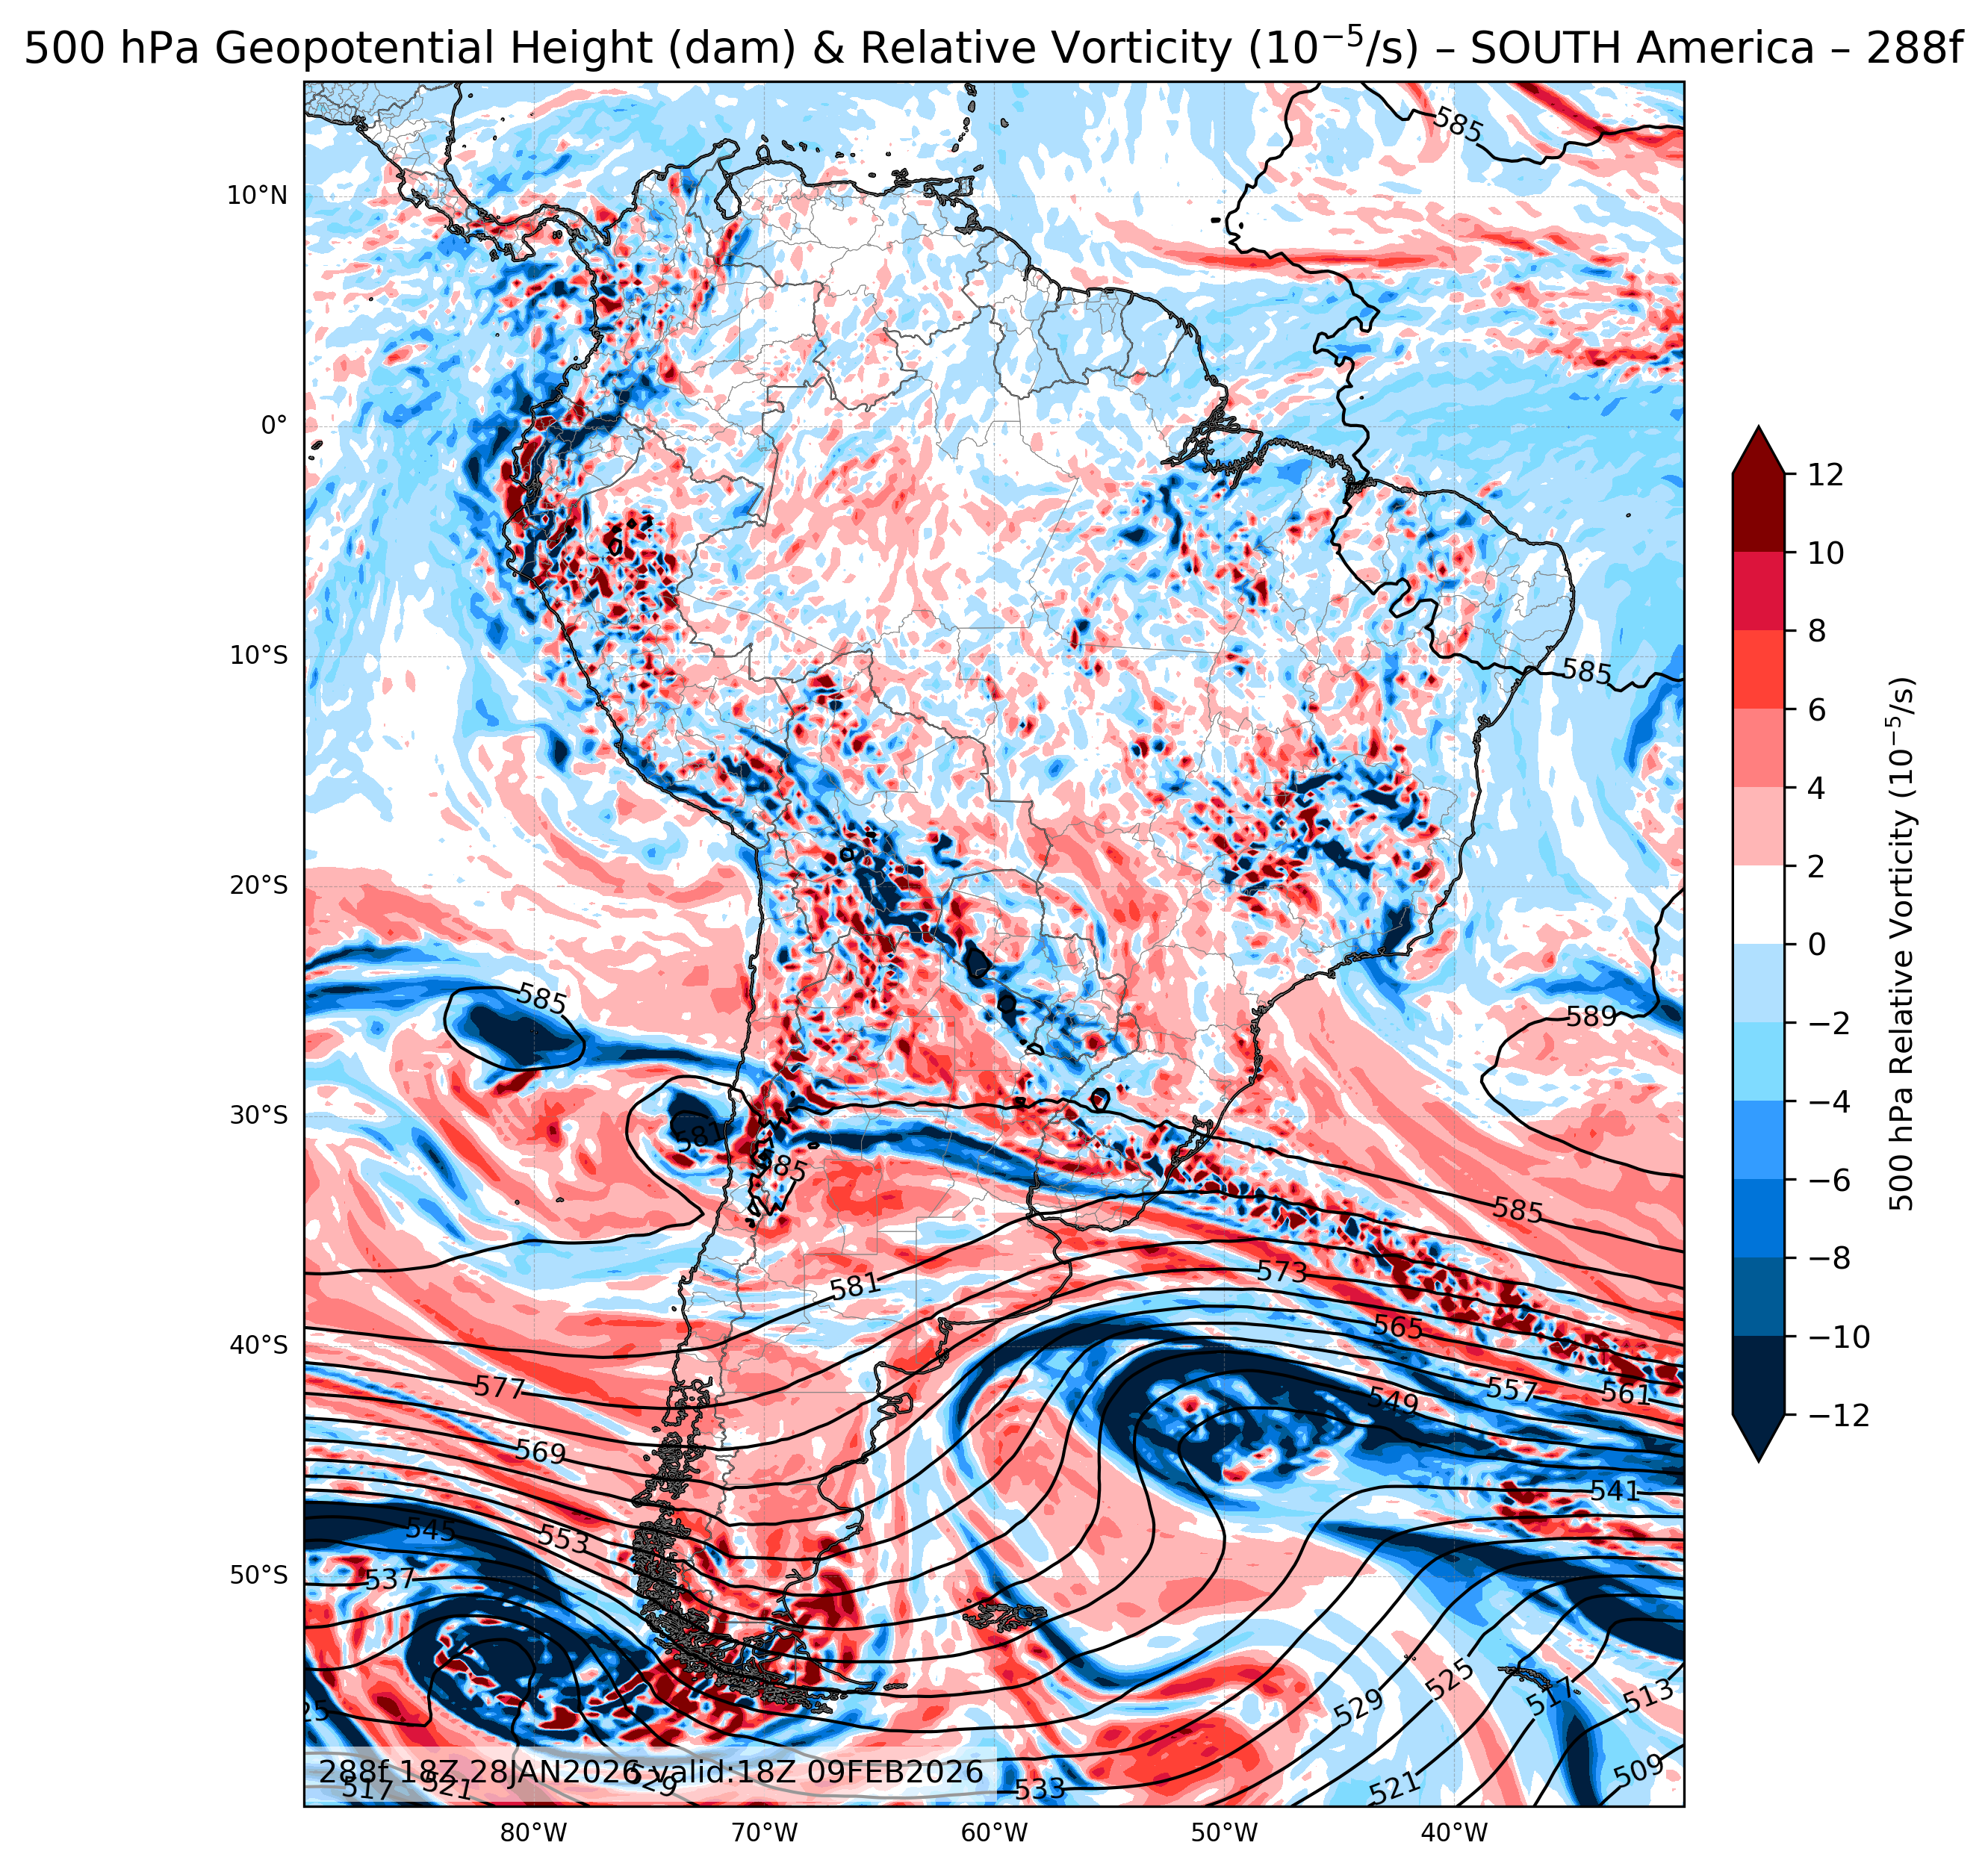
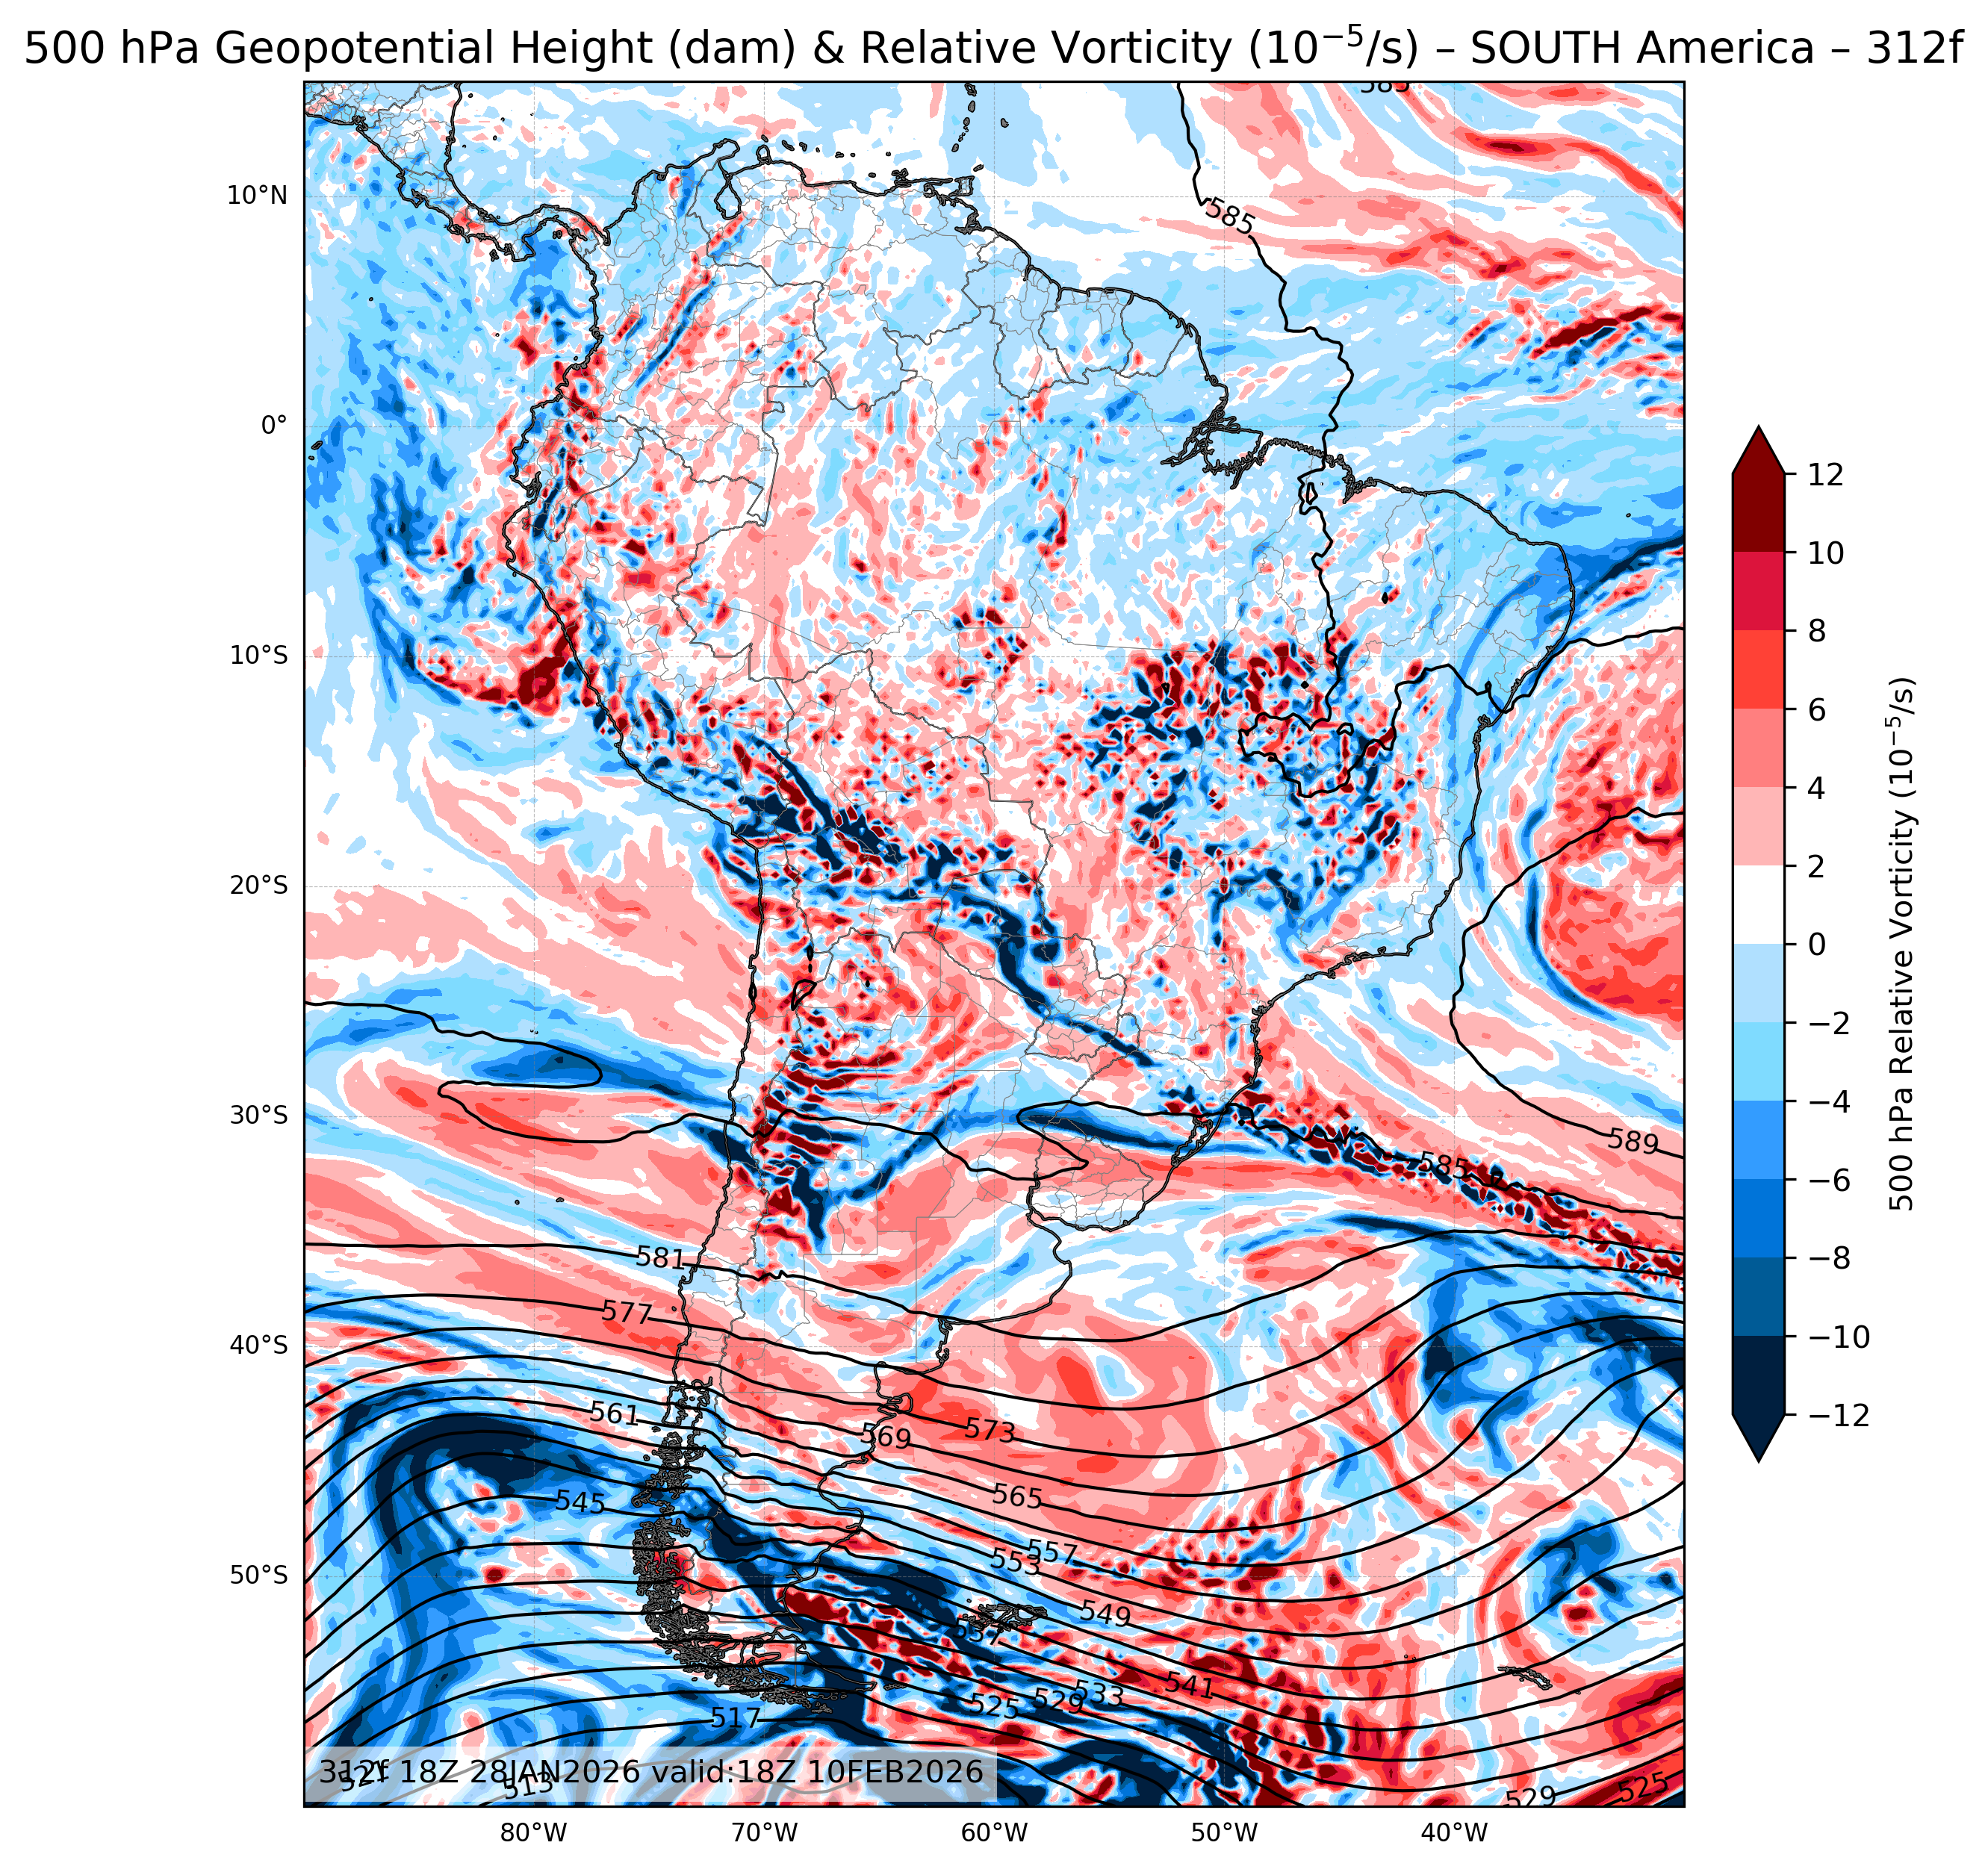
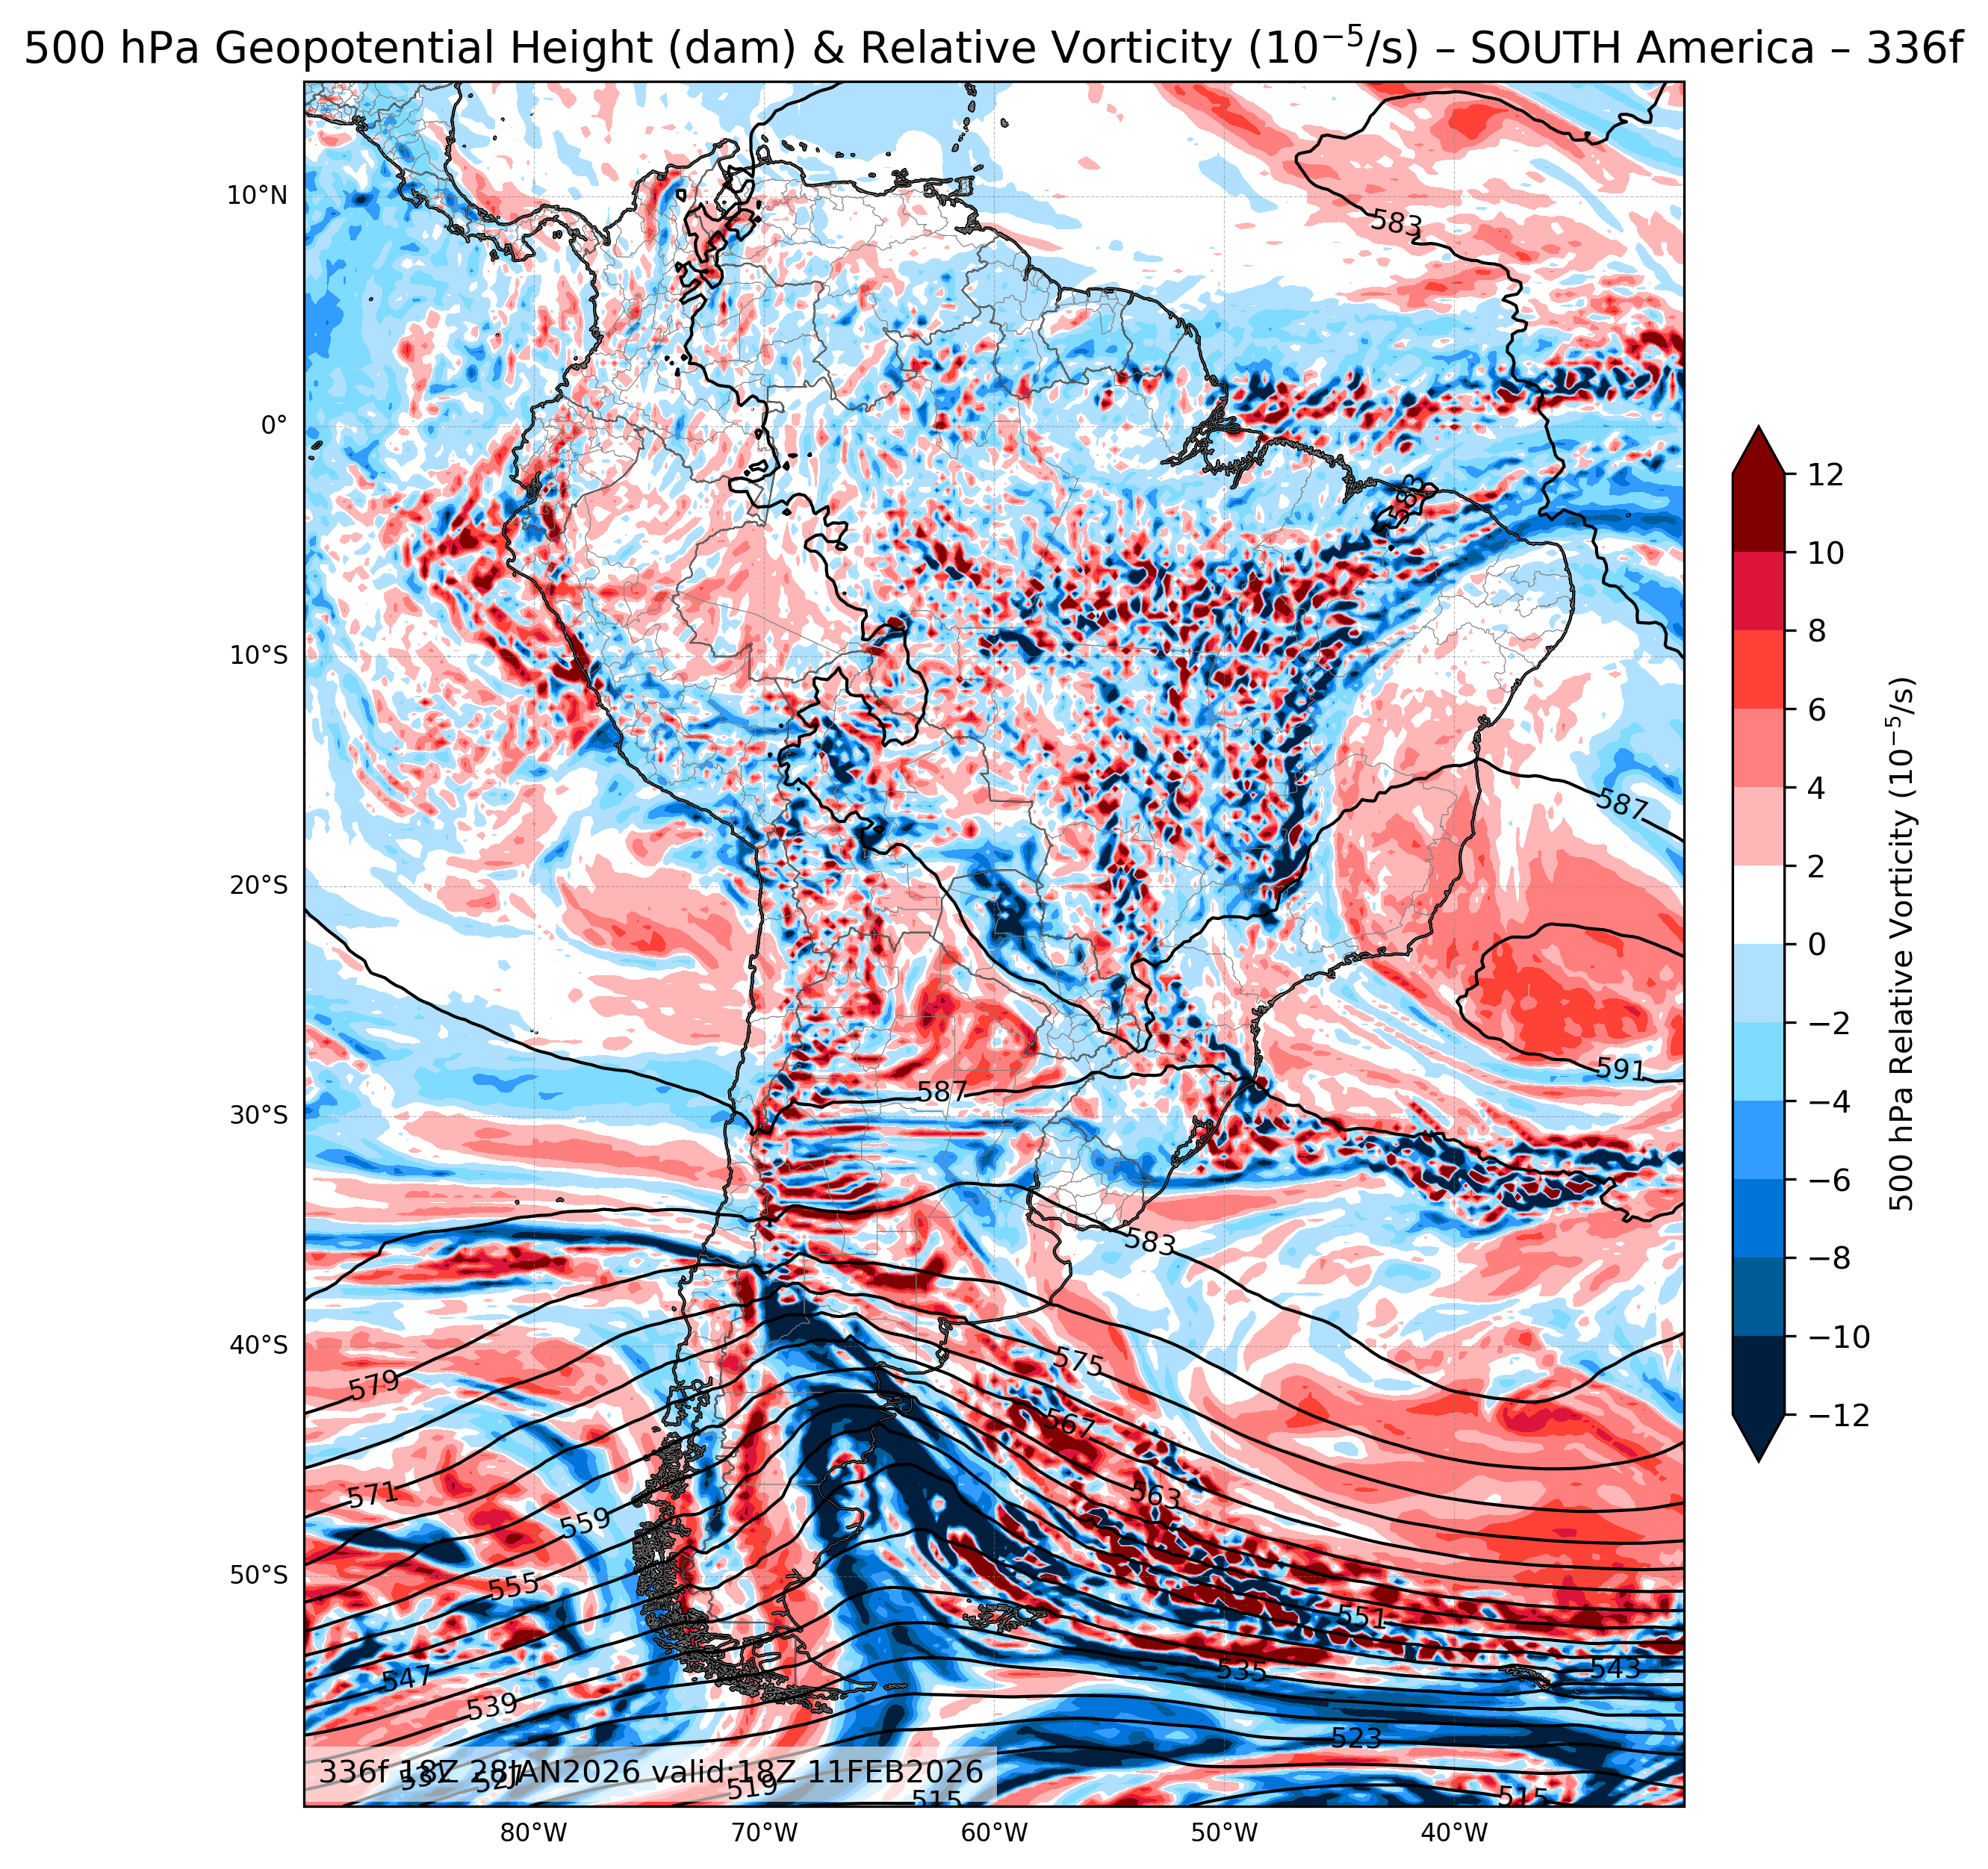
| 500mb Geopotential Height & Vorticity |
All Times |
🔍 | 🔍 | 🔍 | 🔍 | 🔍 |
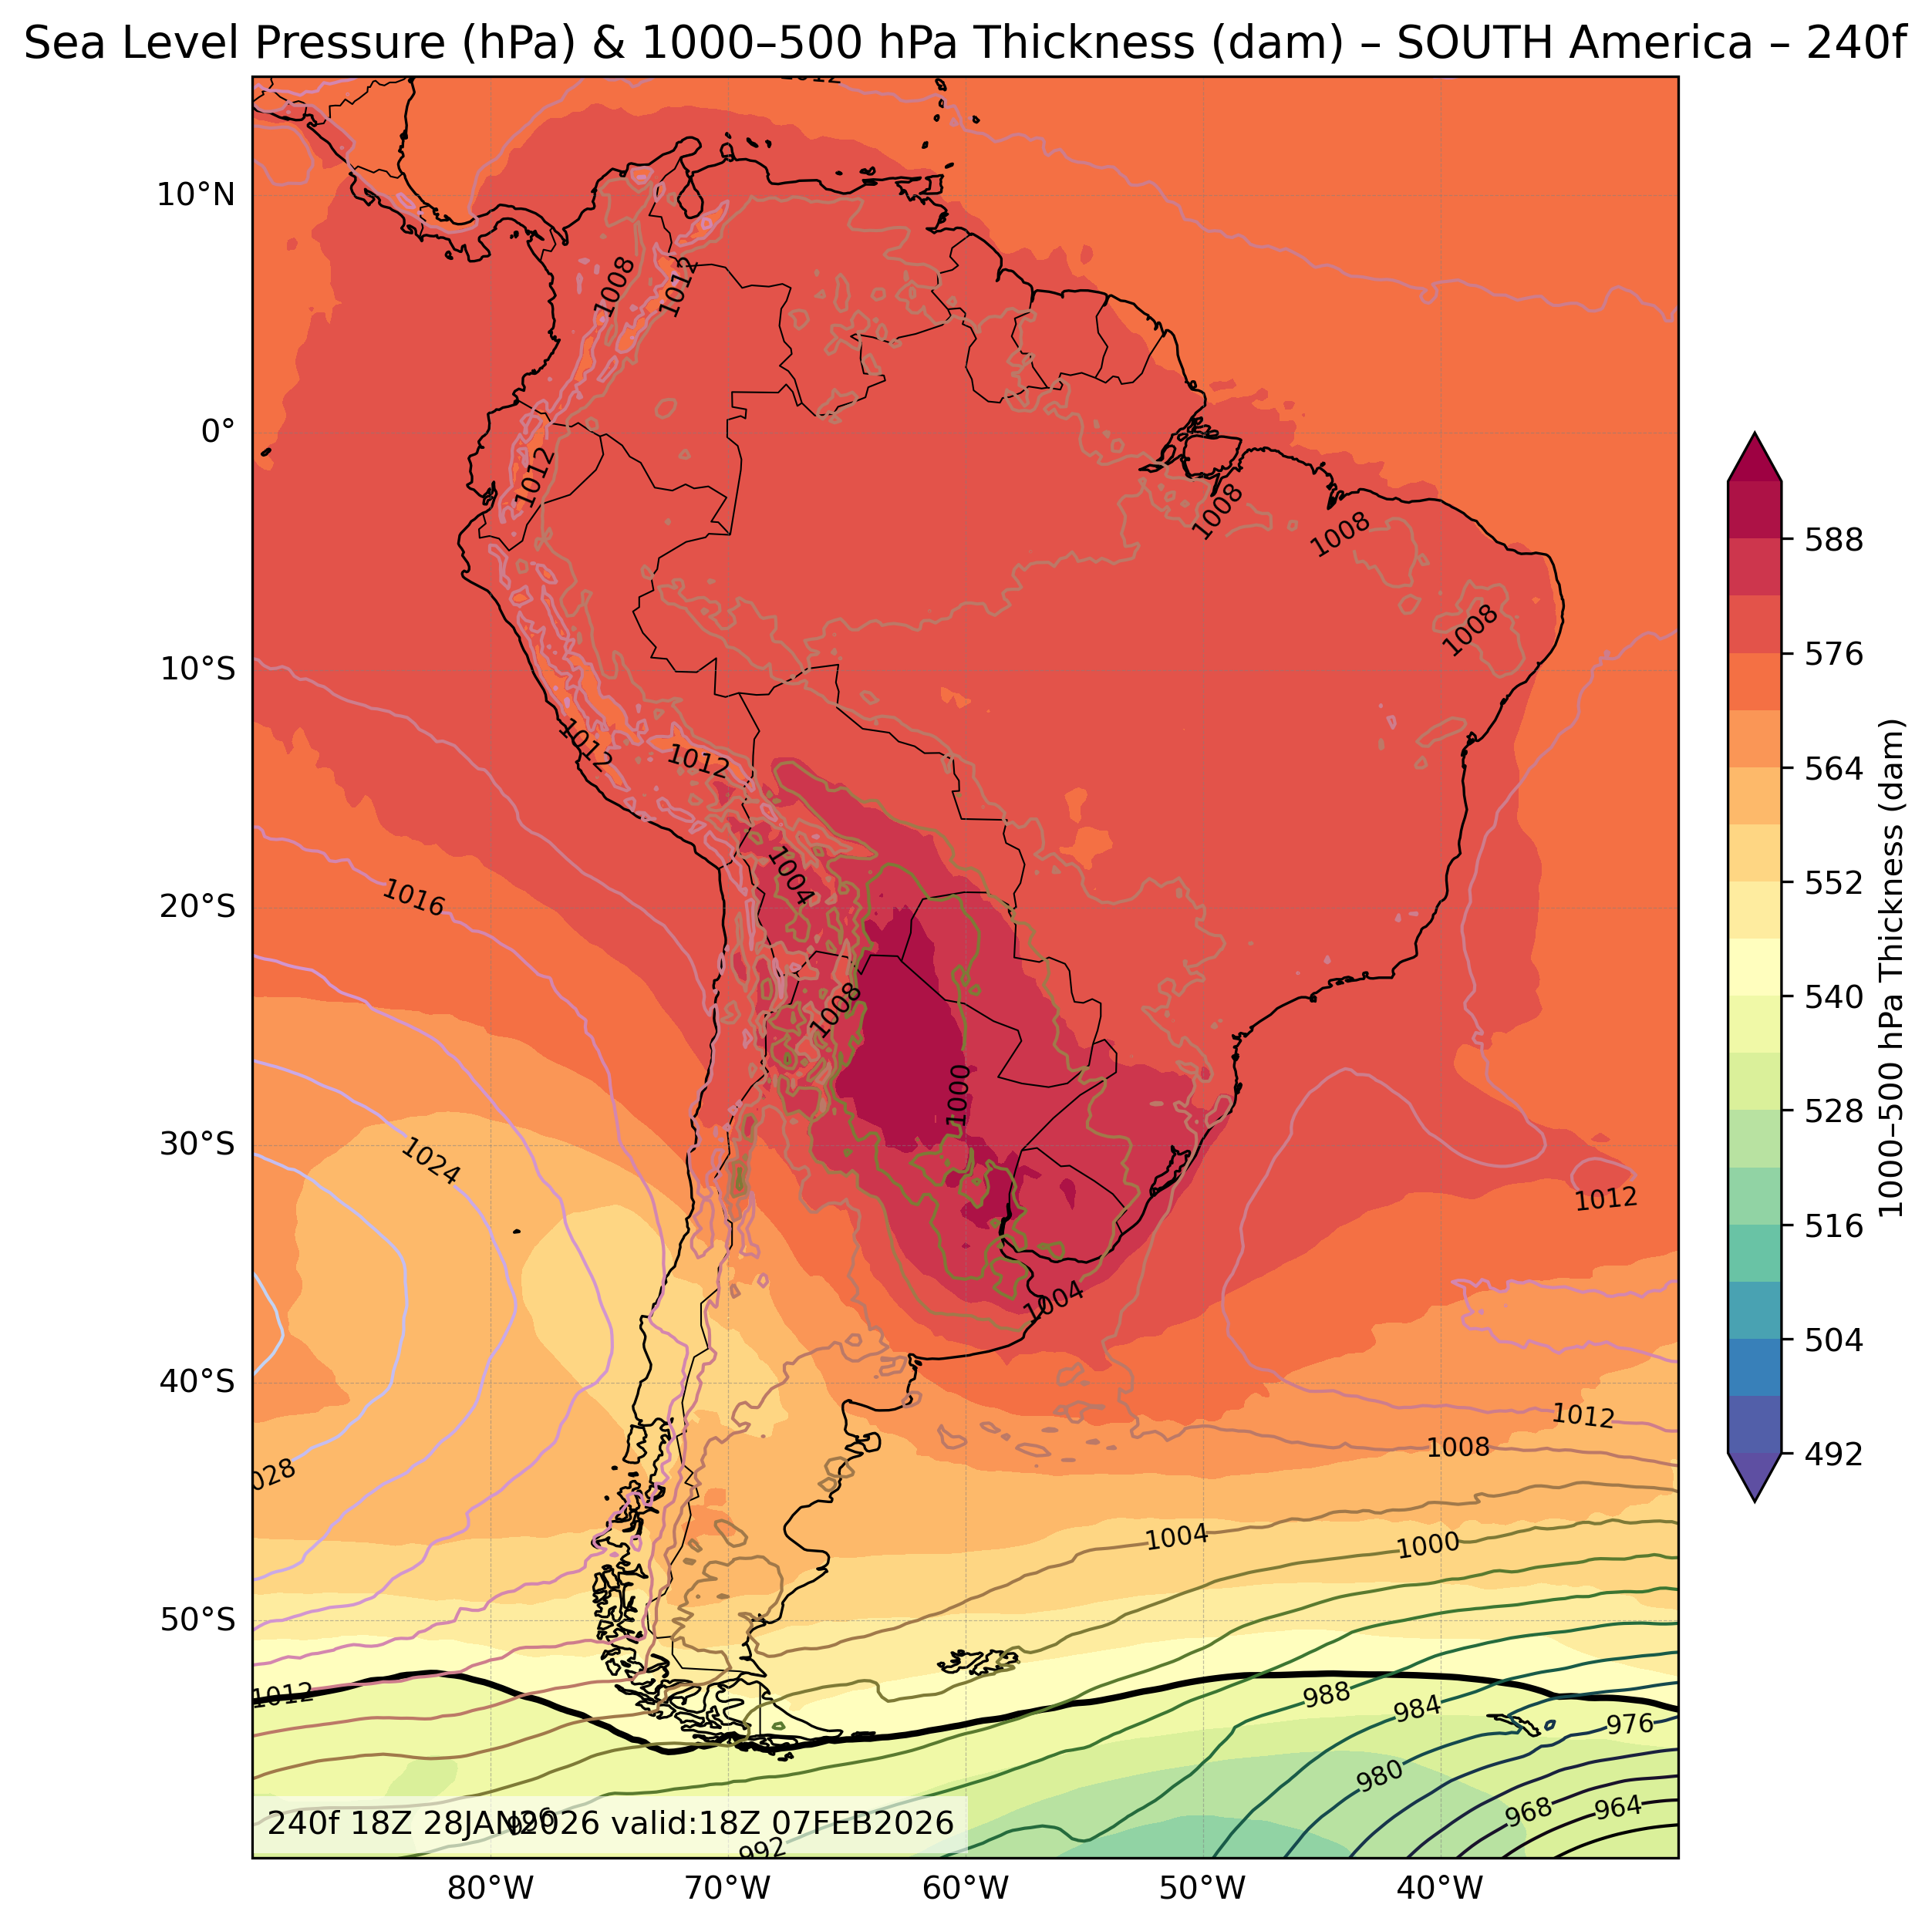
| Sea Level Pressure & 1000-500mb Thickness |
All Times |
🔍 | 🔍 | 🔍 | 🔍 | 🔍 |
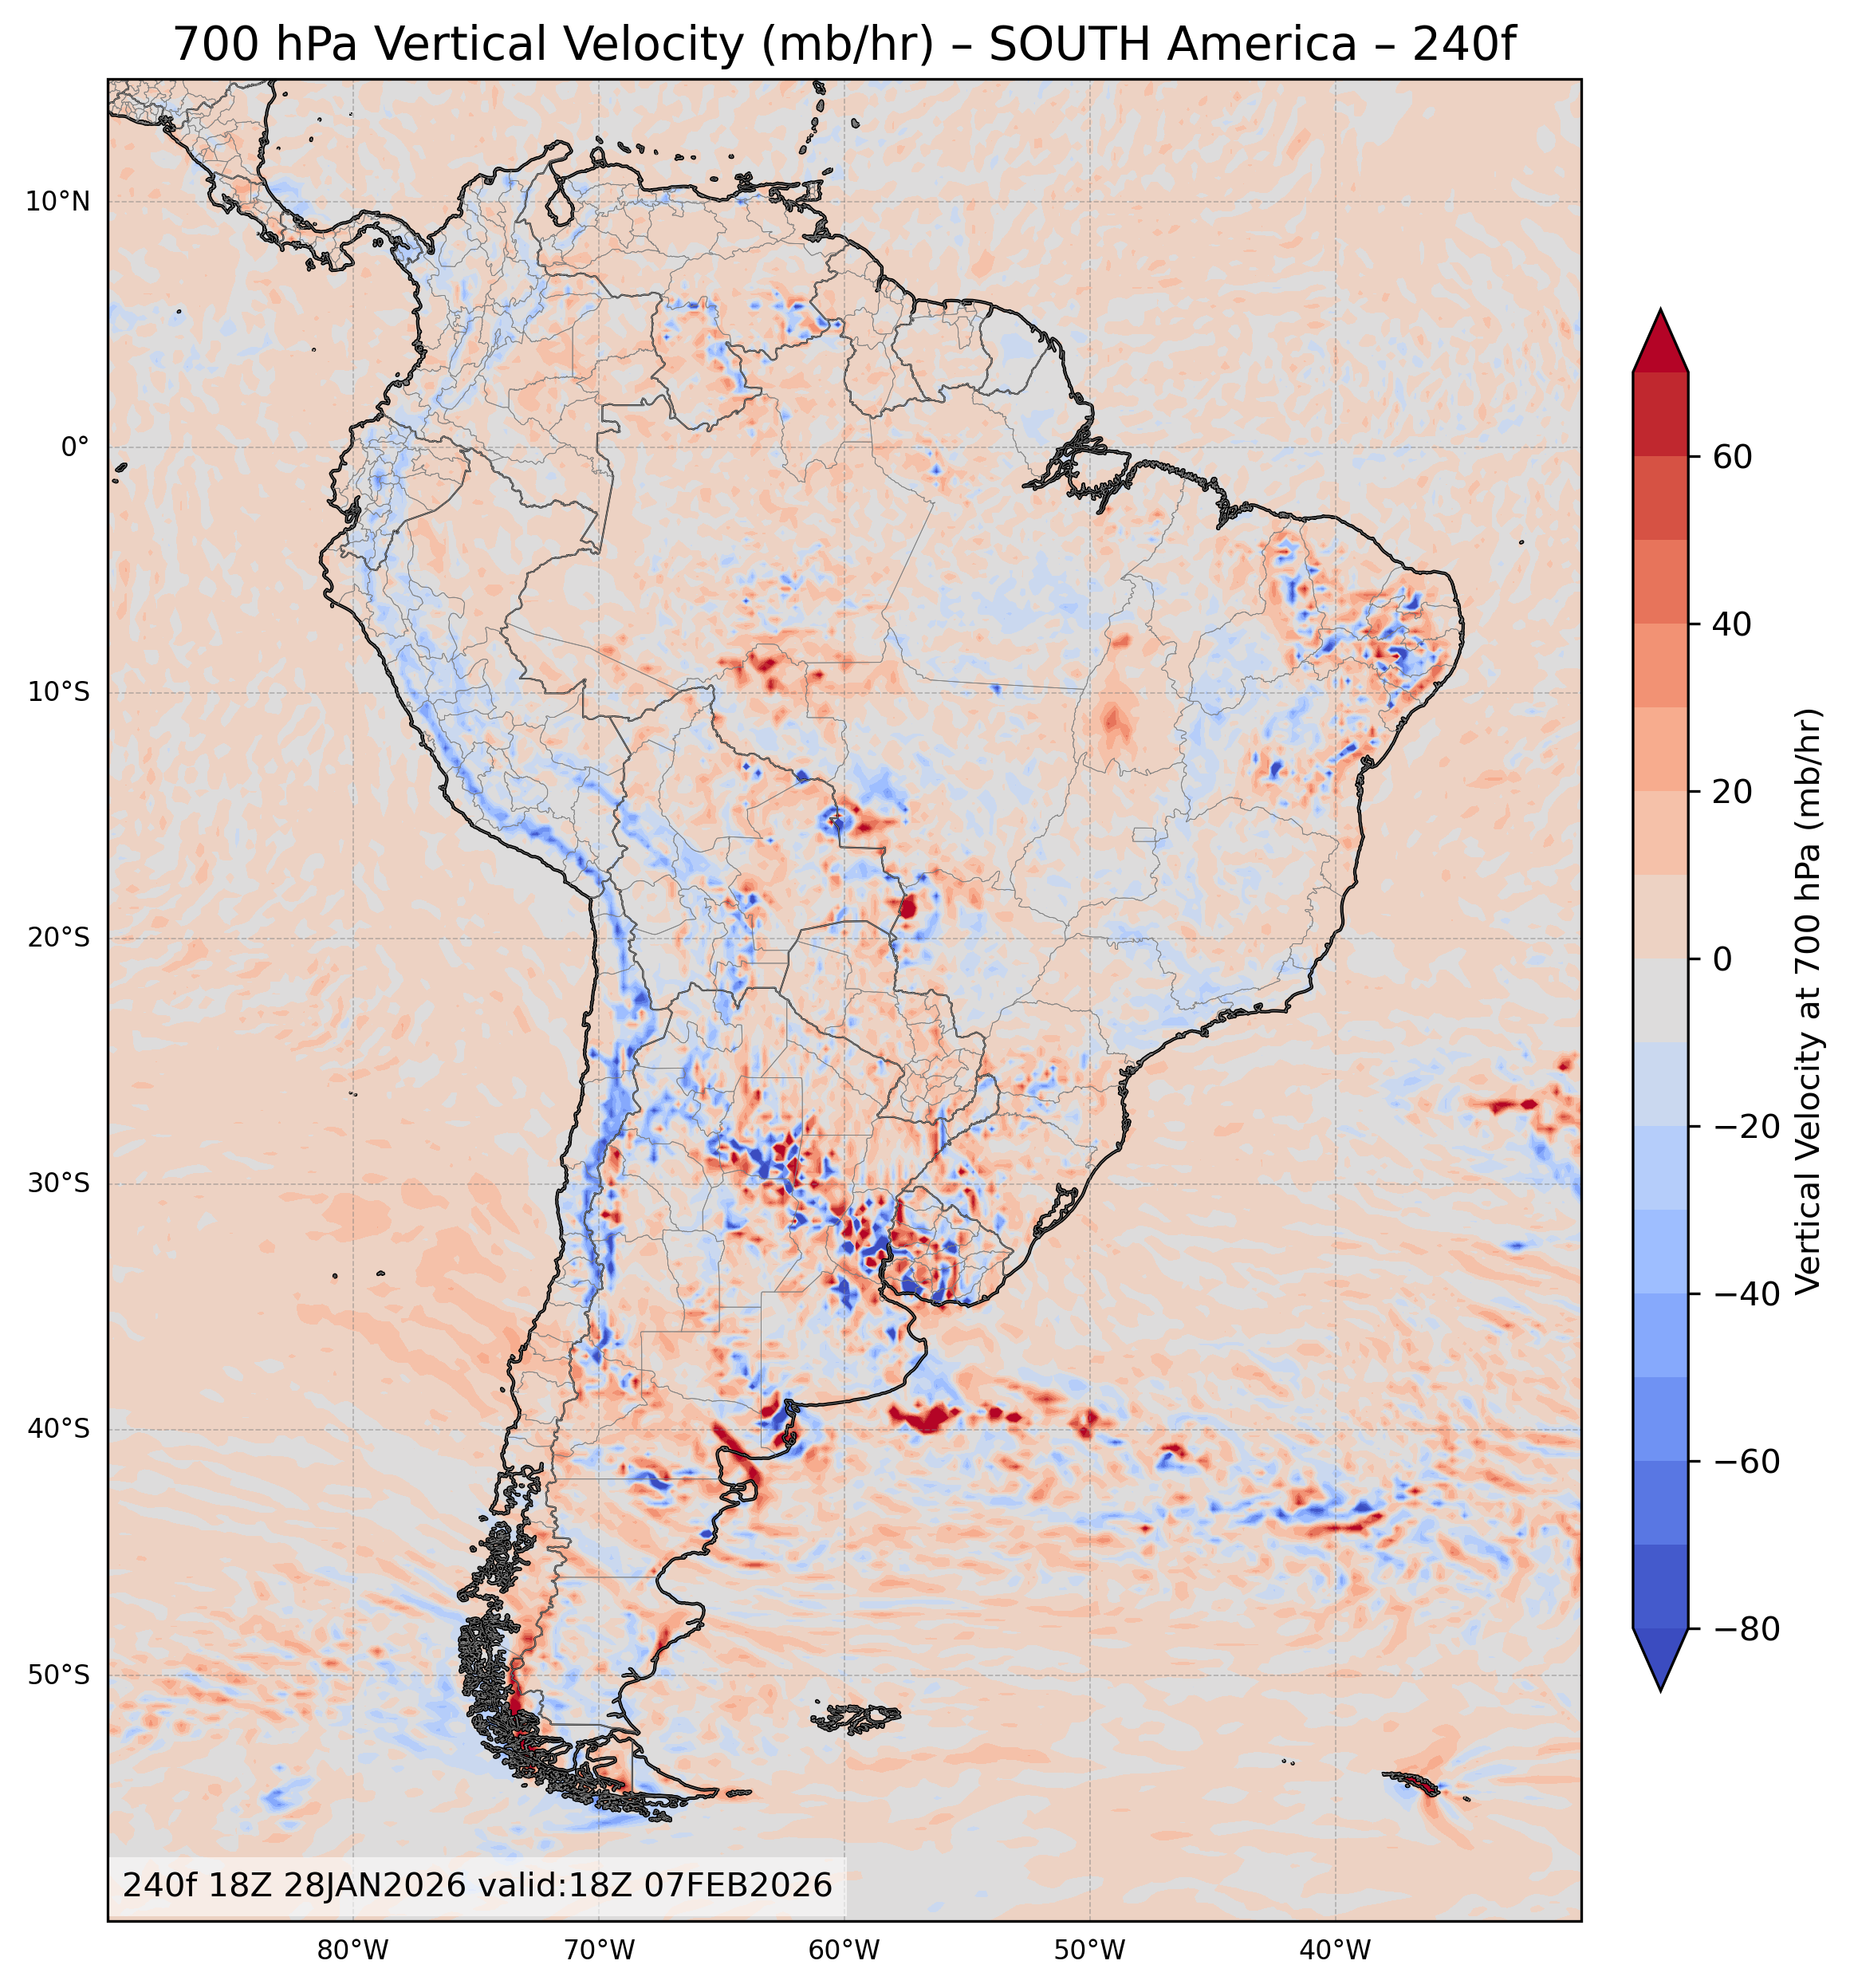
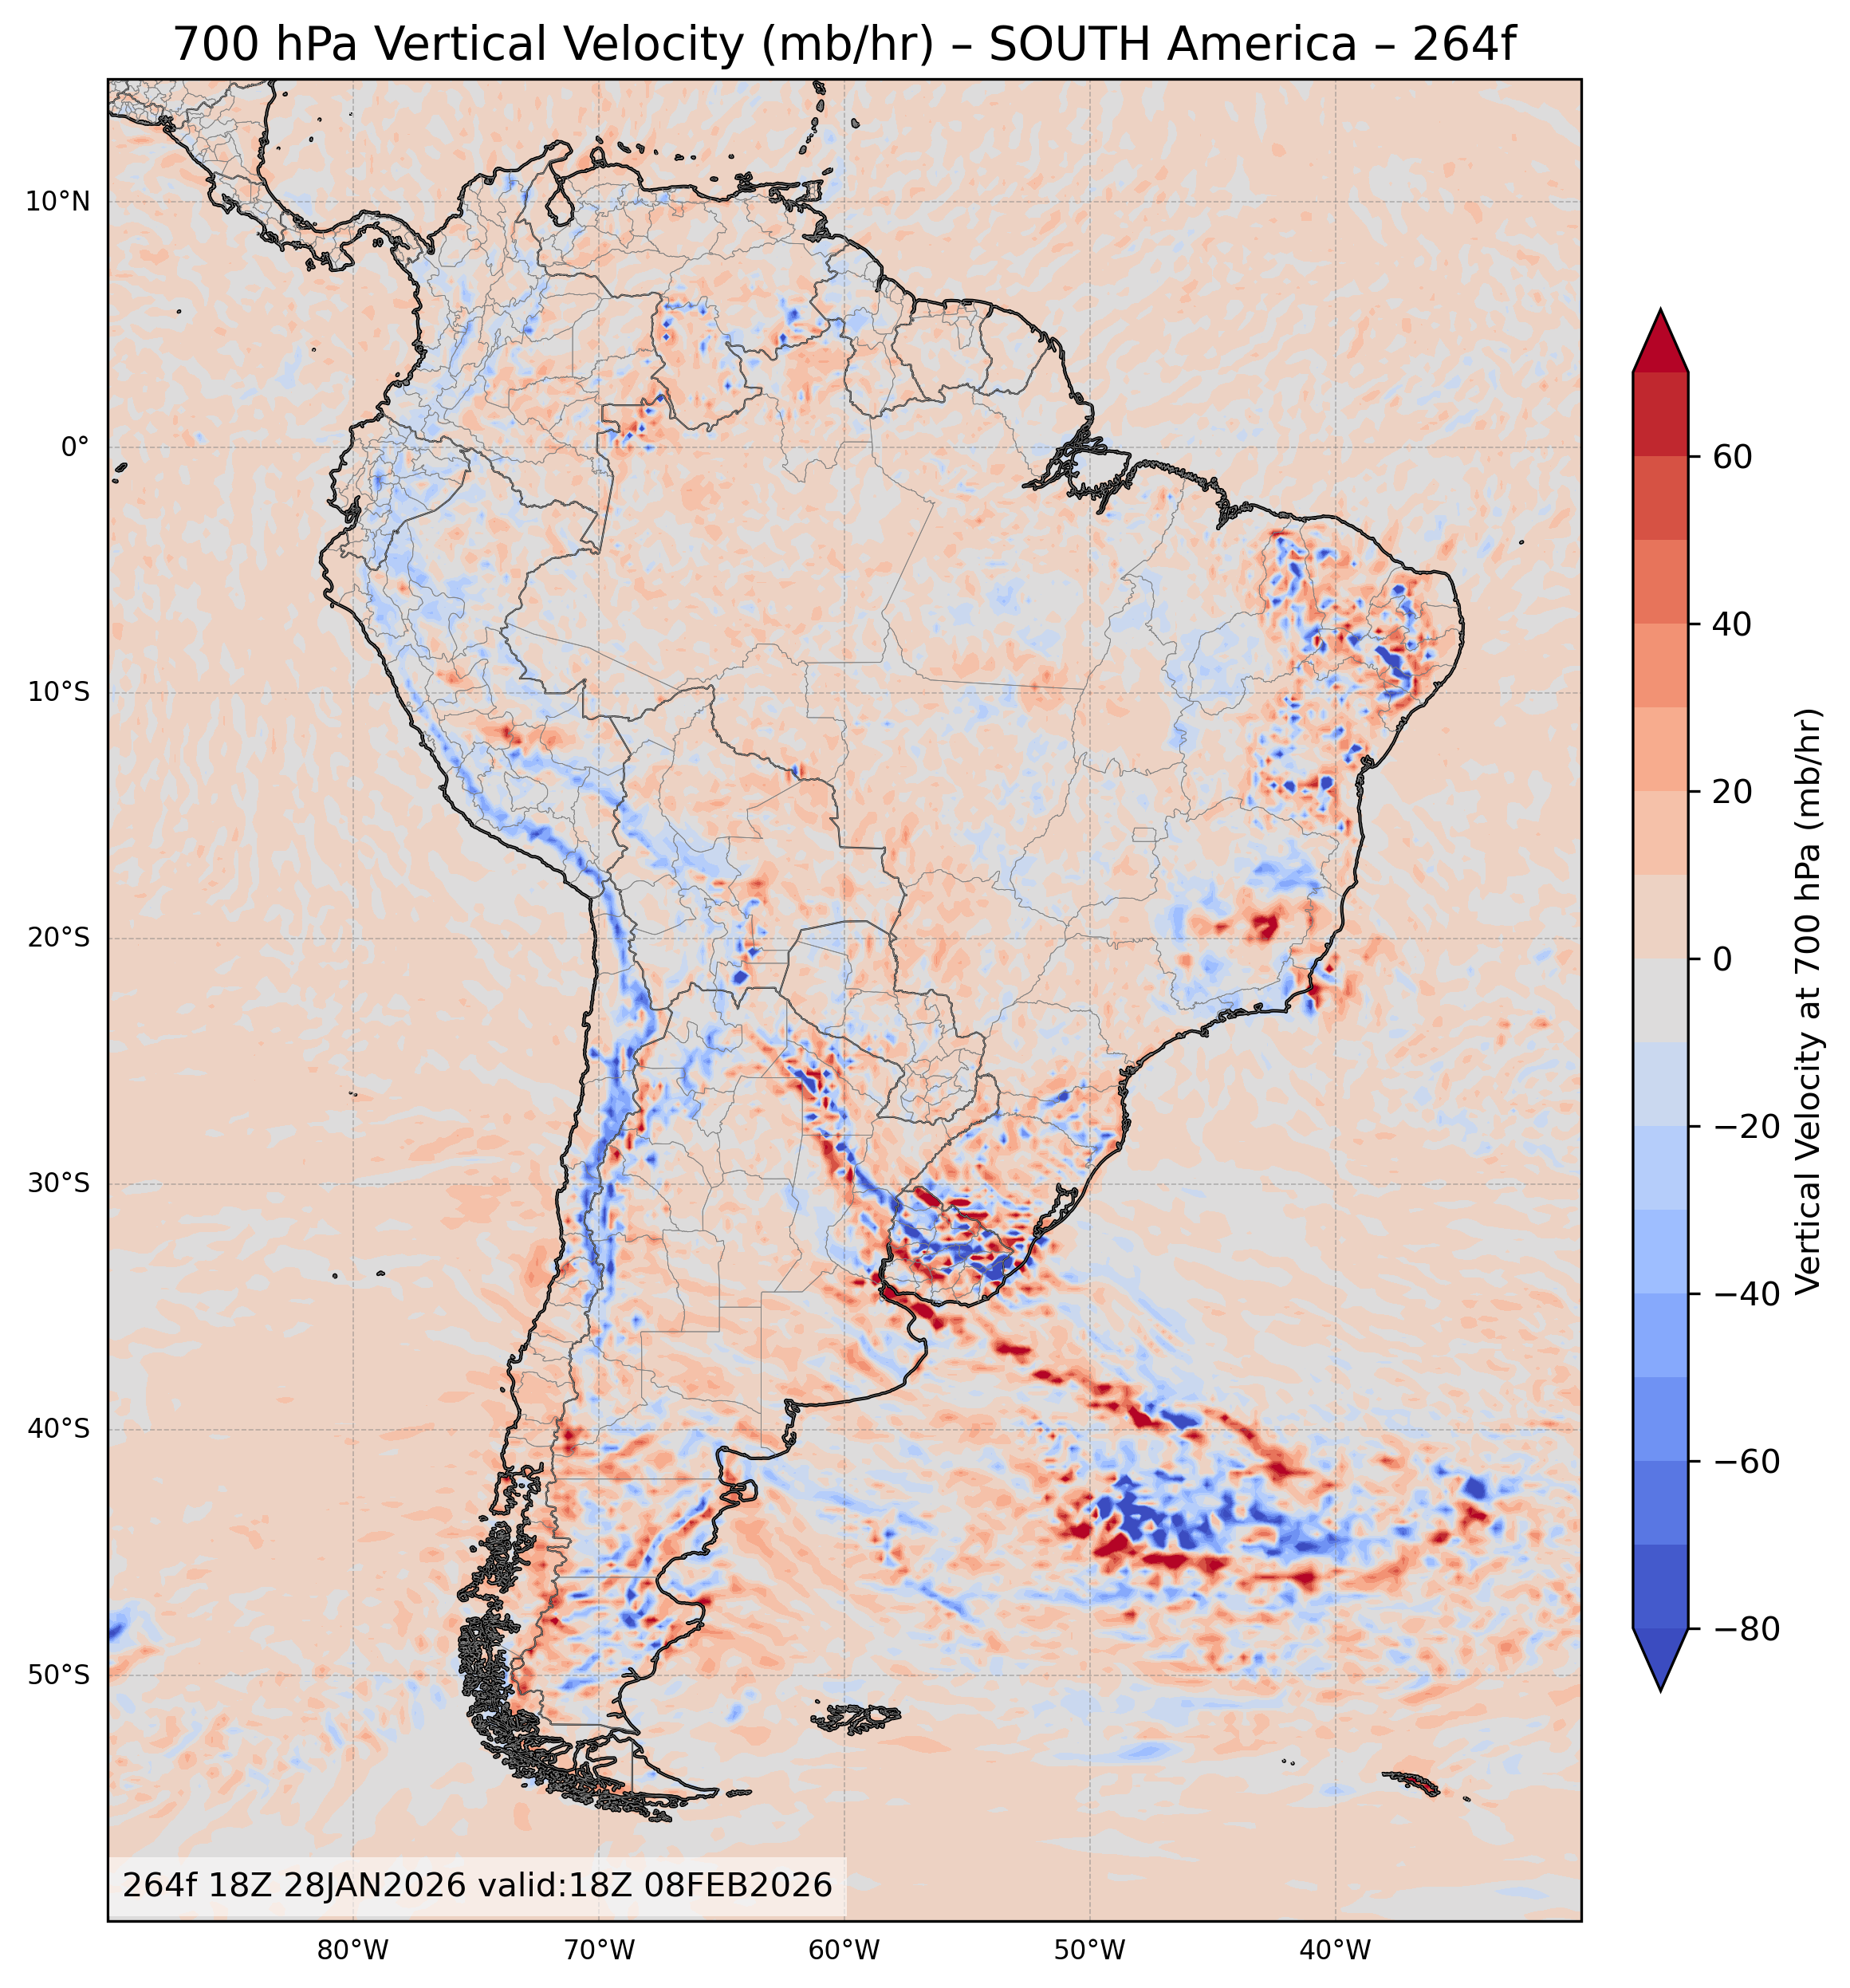
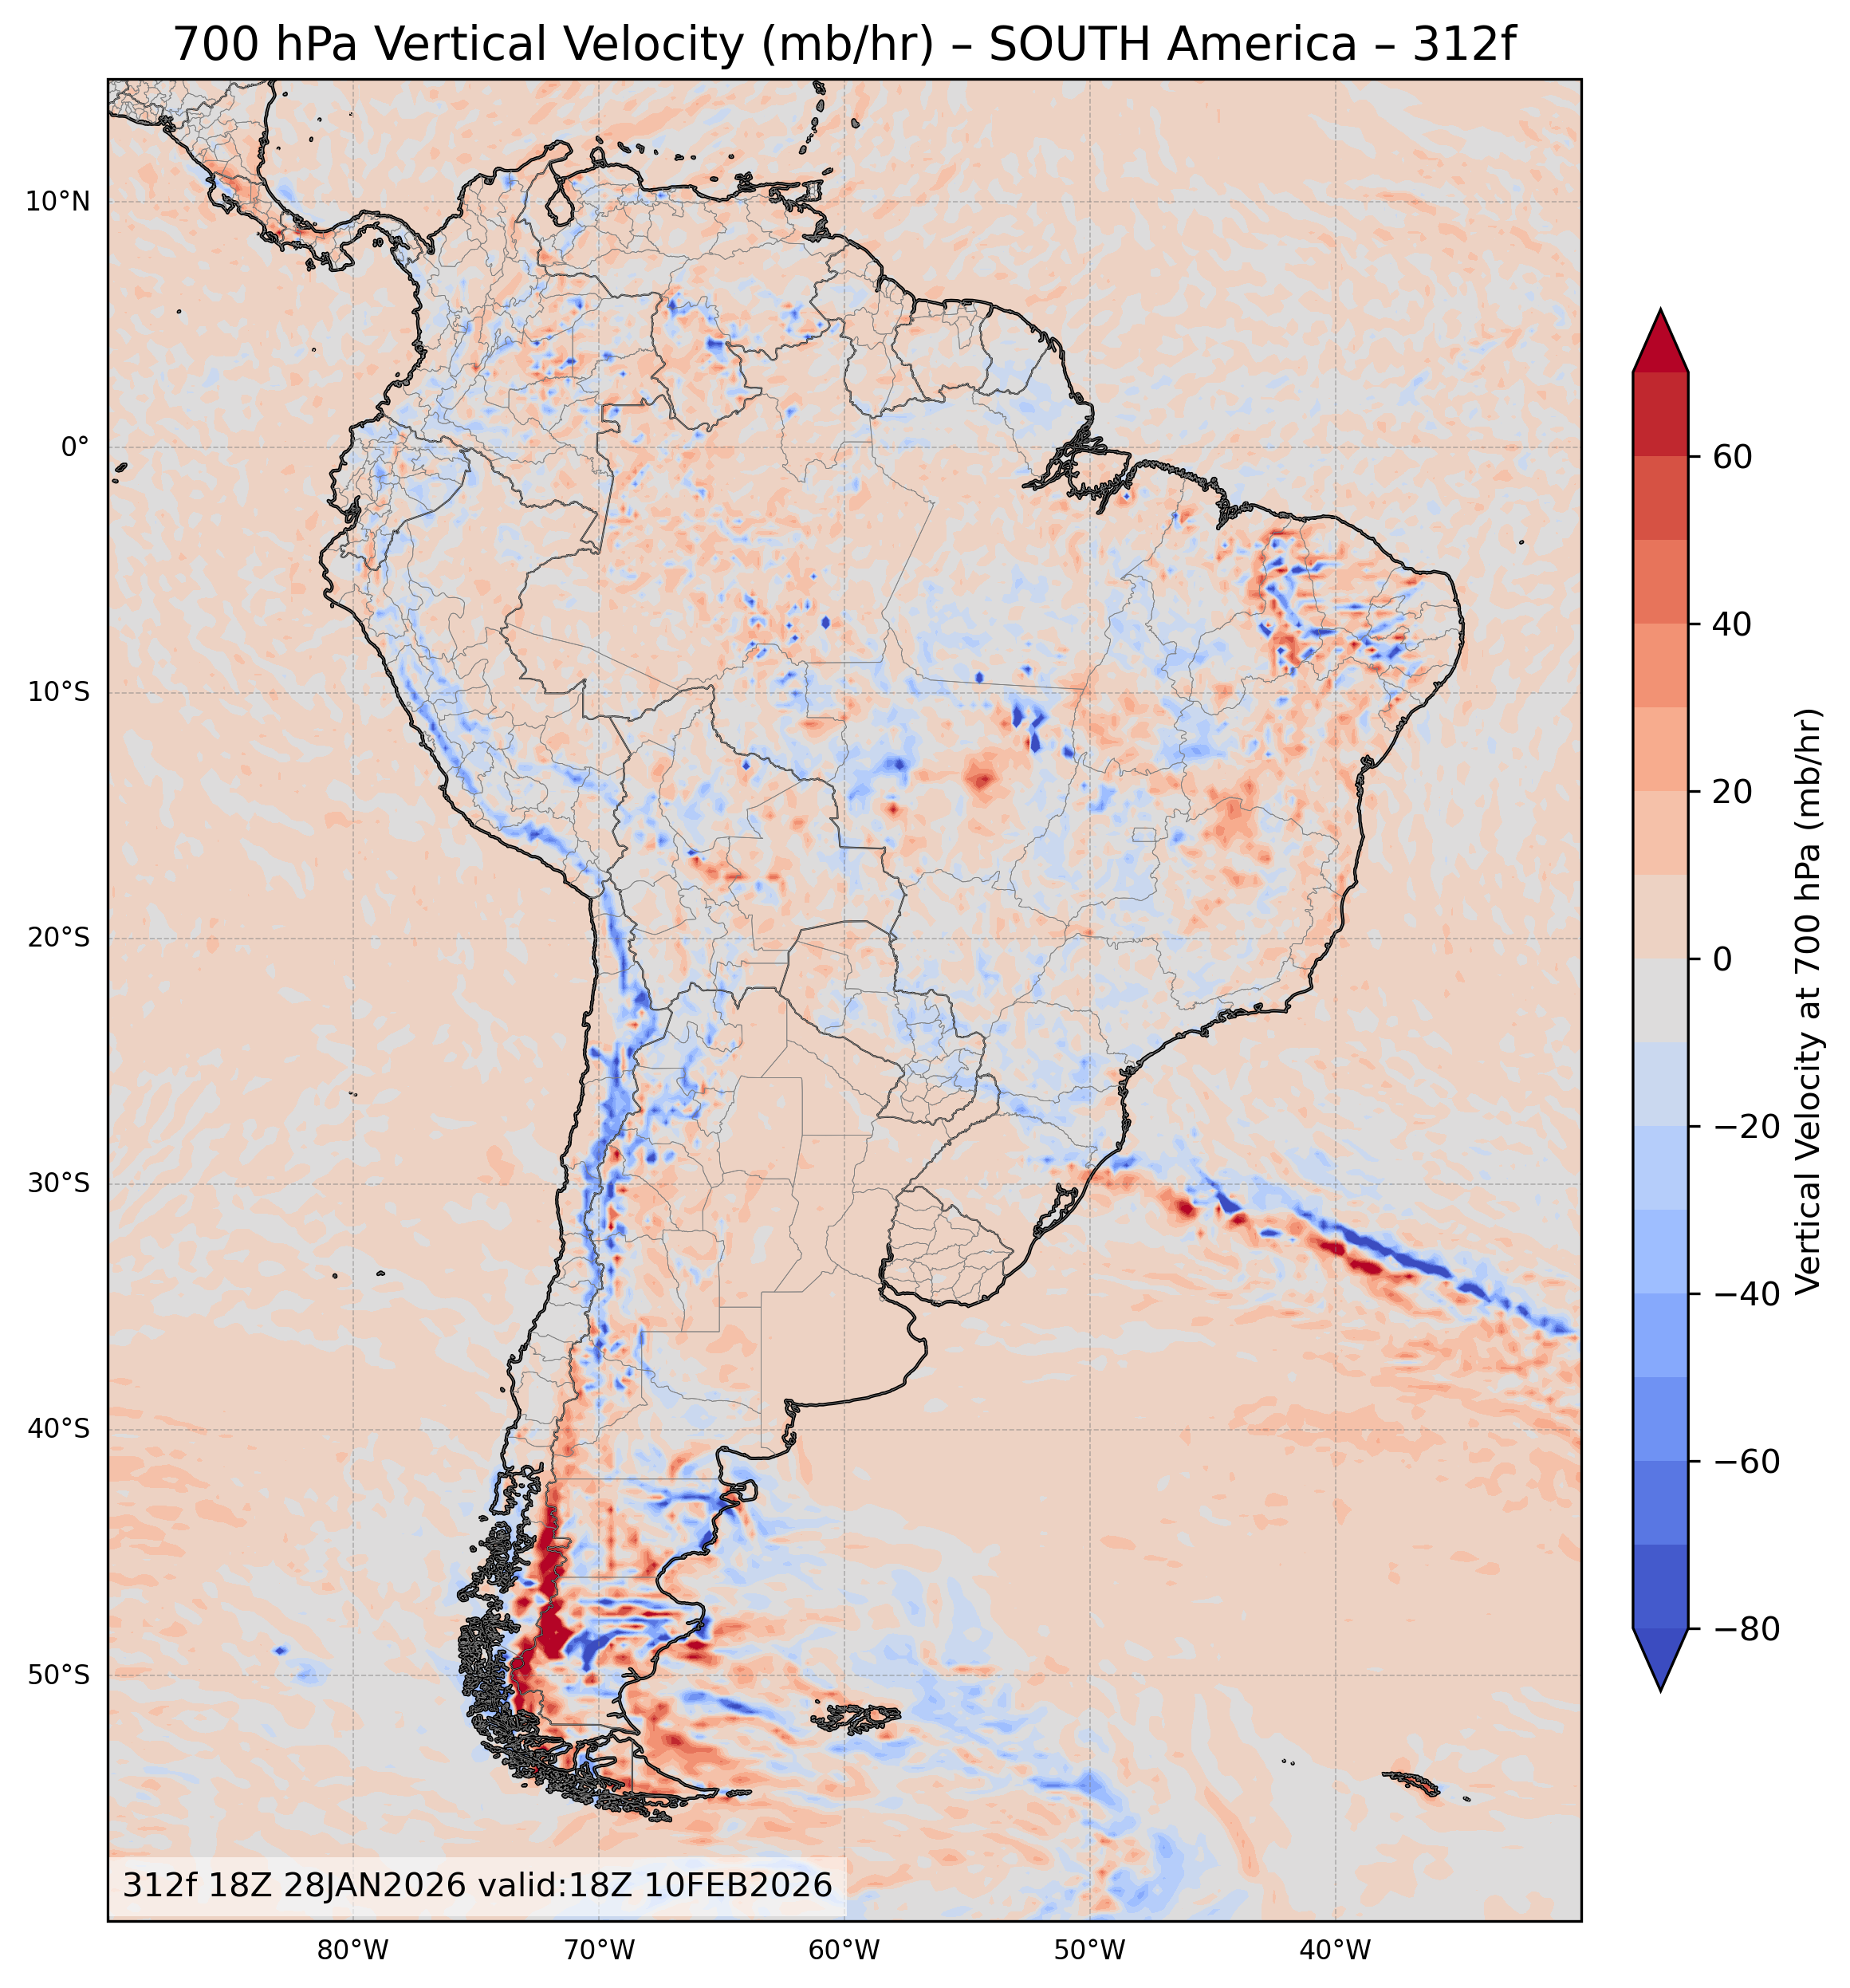
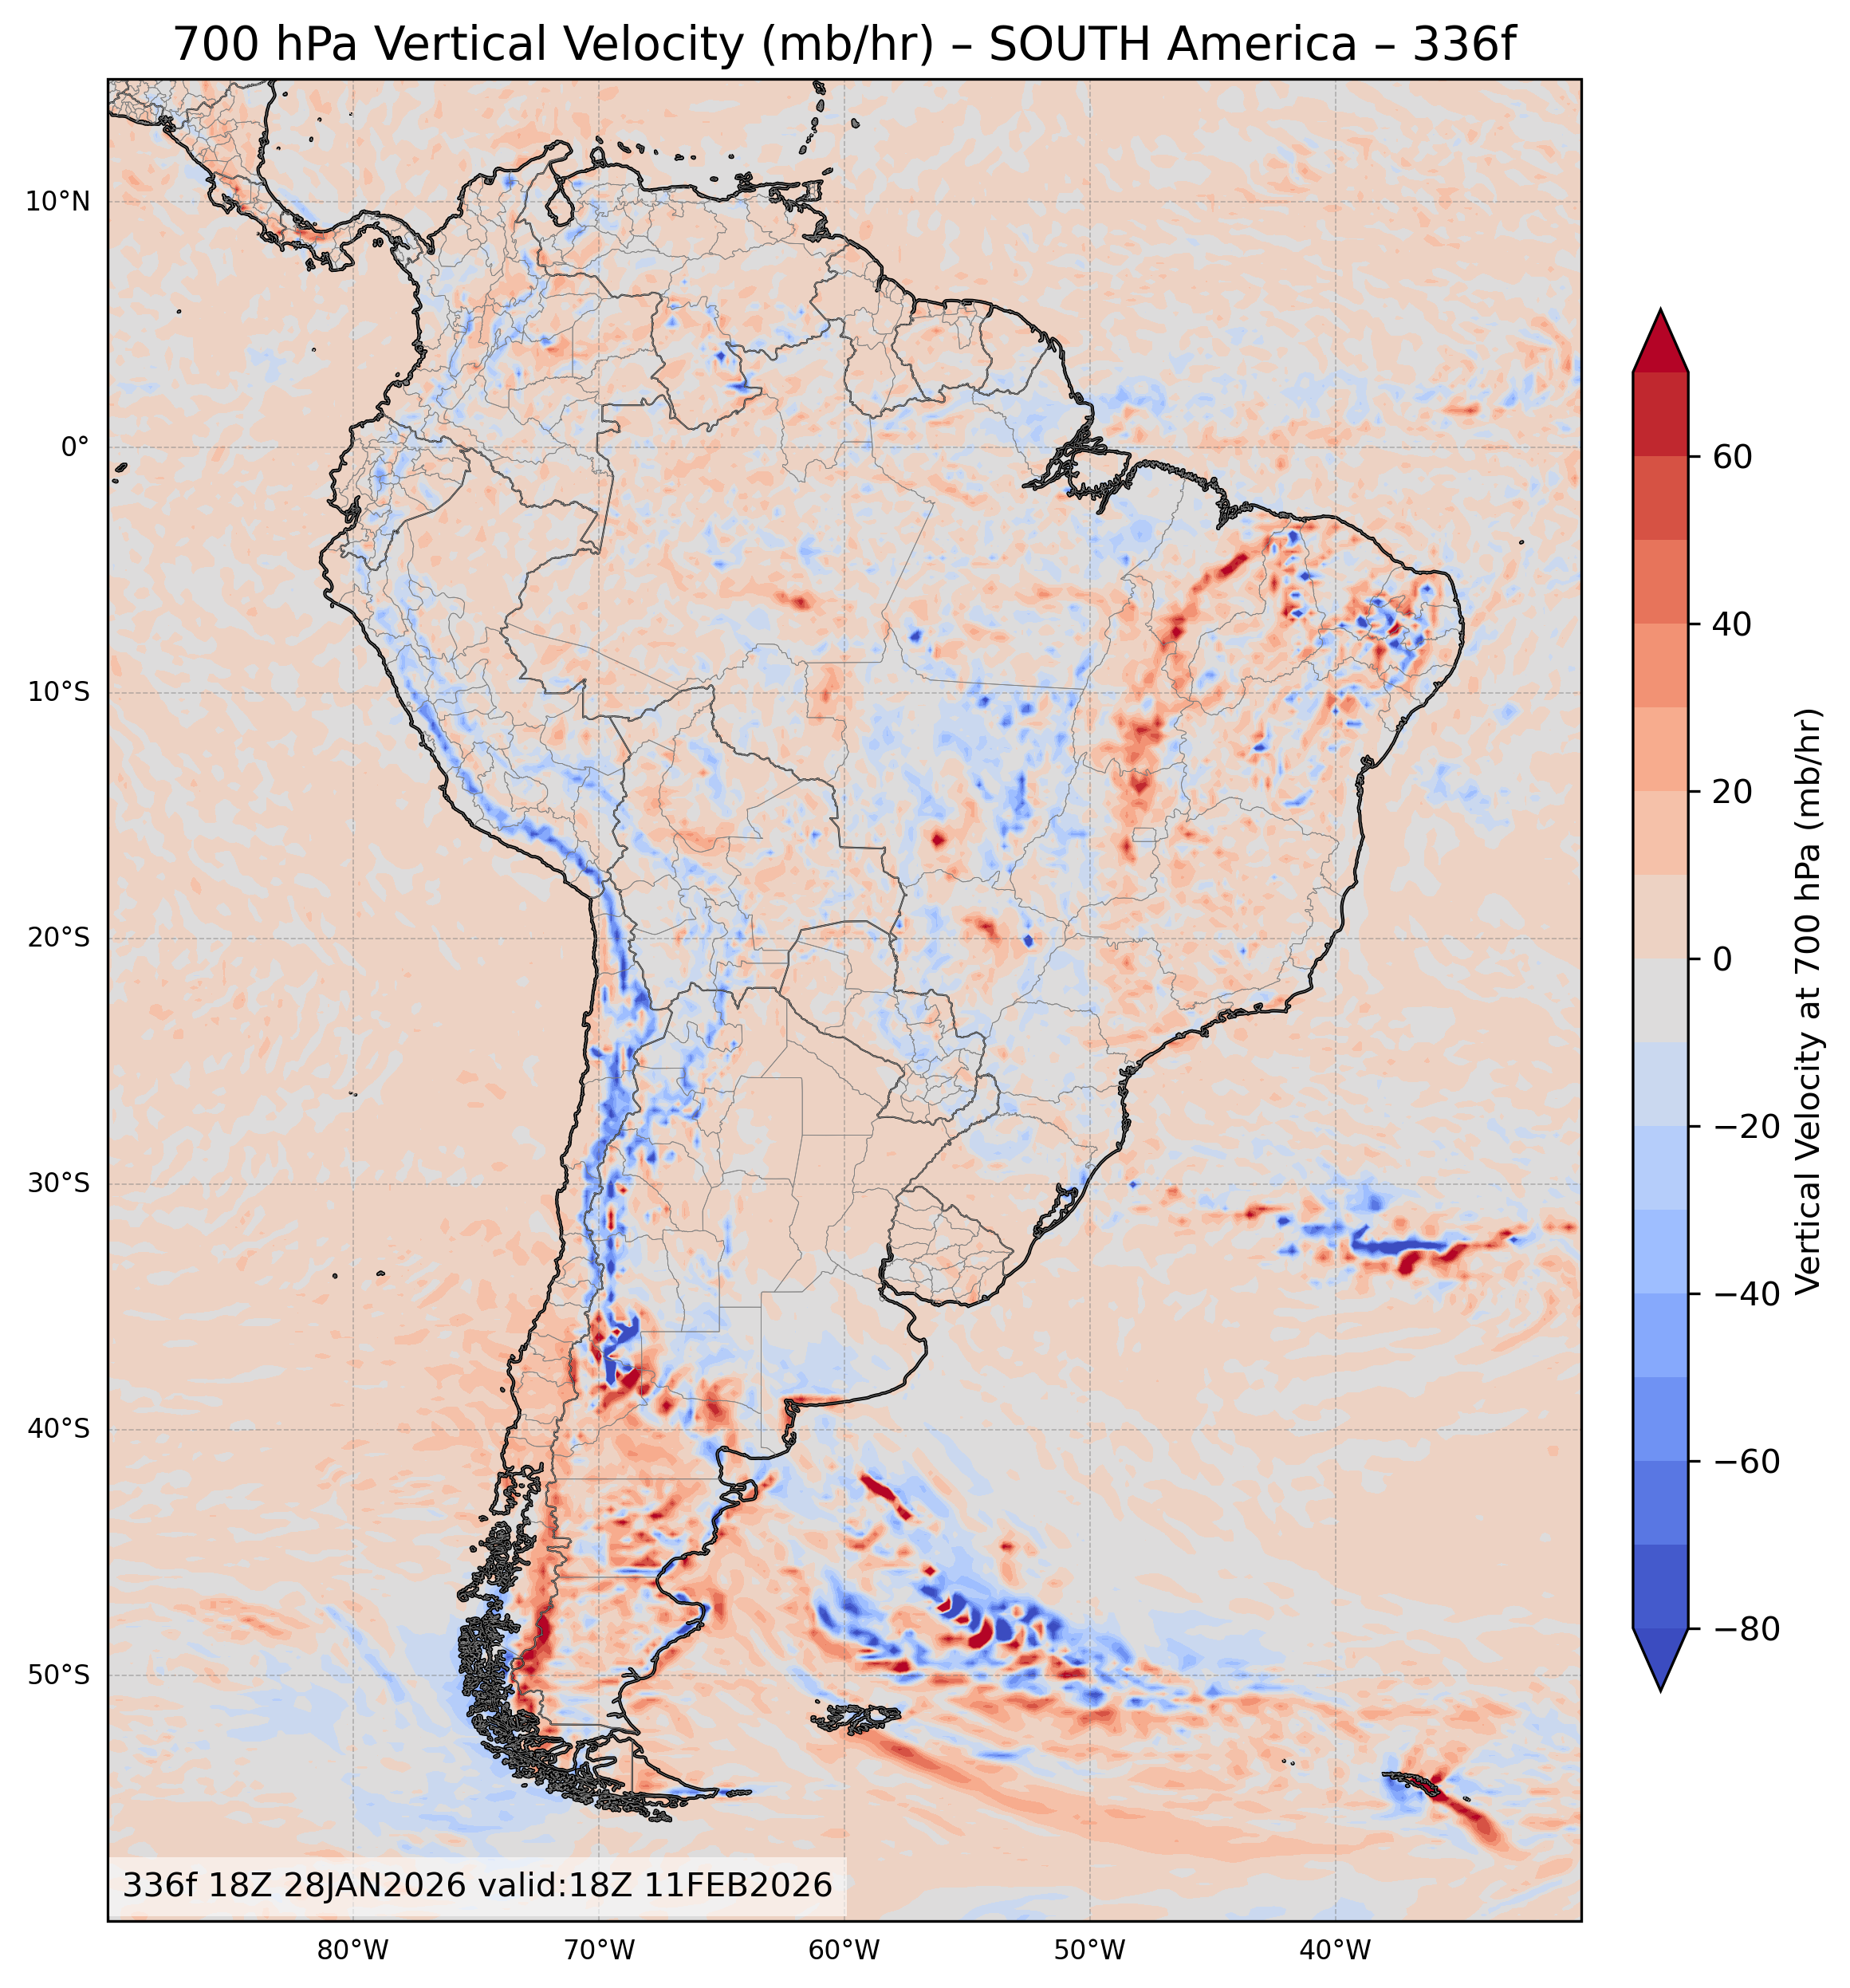
| 700 mb Vertical Velocity (mb/hr) | All Times |
🔍 | 🔍 | 🔍 | 🔍 | 🔍 |
| 850mb Temperature Relative Humidity & Winds |
All Times |
🔍 | 🔍 | 🔍 | 🔍 | 🔍 |
| 200mb Streamlines & Isotachs |
All Times |
🔍 | 🔍 | 🔍 | 🔍 | 🔍 |
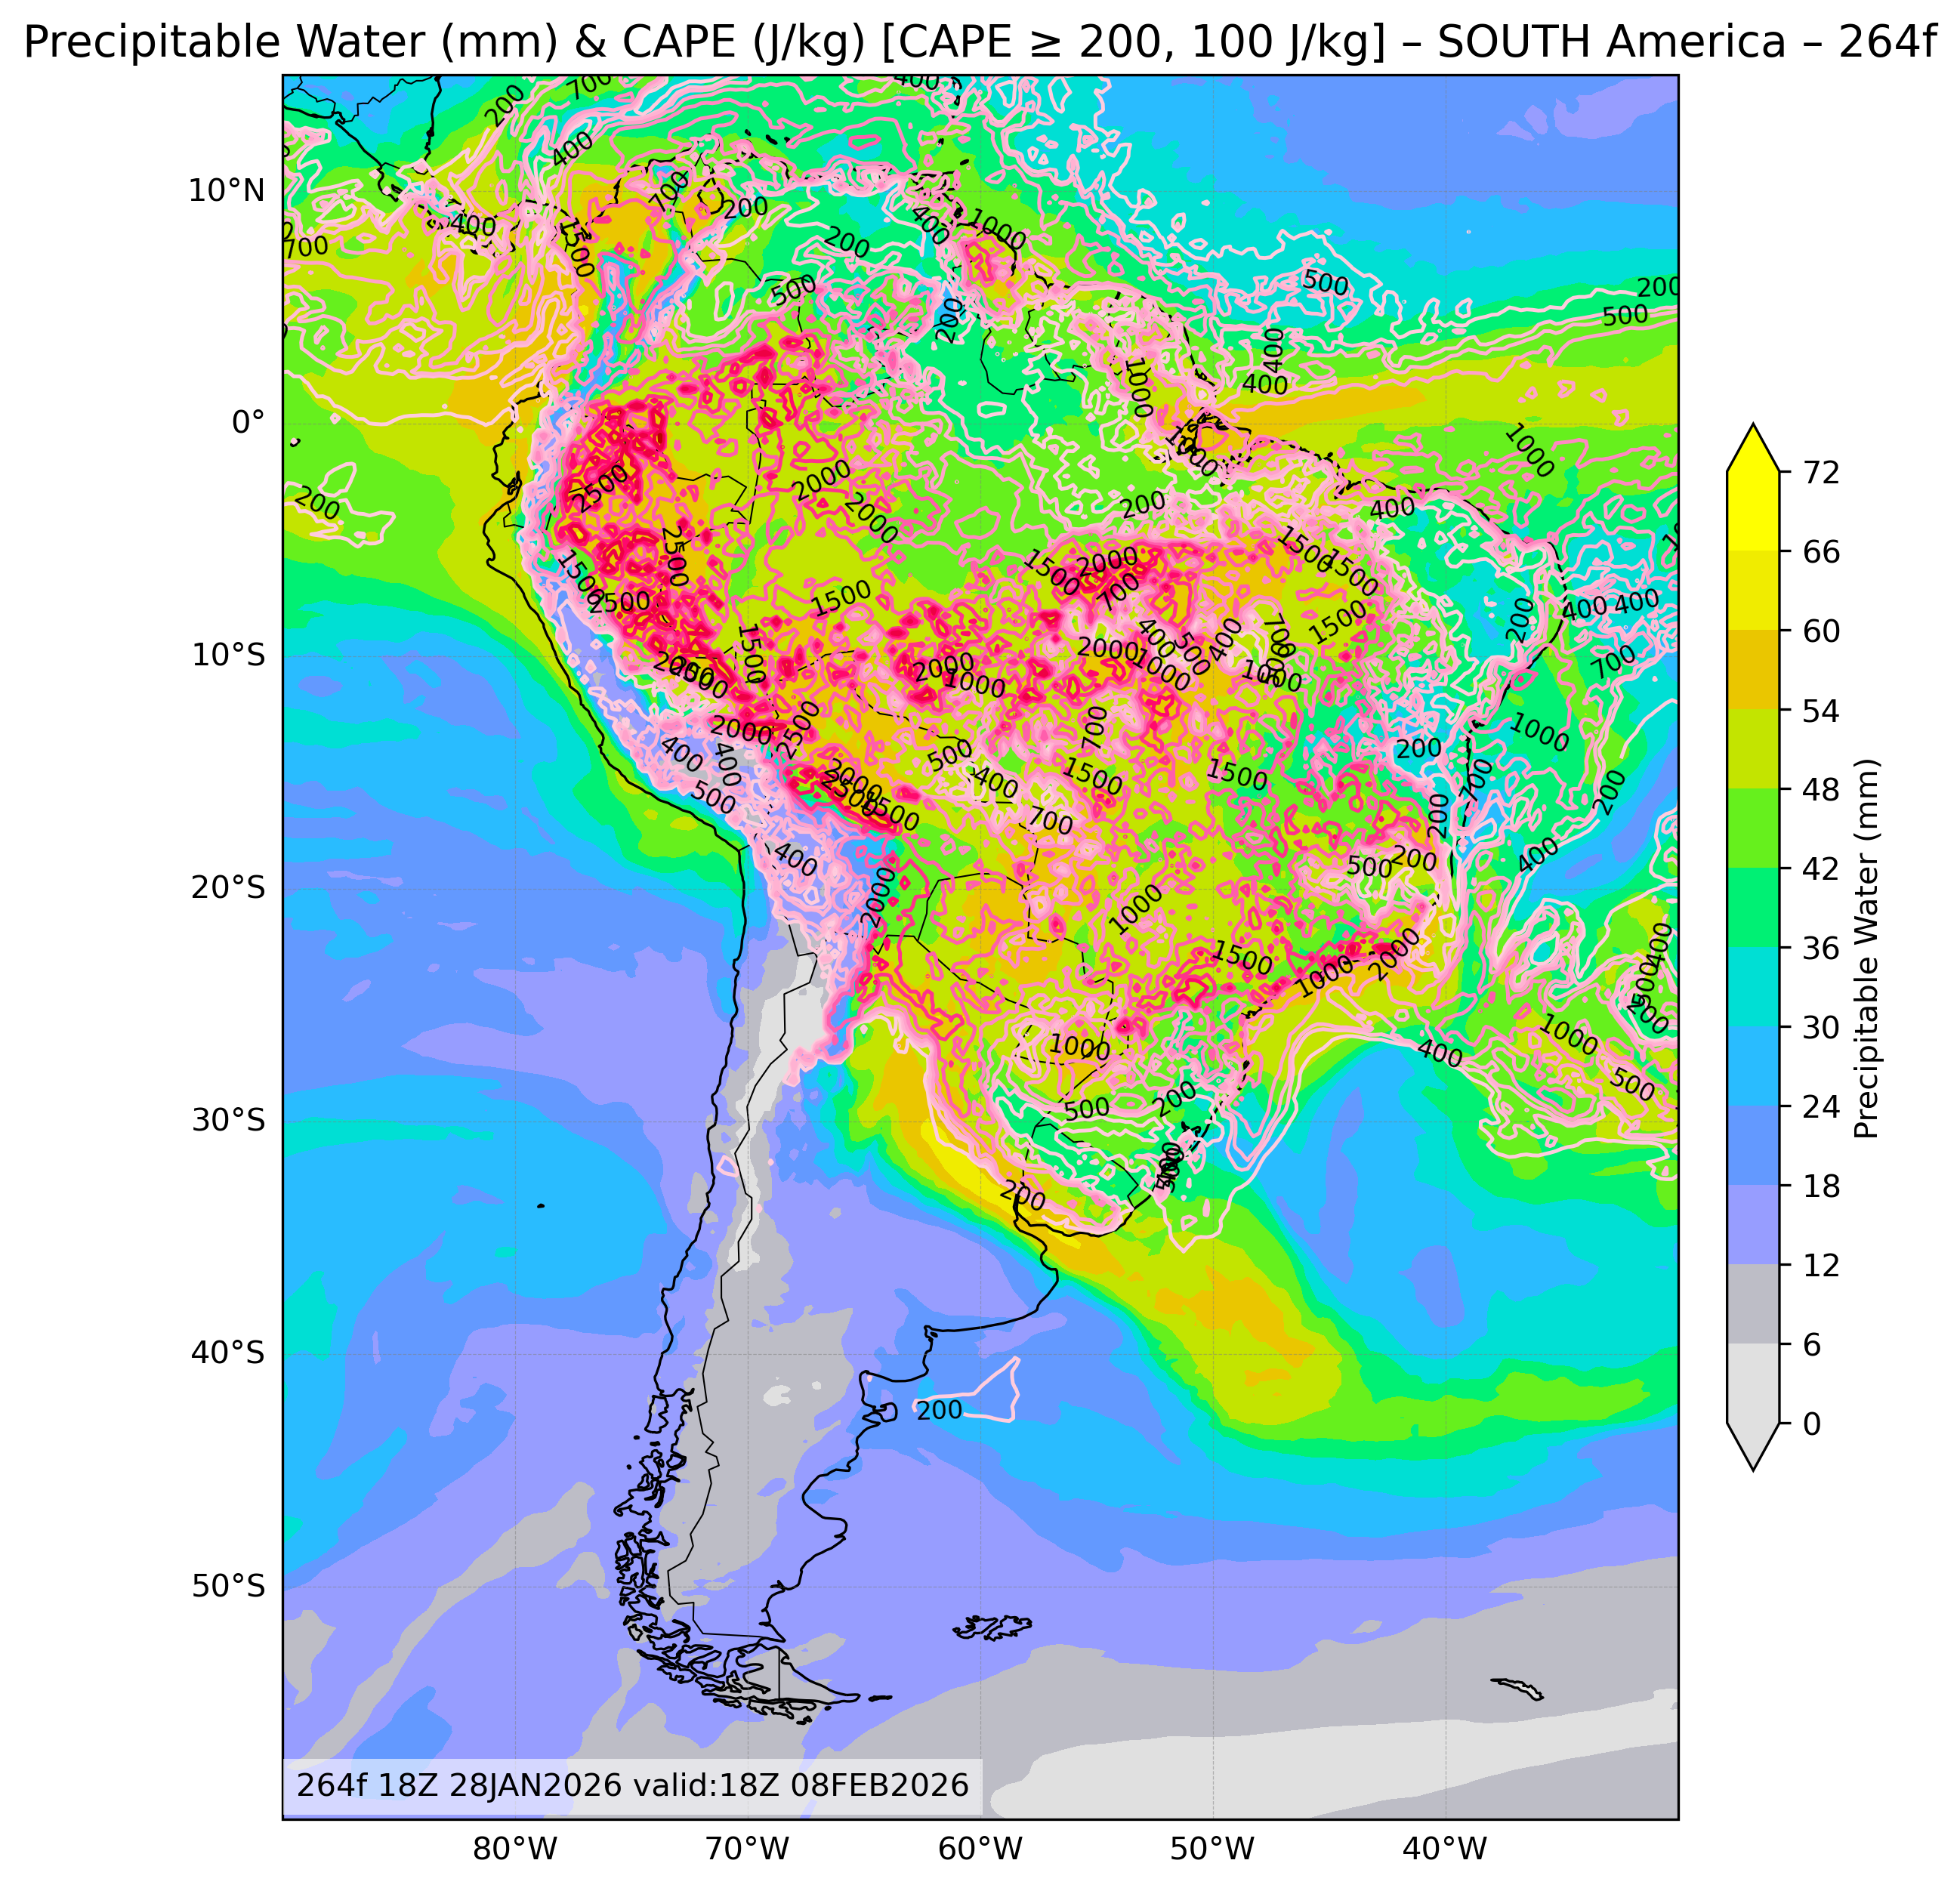
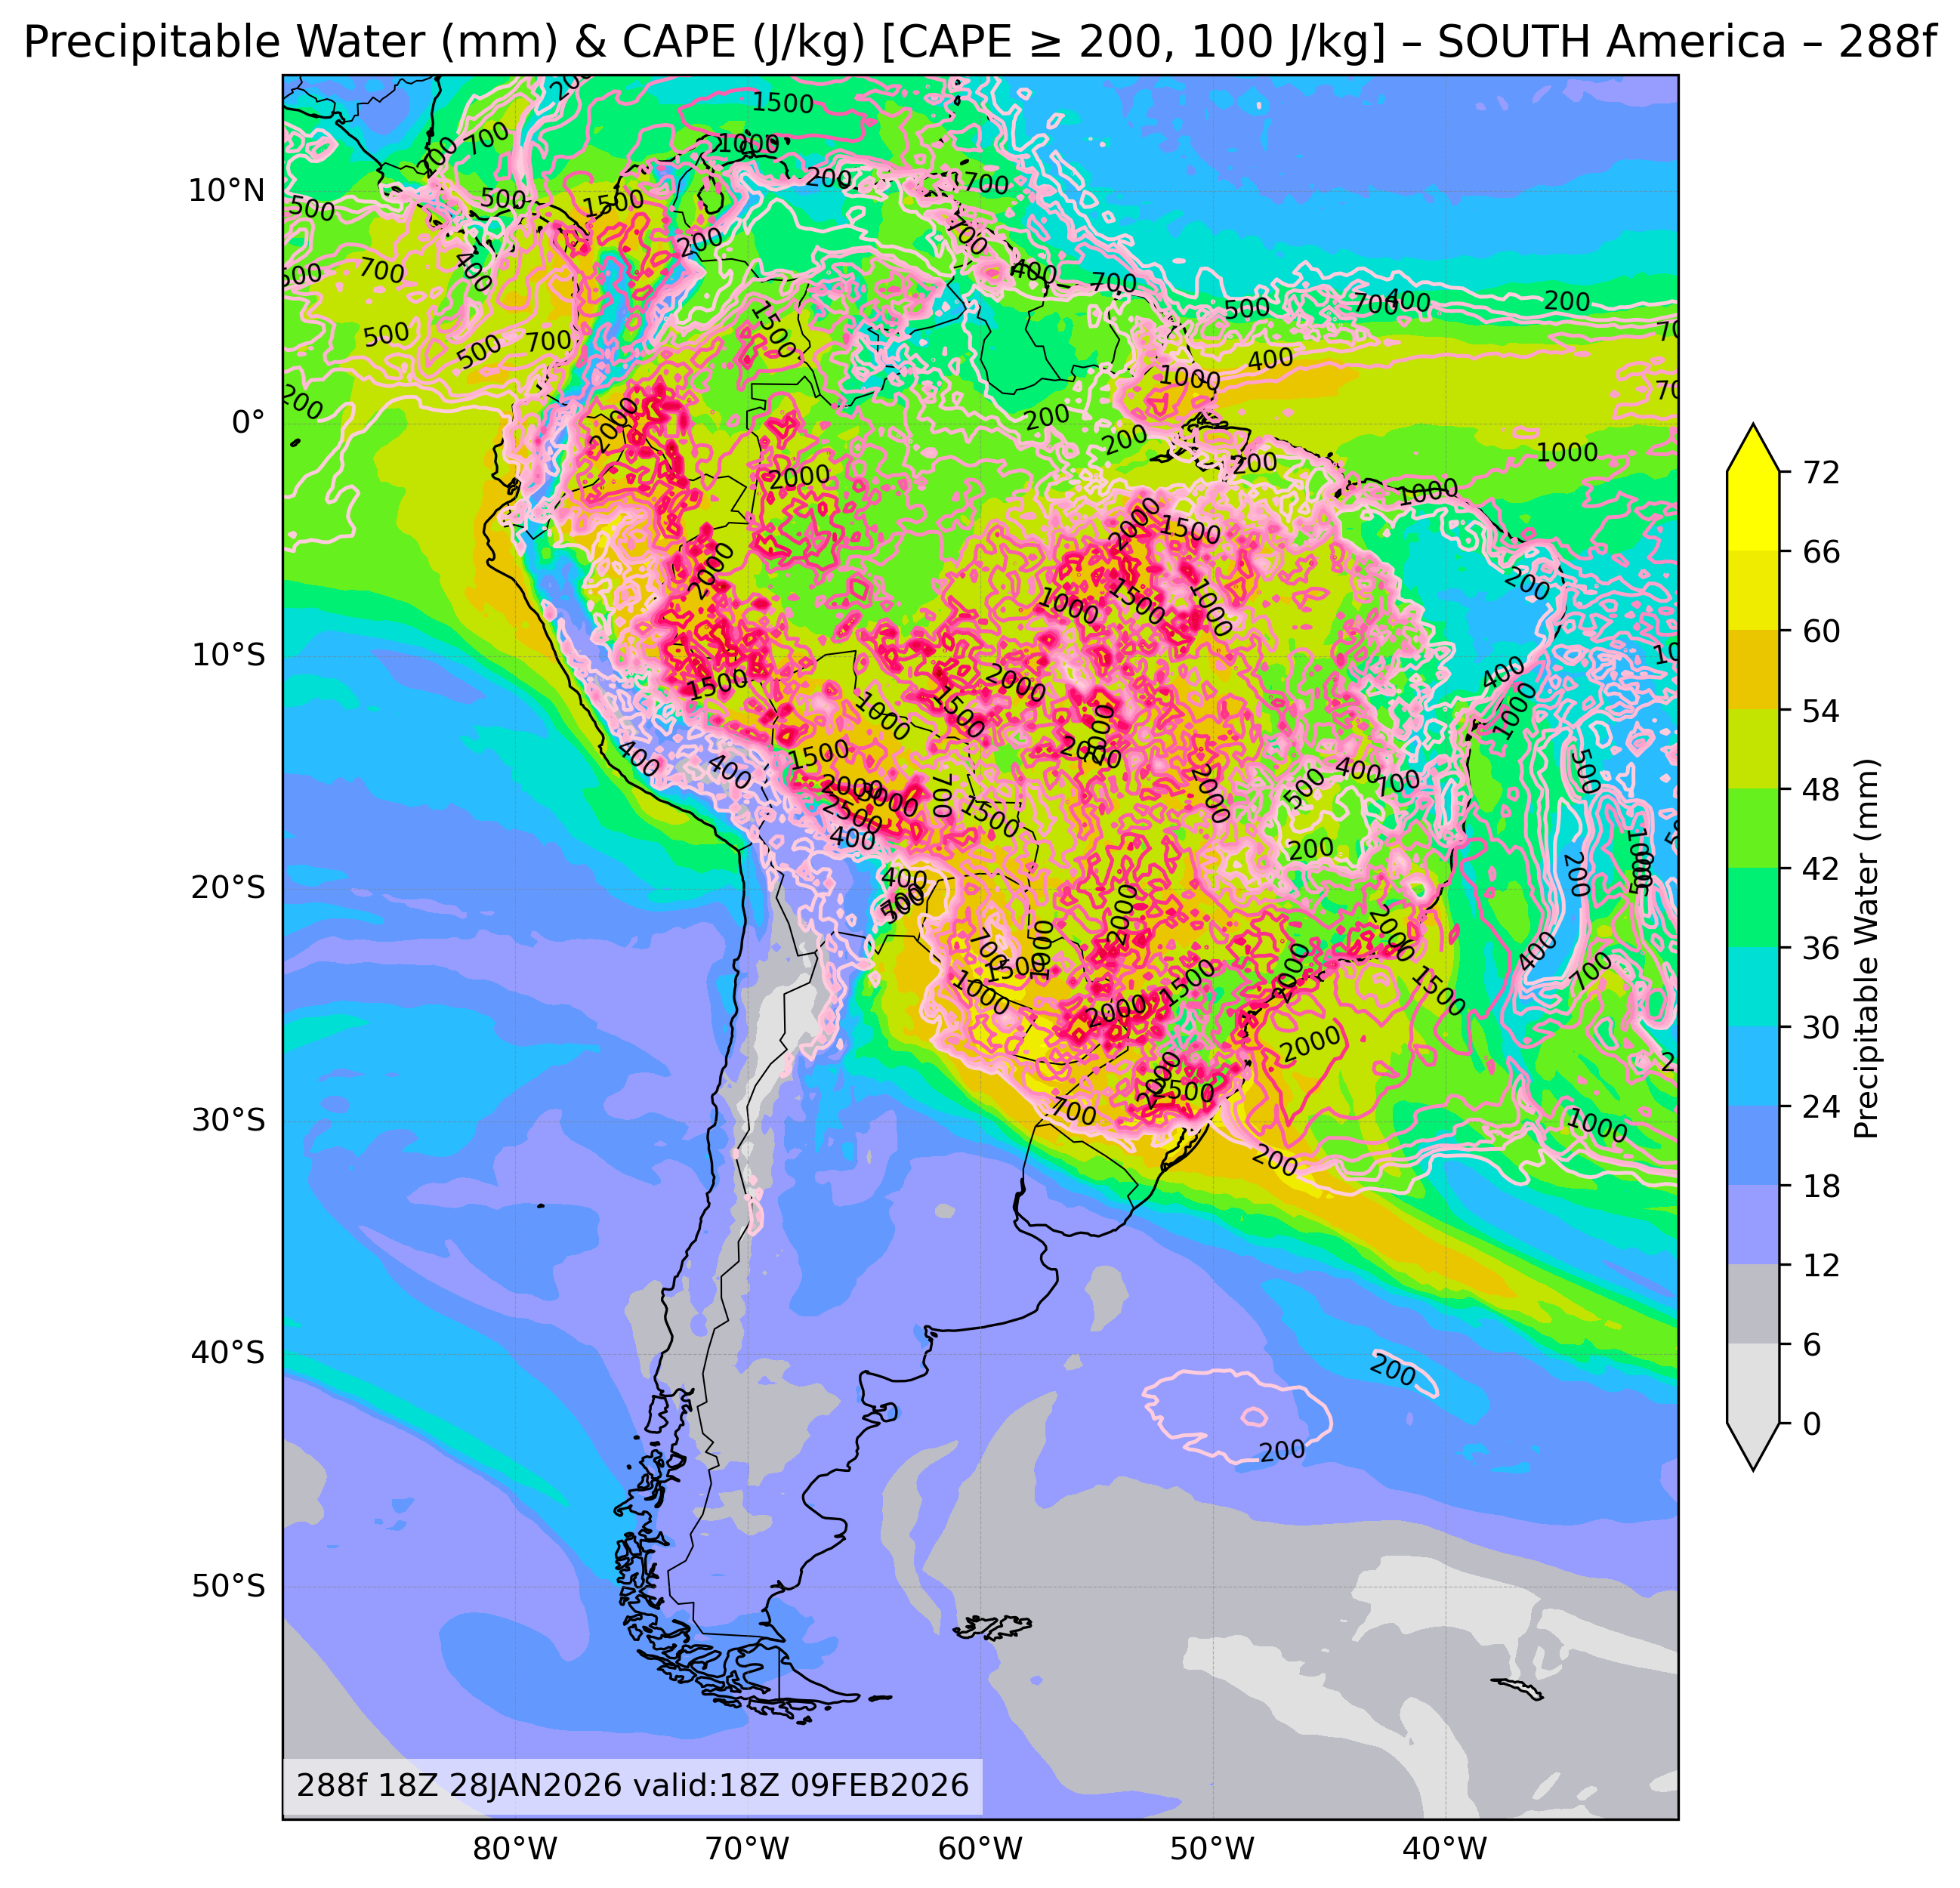
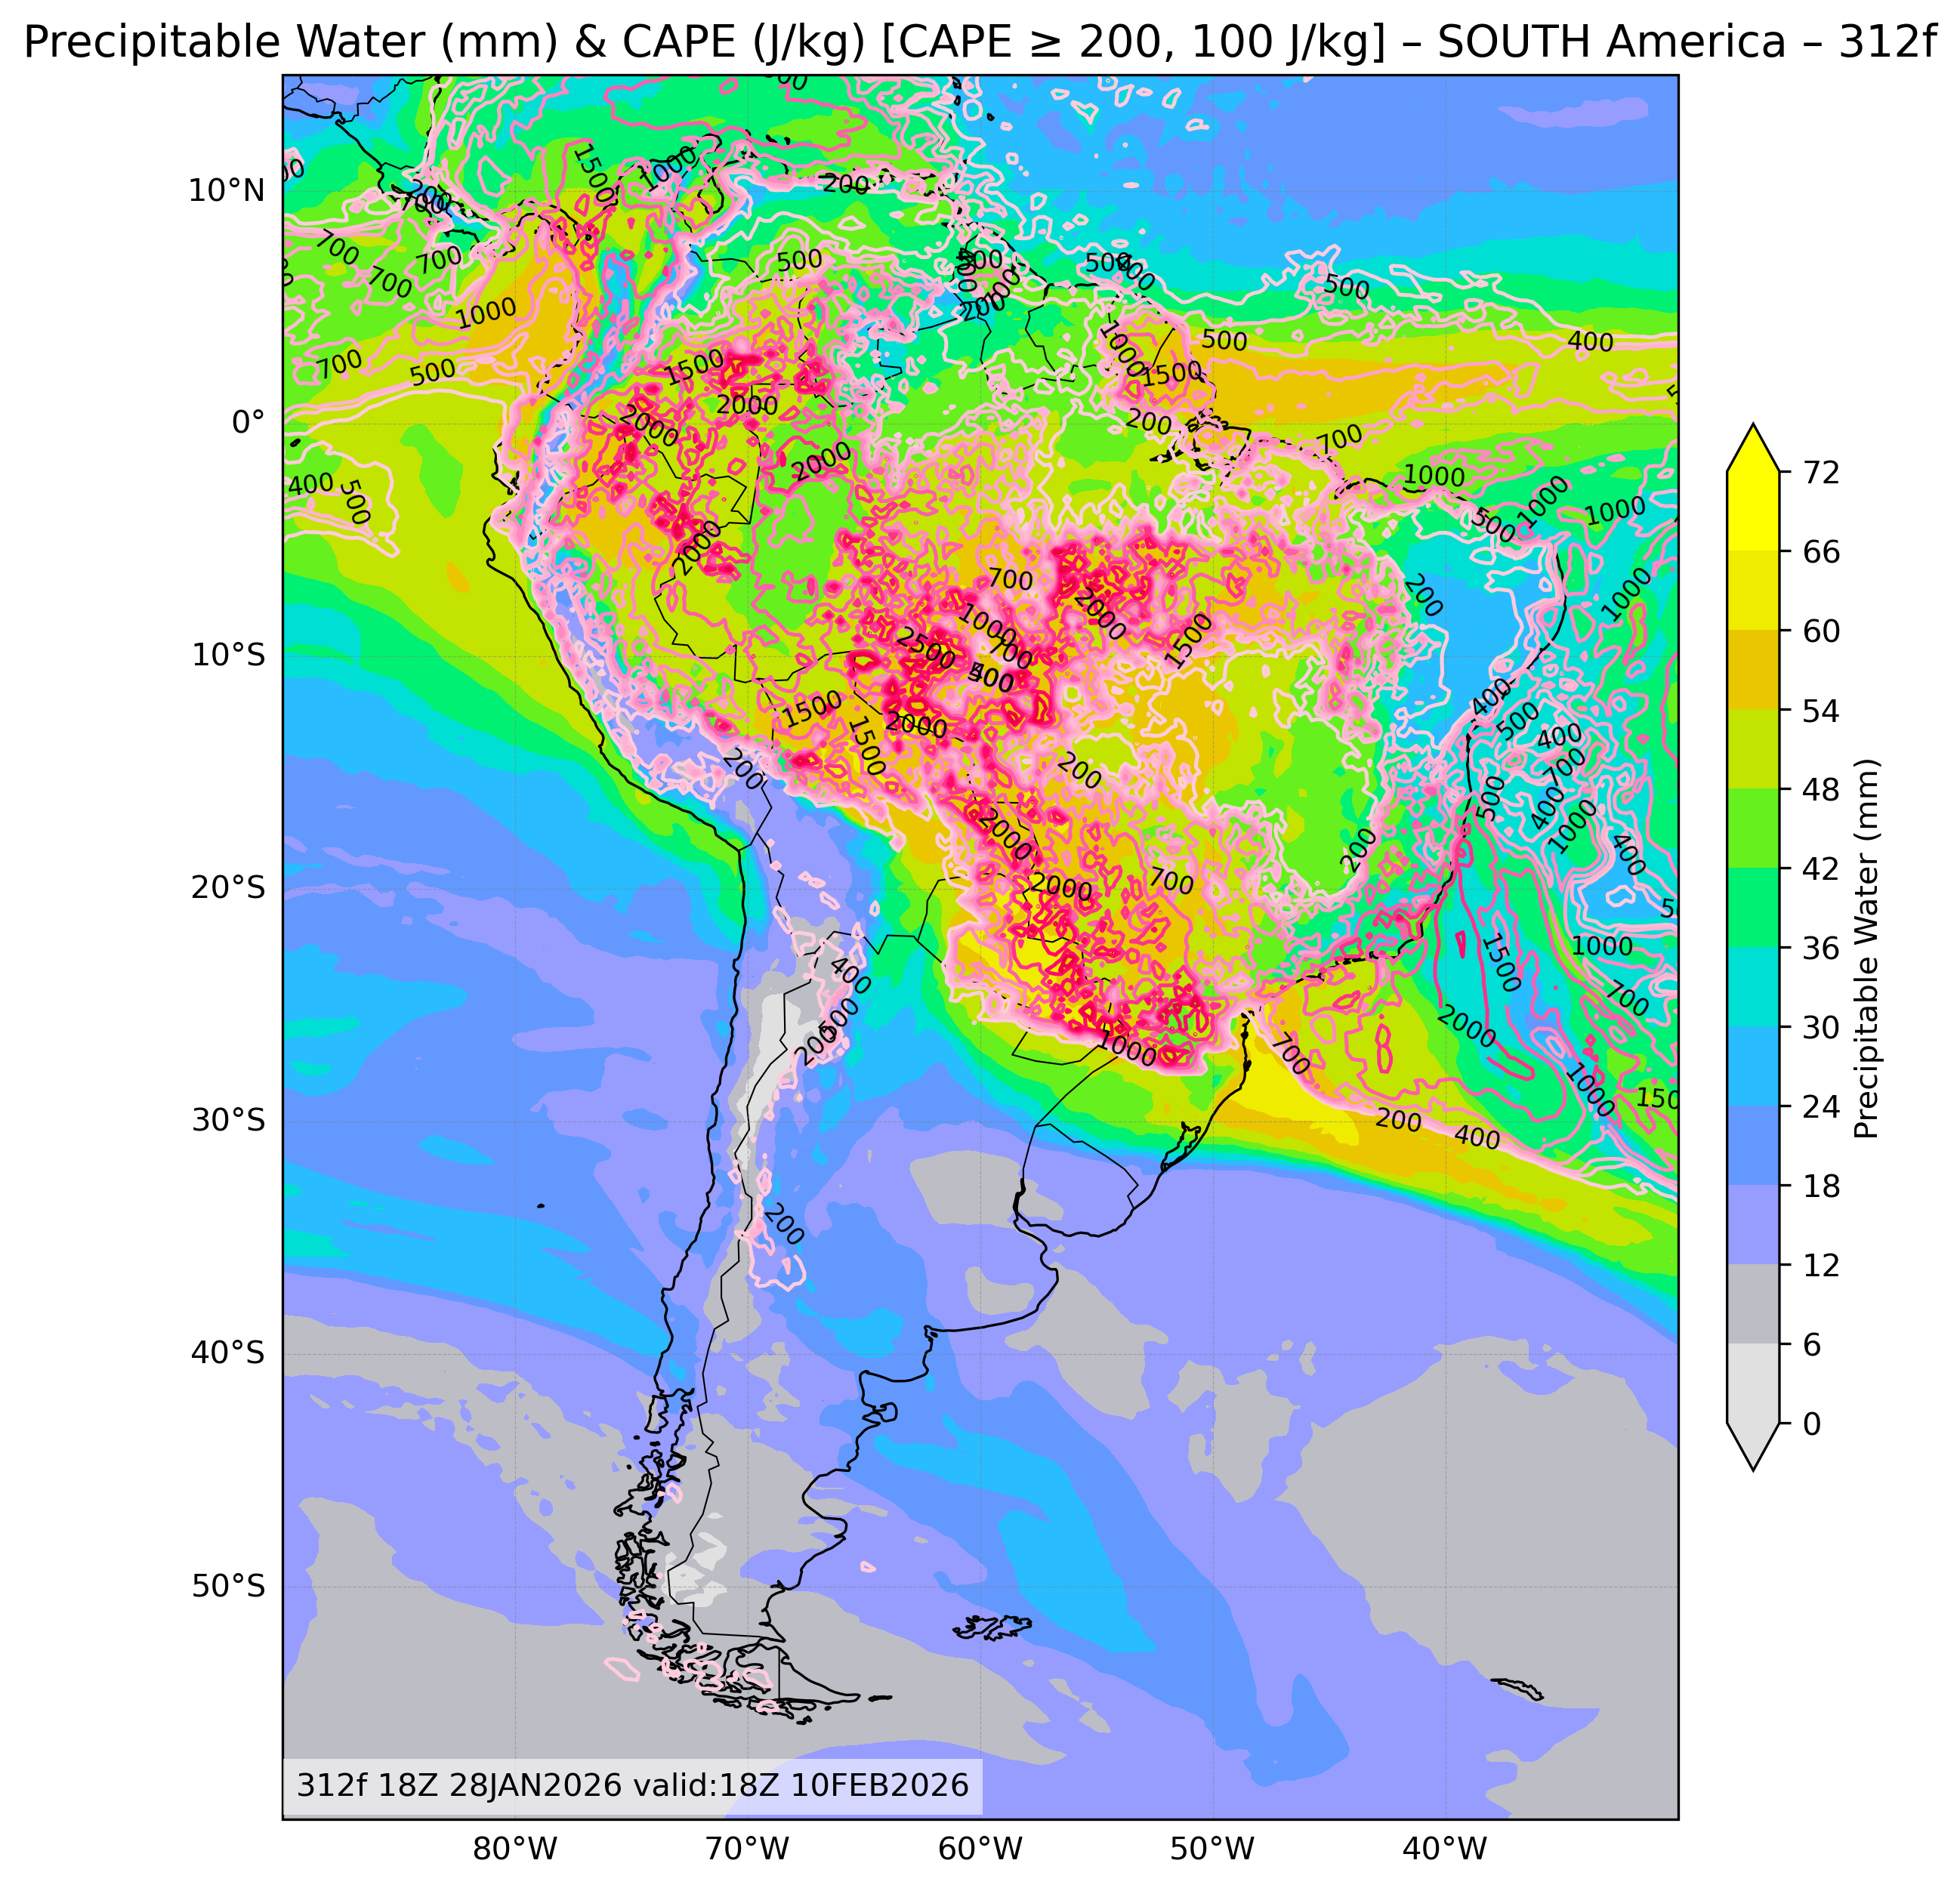
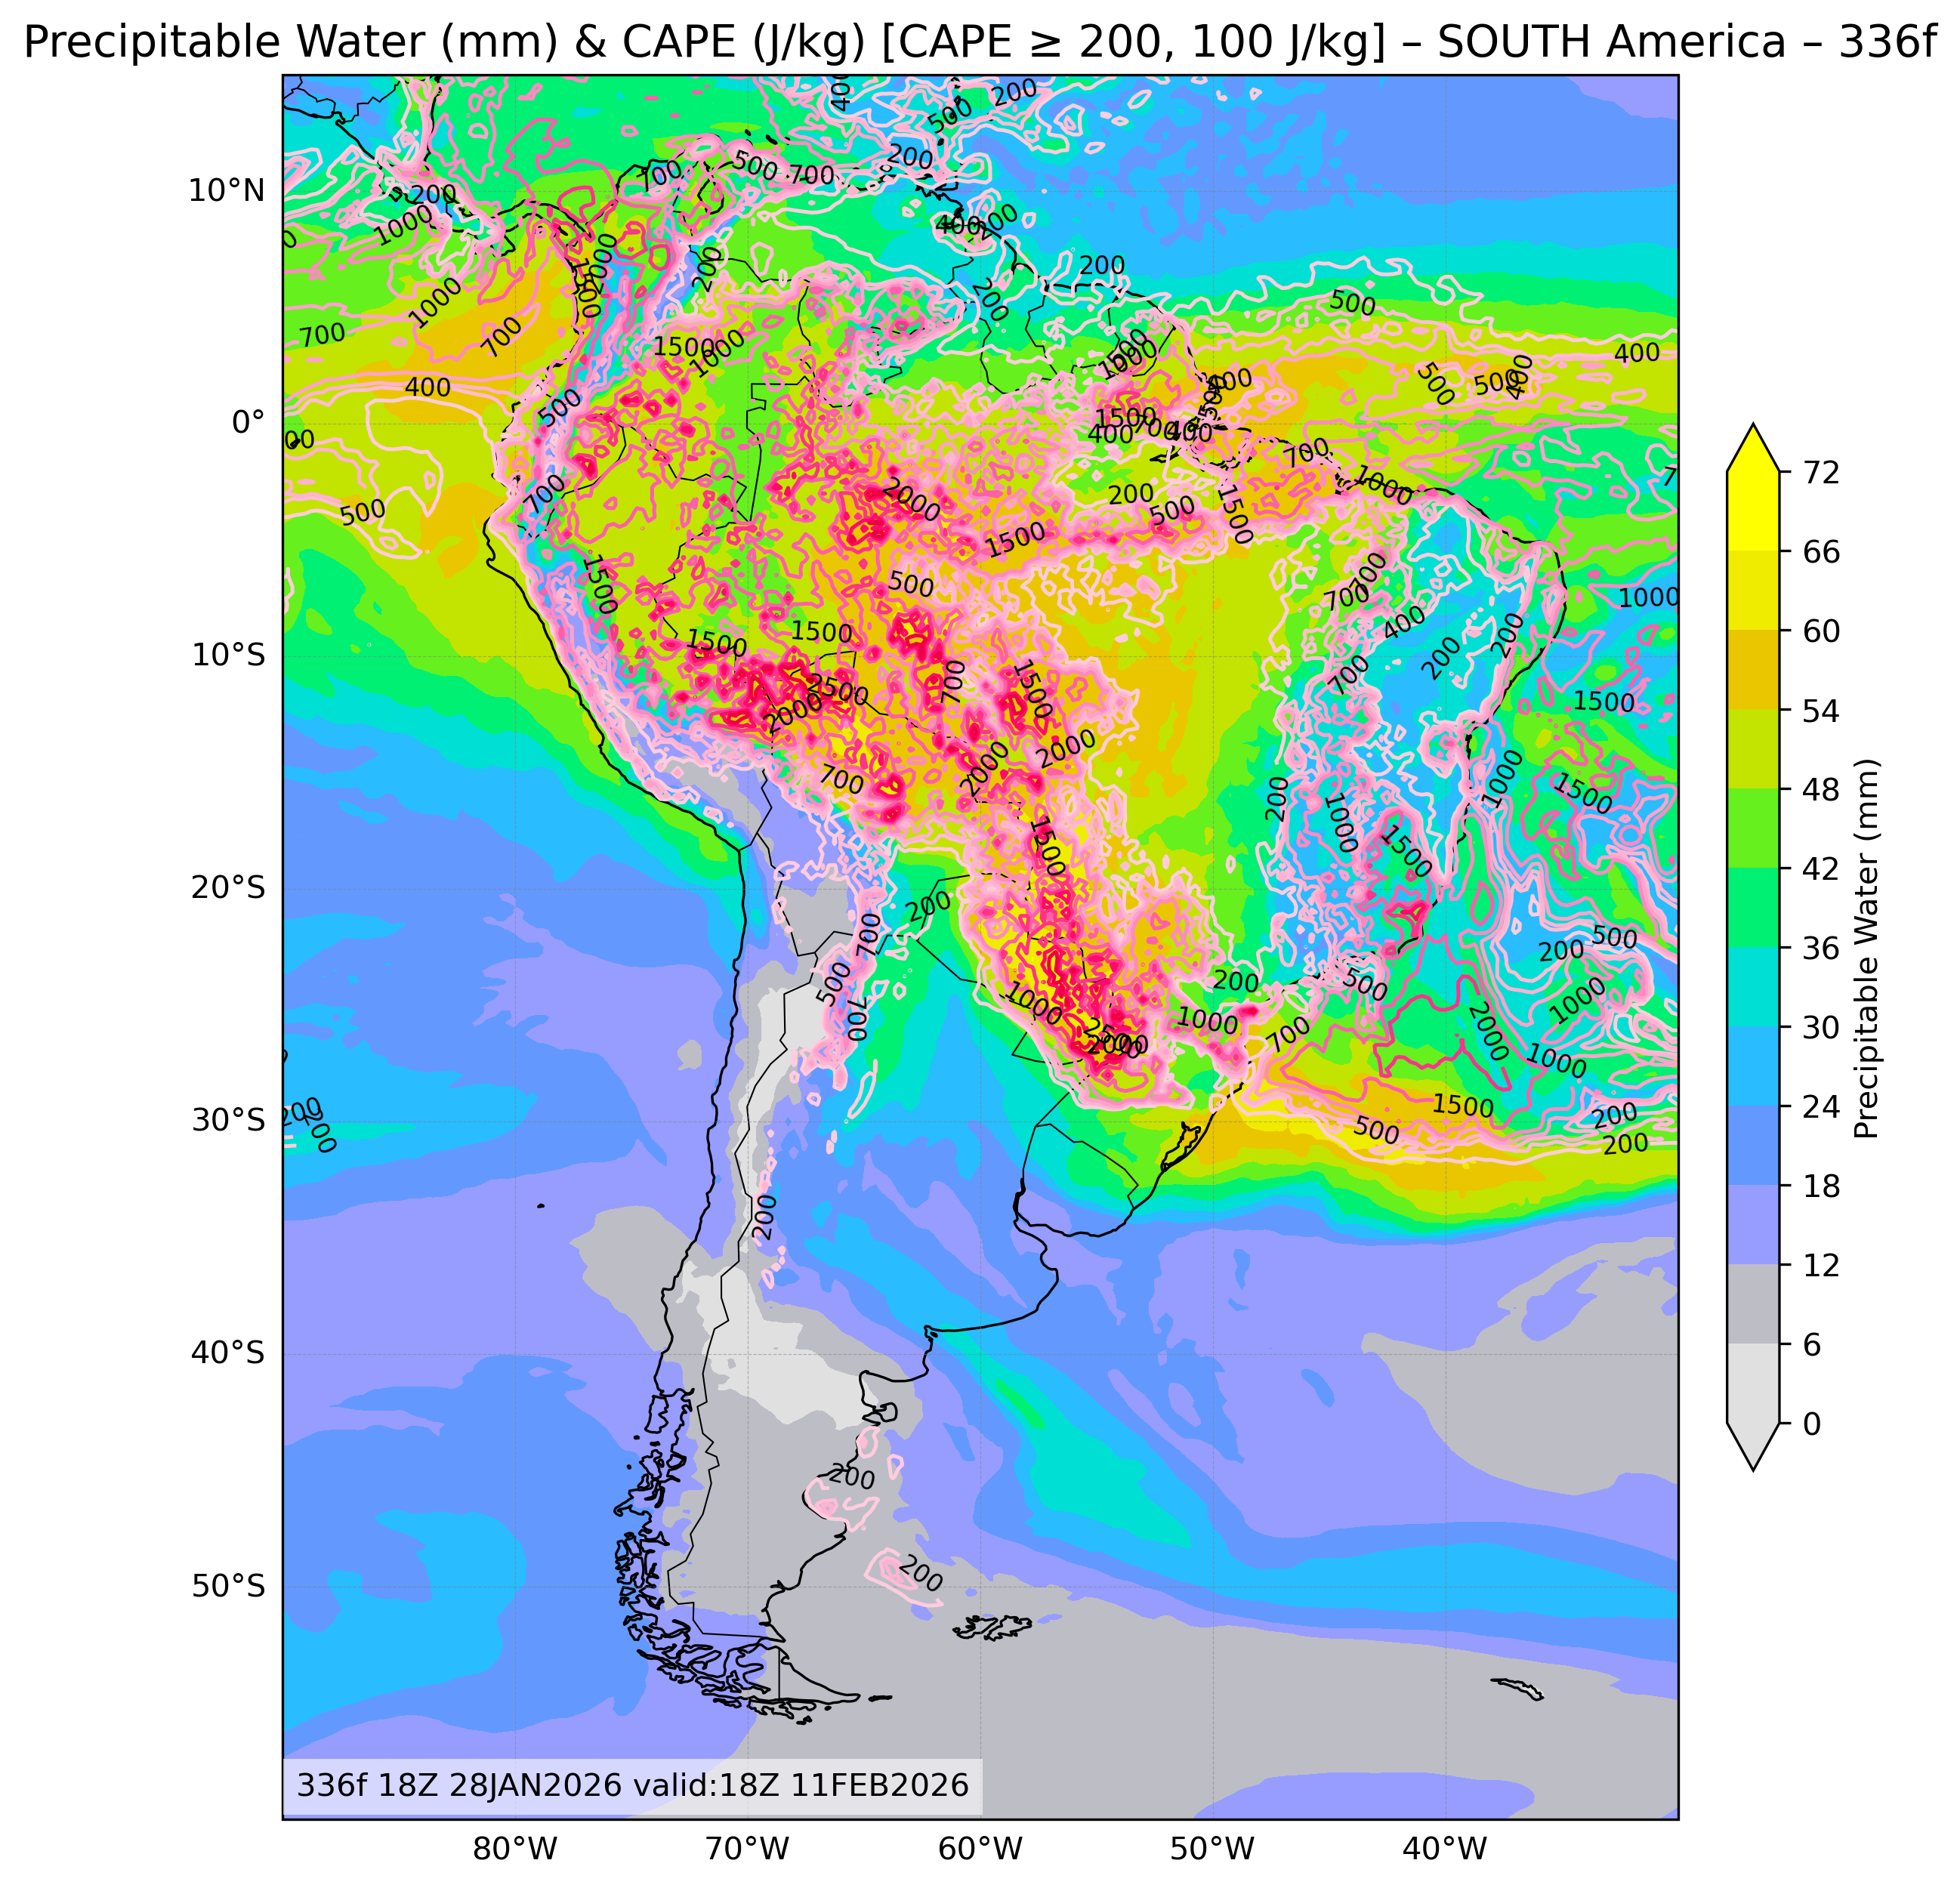
| Precipitable Water & Convective Available Potential Energy |
All Times |
🔍 | 🔍 | 🔍 | 🔍 | 🔍 |
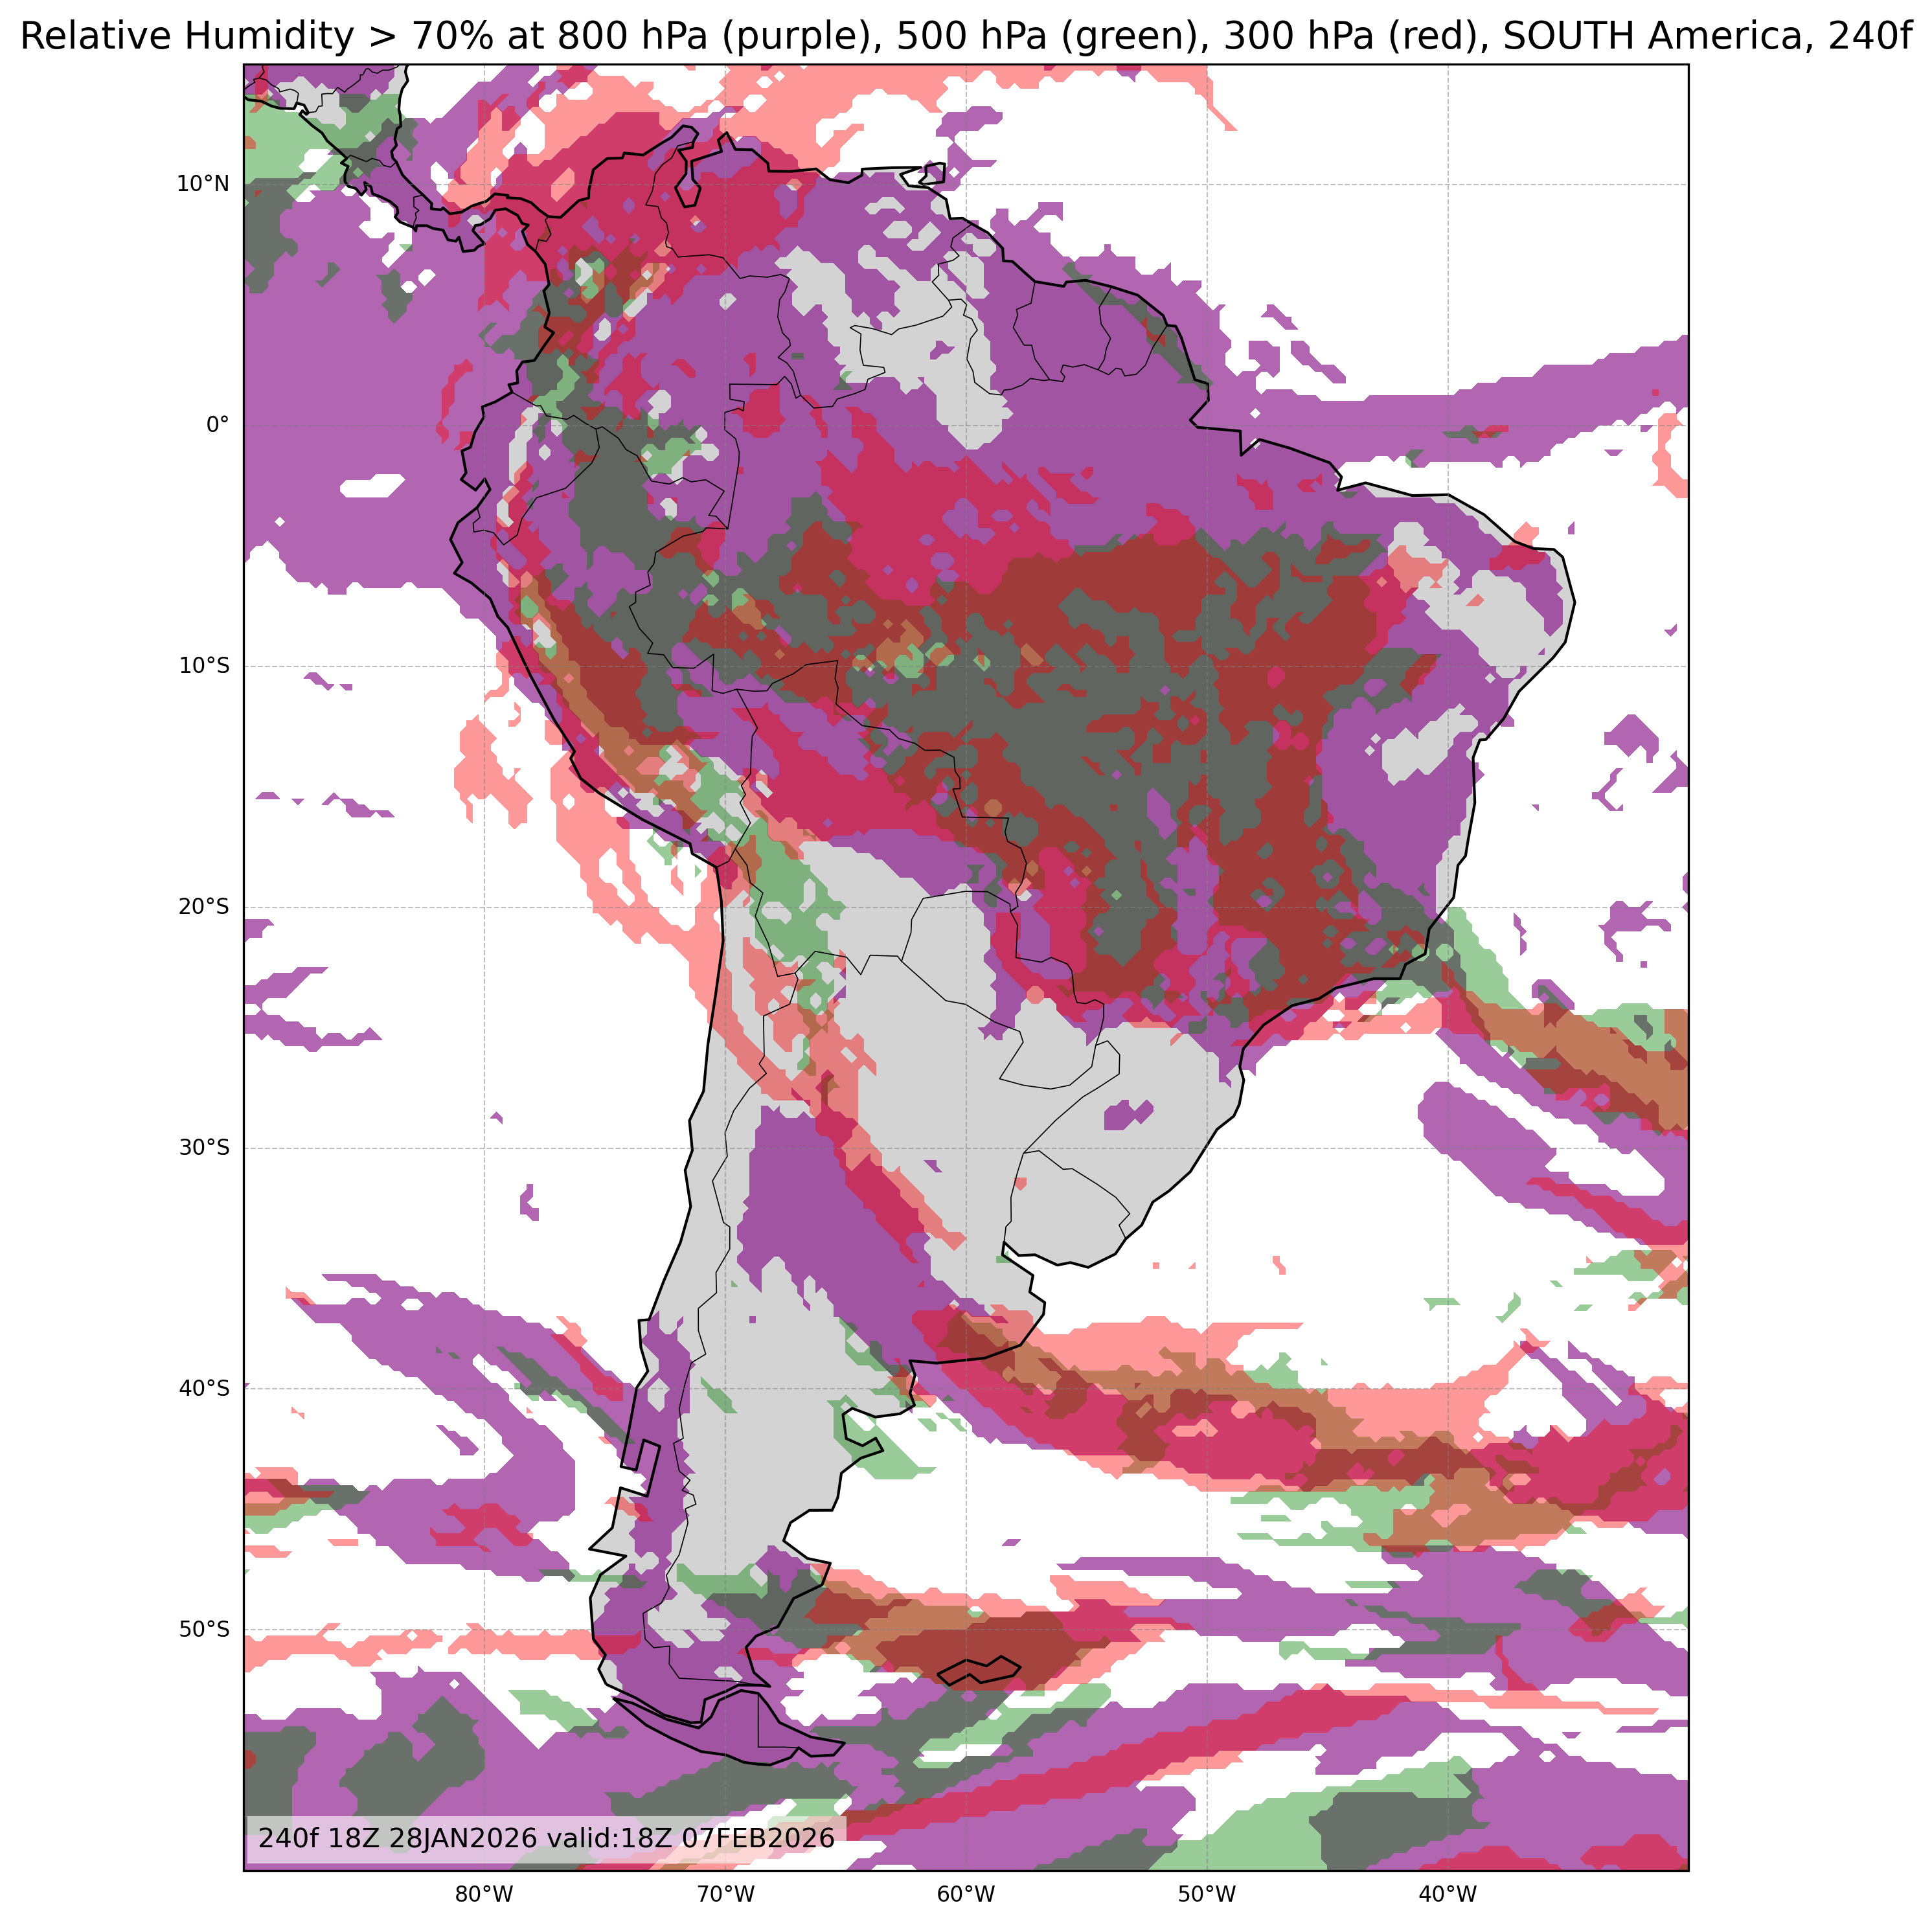
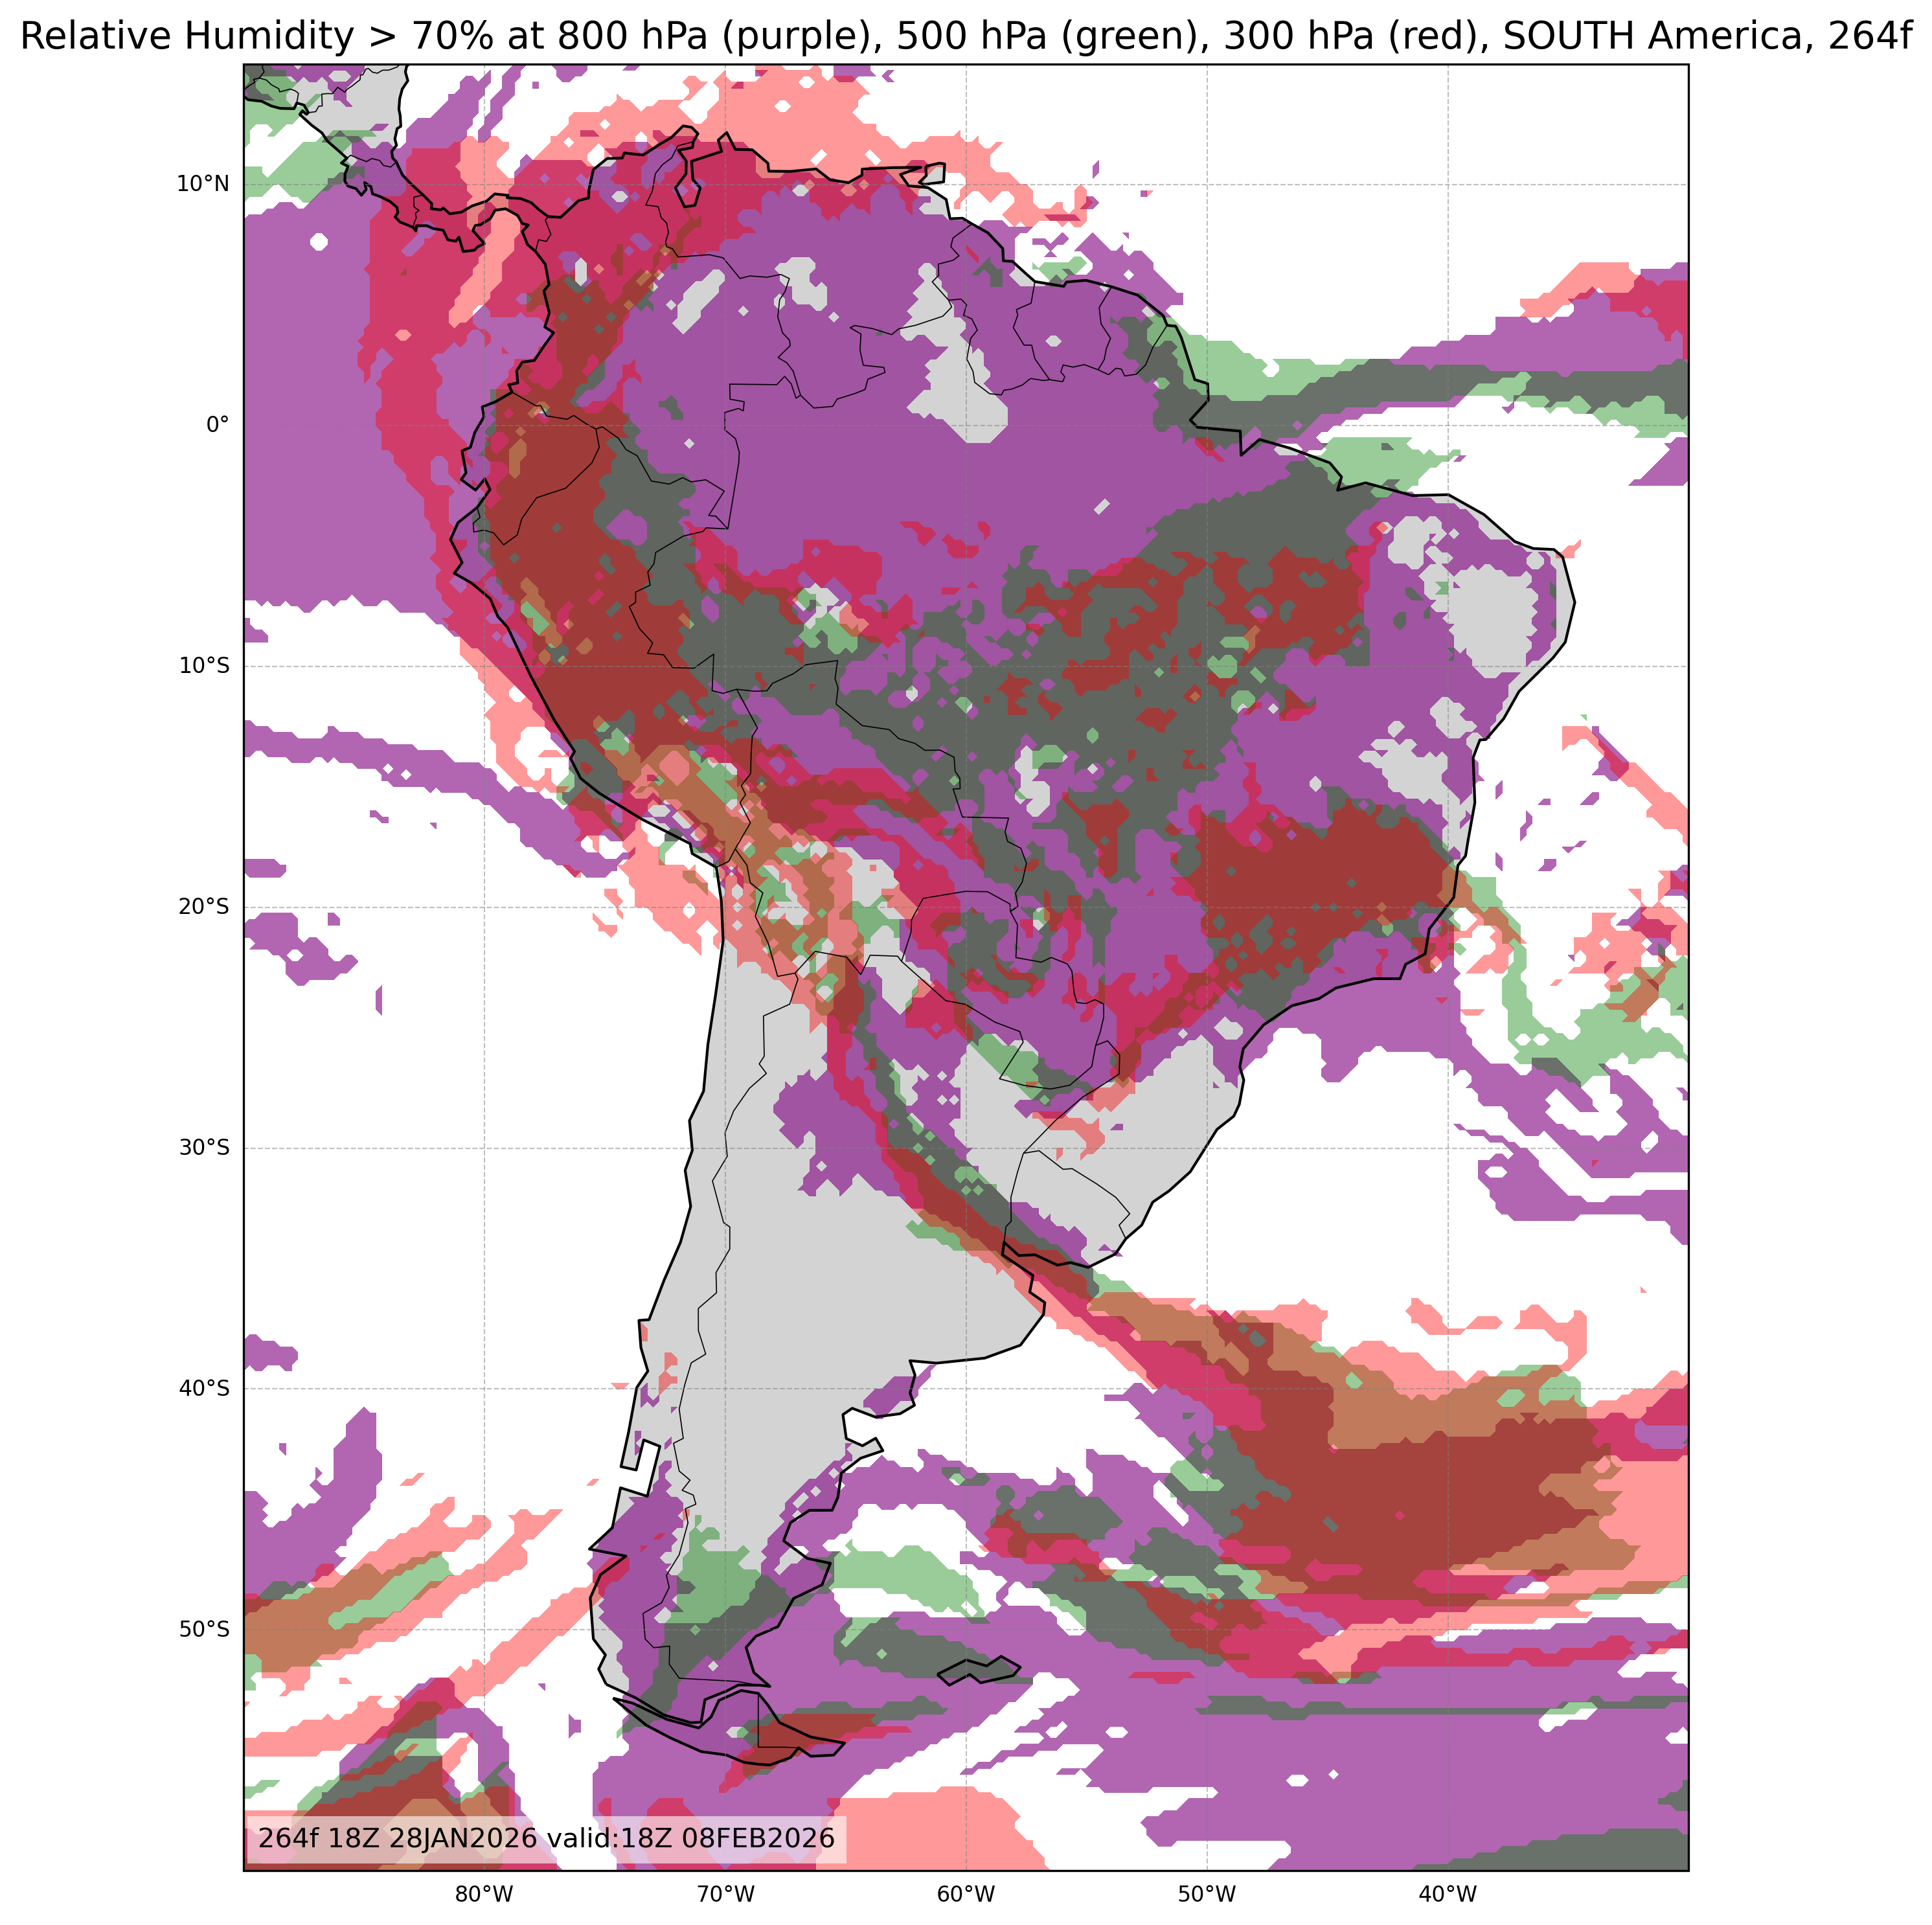
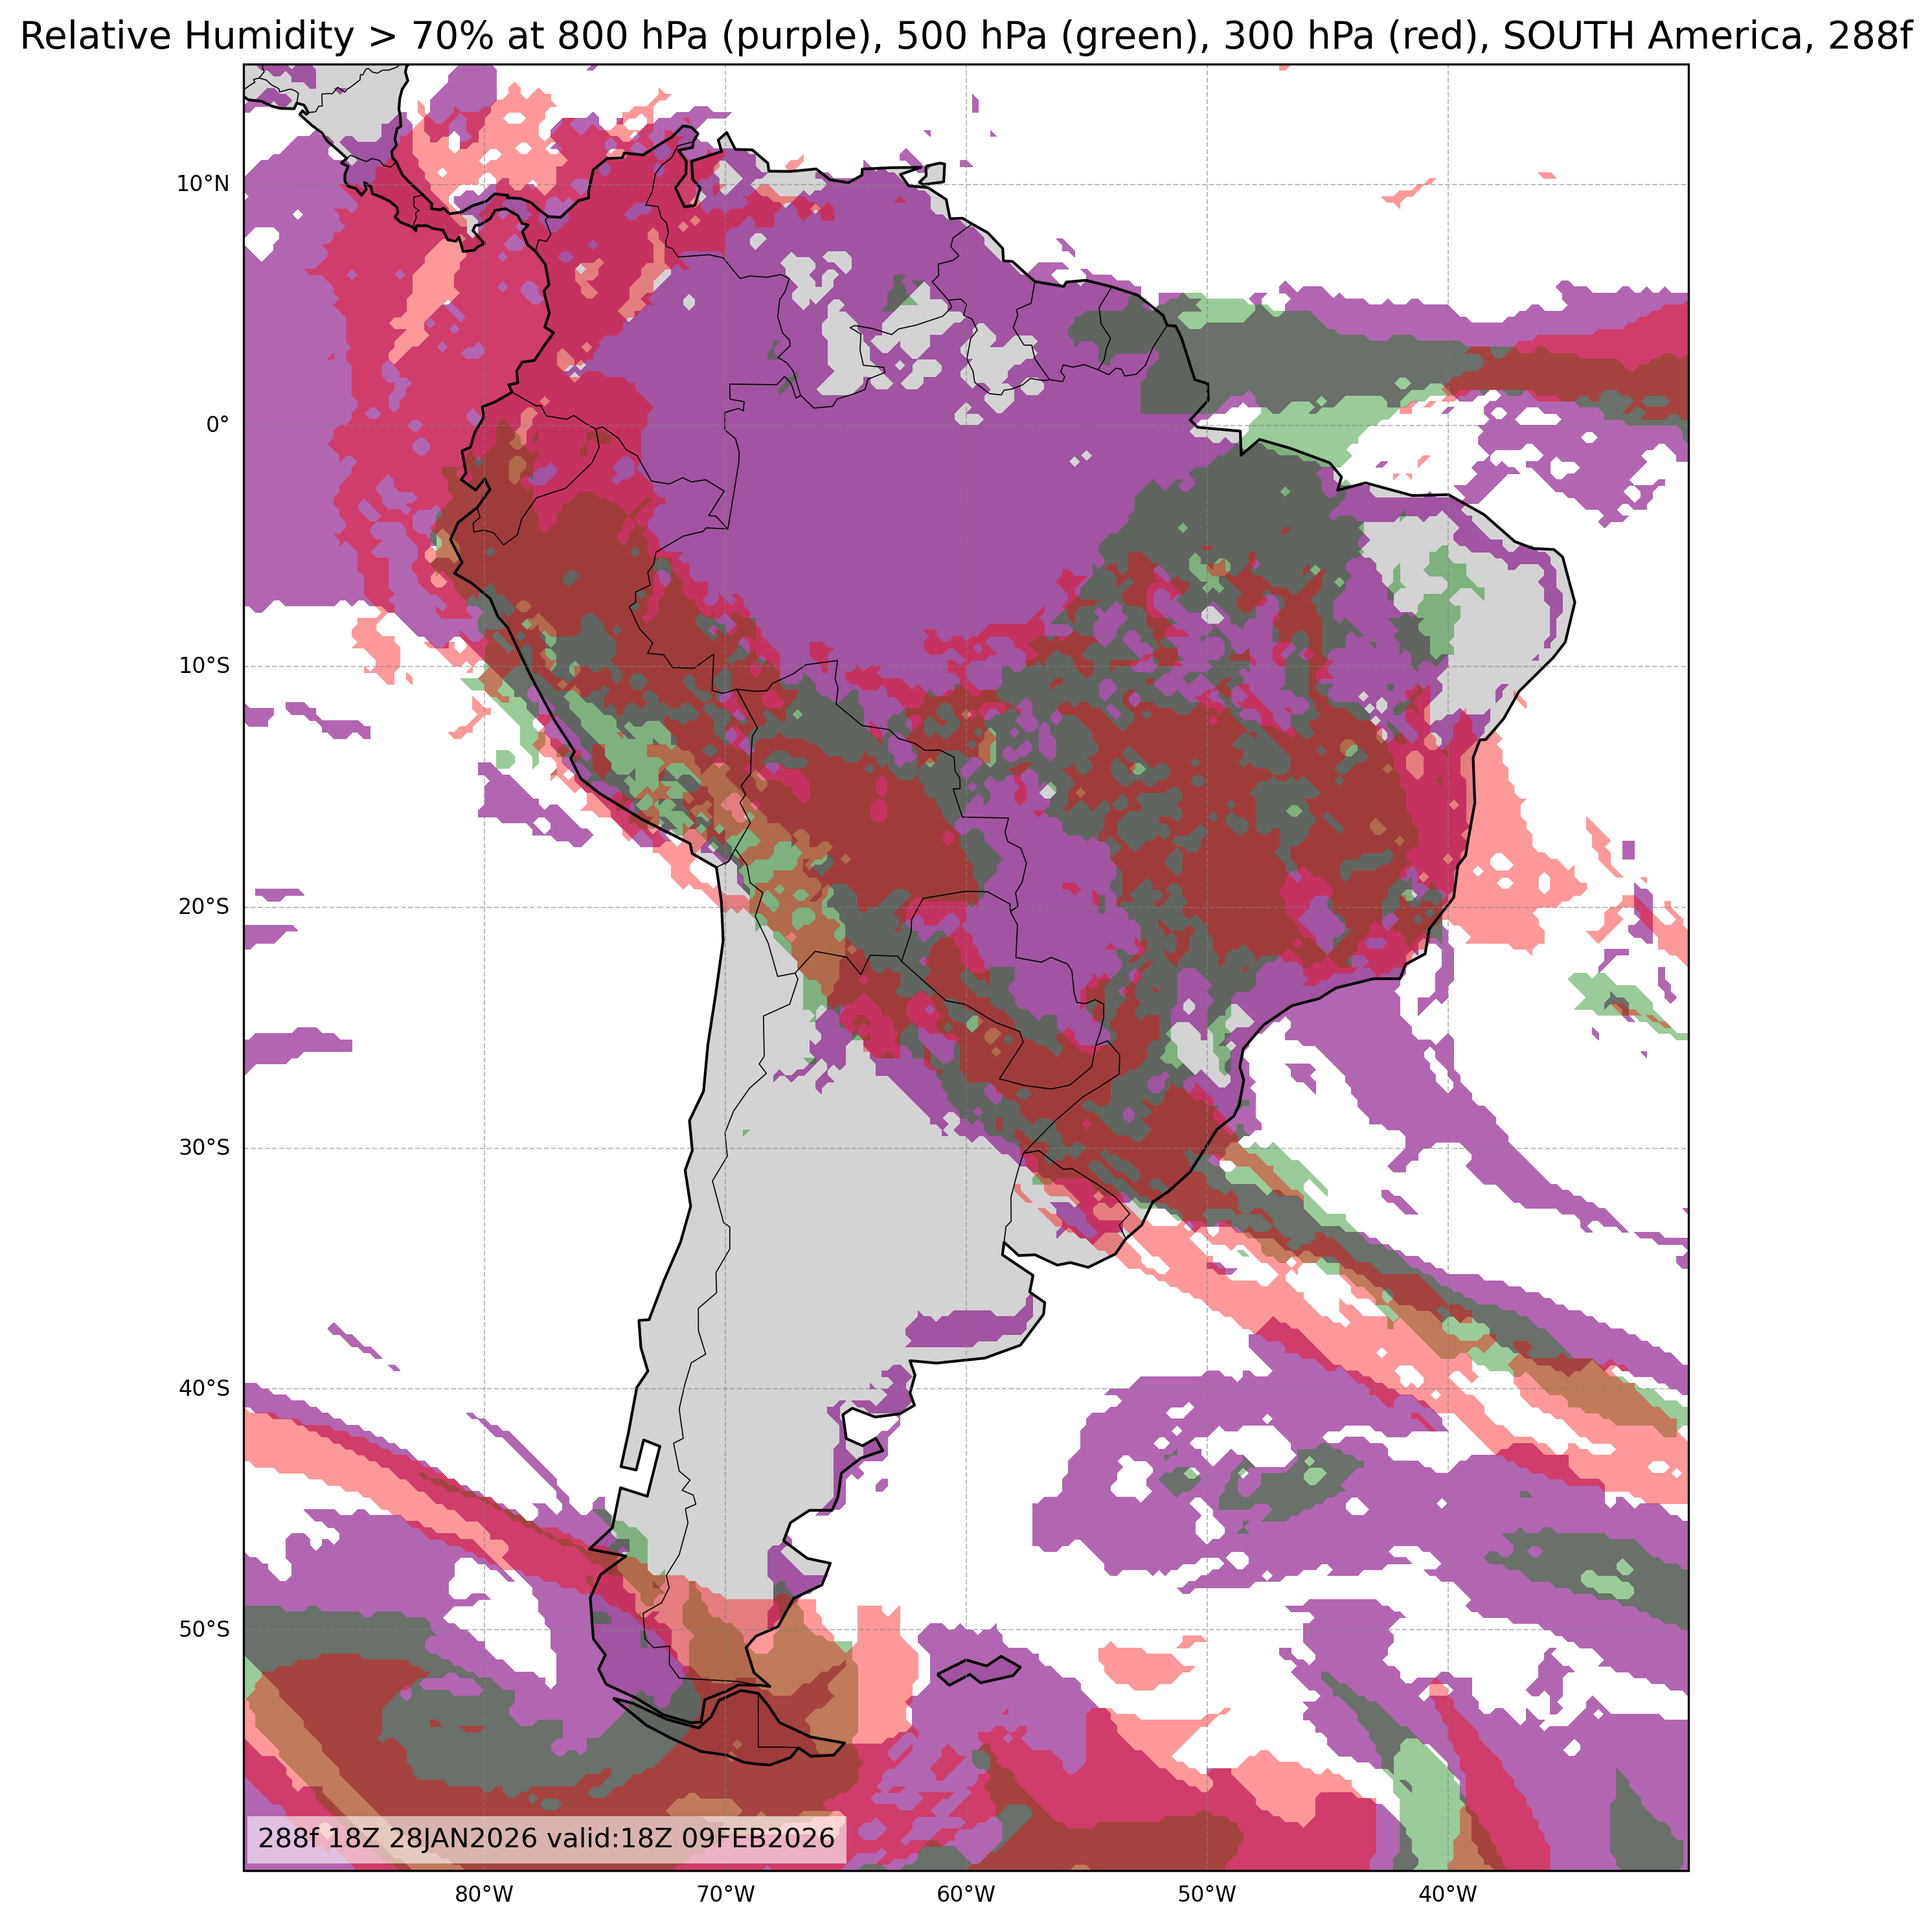
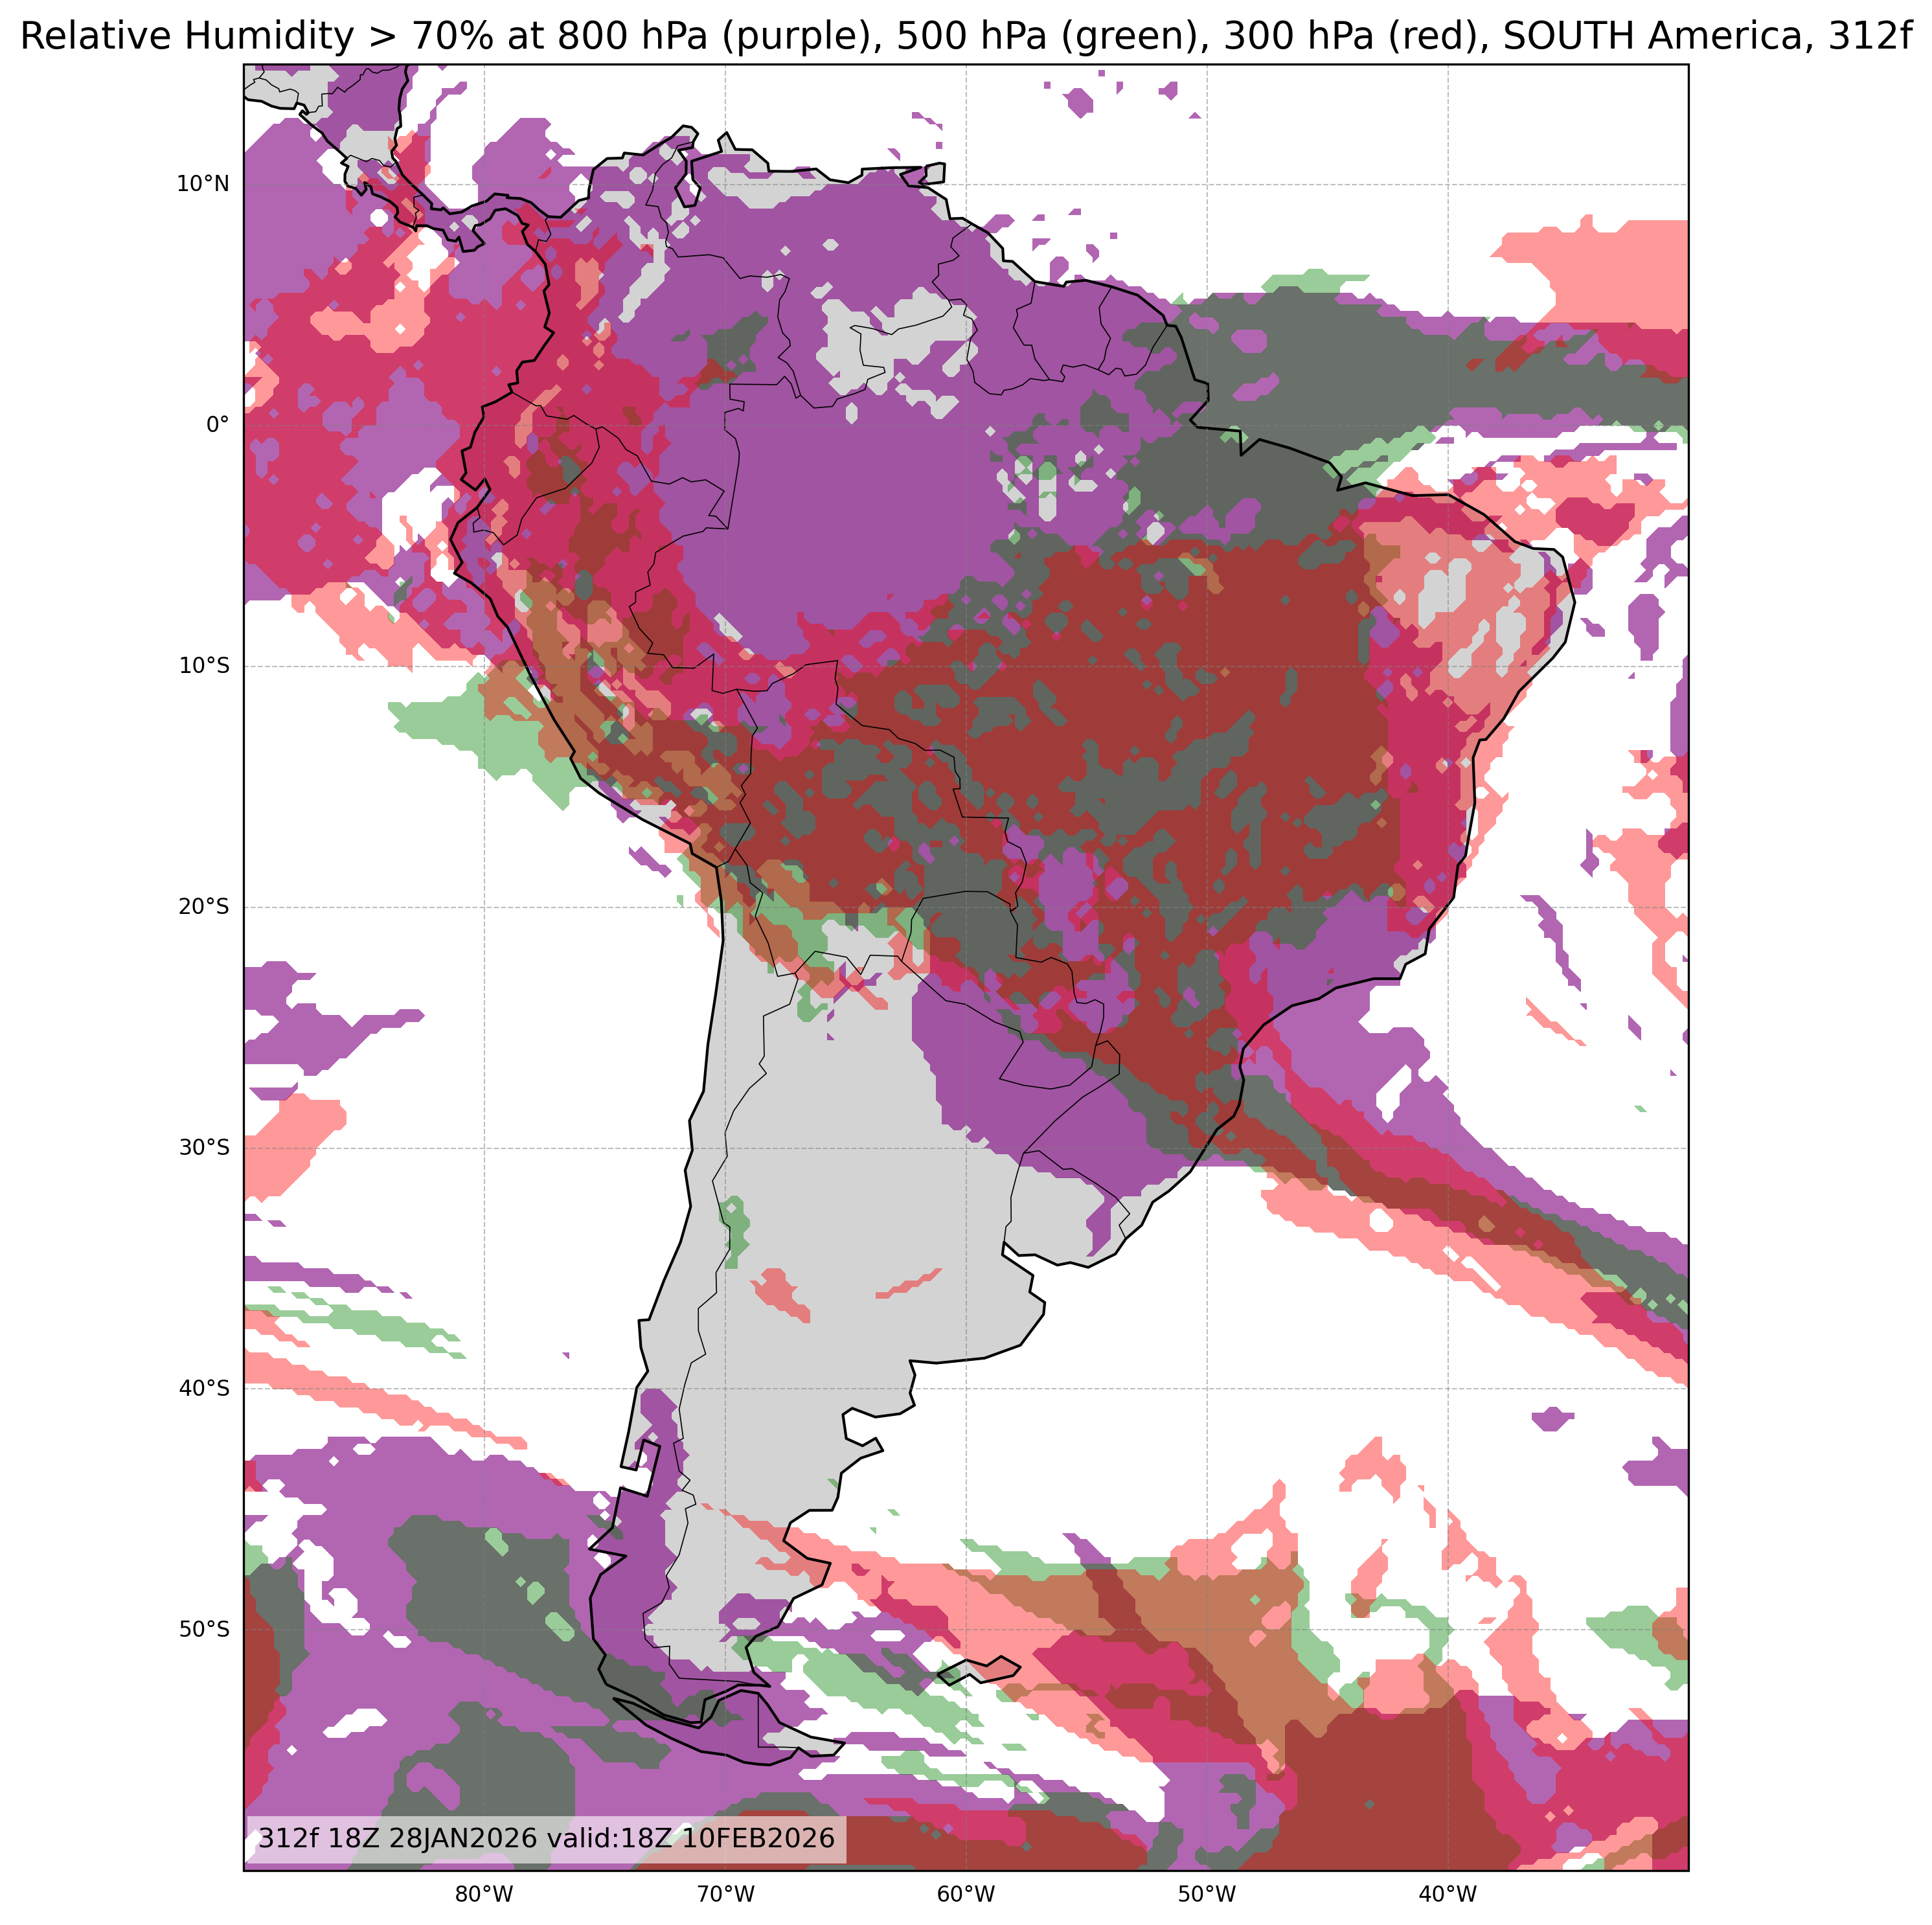
| Relative Humidity at 800, 500, & 300mb or Low, Middle, & High Cloud Cover |
All Times |
🔍 | 🔍 | 🔍 | 🔍 | 🔍 |
South America Forecast Animation Player
Hour: 00