Accurate weather forecasting requires looking beyond the immediate future. The Euro 700 mb Vertical Velocity 72 chart provides a critical 3-day outlook, allowing meteorologists to spot developing weather systems well before they arrive. By examining this map, you can understand the dynamics of the atmosphere 72 hours from now.
What Does the Euro 700 mb Vertical Velocity 72 Map Show?
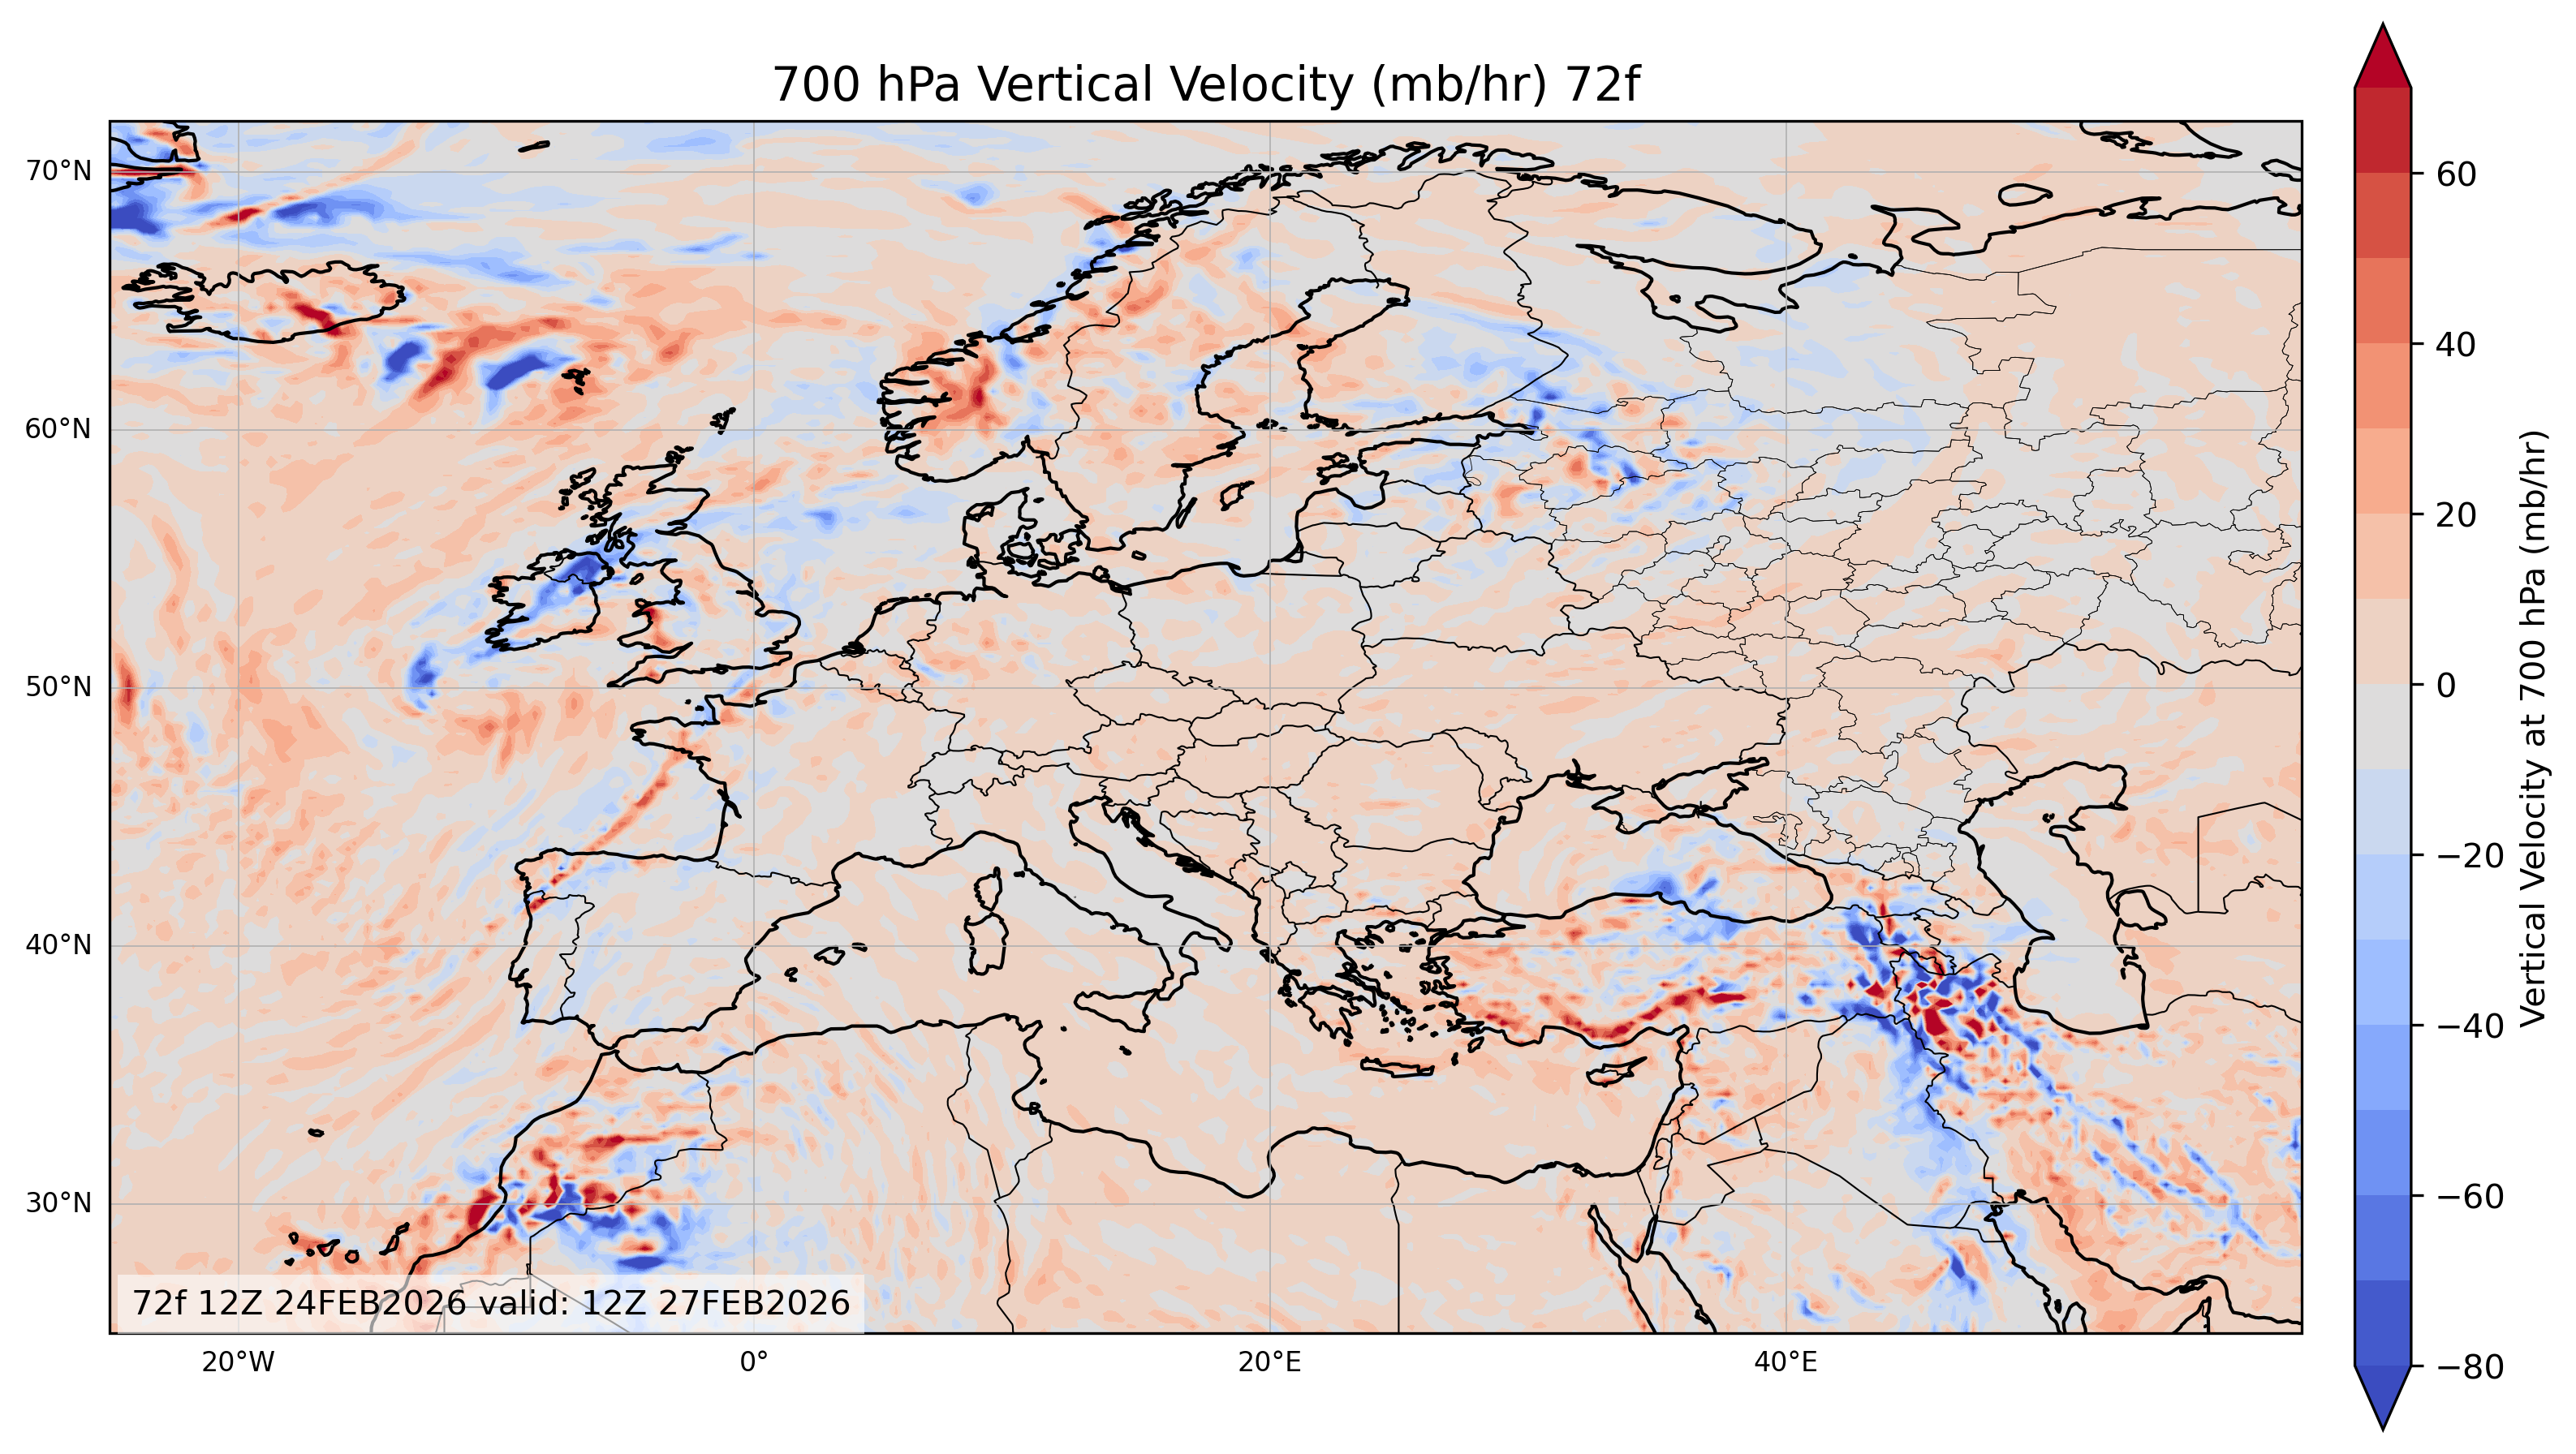
This specific chart displays the predicted vertical velocity at the 700 mb (or 700 hPa) level. Unlike shorter-term forecasts, the Euro 700 hPa Vertical Velocity 72 helps identify the movement of major troughs and ridges over a medium range.
It visualizes where air will be rising or sinking in three days. Consequently, it is an essential tool for predicting weekend weather or planning activities that require a 72-hour lead time.
Interpreting the Forecast: Colors and Vorticity
To use the Vertical Velocity chart effectively, you must understand how the colors correlate with vertical velocity and vorticity.
1. Blue Areas (Negative Values)
The blue zones represent negative vertical velocity.
- The Physics: Negative values indicate that the air is rising (uplift).
- Vorticity Connection: These blue areas are typically driven by Positive Vorticity Advection. As positive vorticity creates lift in the atmosphere, it generates the blue signatures on the map.
- Forecast: If you see deep blue on the Euro 700 hPa Vertical Velocity map, expect cloudiness, precipitation, or storm systems in that region in 72 hours.
2. Red Areas (Positive Values)
The red and orange zones represent positive vertical velocity.
- The Physics: Positive values indicate that the air is sinking (subsidence).
- Weather Outlook: Sinking air warms up and suppresses cloud formation.
- Forecast: These areas indicate stability. Therefore, if the chart shows red over a region, you can predict clear skies and high pressure three days from now.
Conclusion: Euro 700 mb Vertical Velocity 72
In summary, the Euro 700 hPA Vertical Velocity 72 chart is a reliable guide for medium-range forecasting. By monitoring the blue uplift zones (linked to positive vorticity) and red subsidence zones, you can confidently predict the weather 72 hours in advance.