Forecasting weather two days in advance requires precise tools. The Euro 500 hPa Geopotential Height and Relative Vorticity 48 chart is the go-to resource for meteorologists looking at the medium-range outlook. By visualizing the atmosphere 48 hours from now, this map reveals where storm systems will move and how they will evolve.
This guide explains how to interpret this geopotential height map, the concept of relative vorticity, and how to use this 48-hour forecast effectively.
Understanding Geopotential Height Meteorology
To make sense of the Geopotential Height and Relative Vorticity 48 map, we first need to understand the underlying physics.
In geopotential height meteorology, we don’t measure pressure at a fixed height (like meters). Instead, we measure the height of a specific pressure surface. This geopotential height map shows the altitude of the 500 hPa level, which is roughly 5.5 km above sea level.
- Troughs (Low Heights): Indicated by dips in the contour lines, associated with cold air.
- Ridges (High Heights): Indicated by peaks in the contour lines, associated with warm air. Similar to GFS geopotential height models, this chart helps steer surface weather systems.
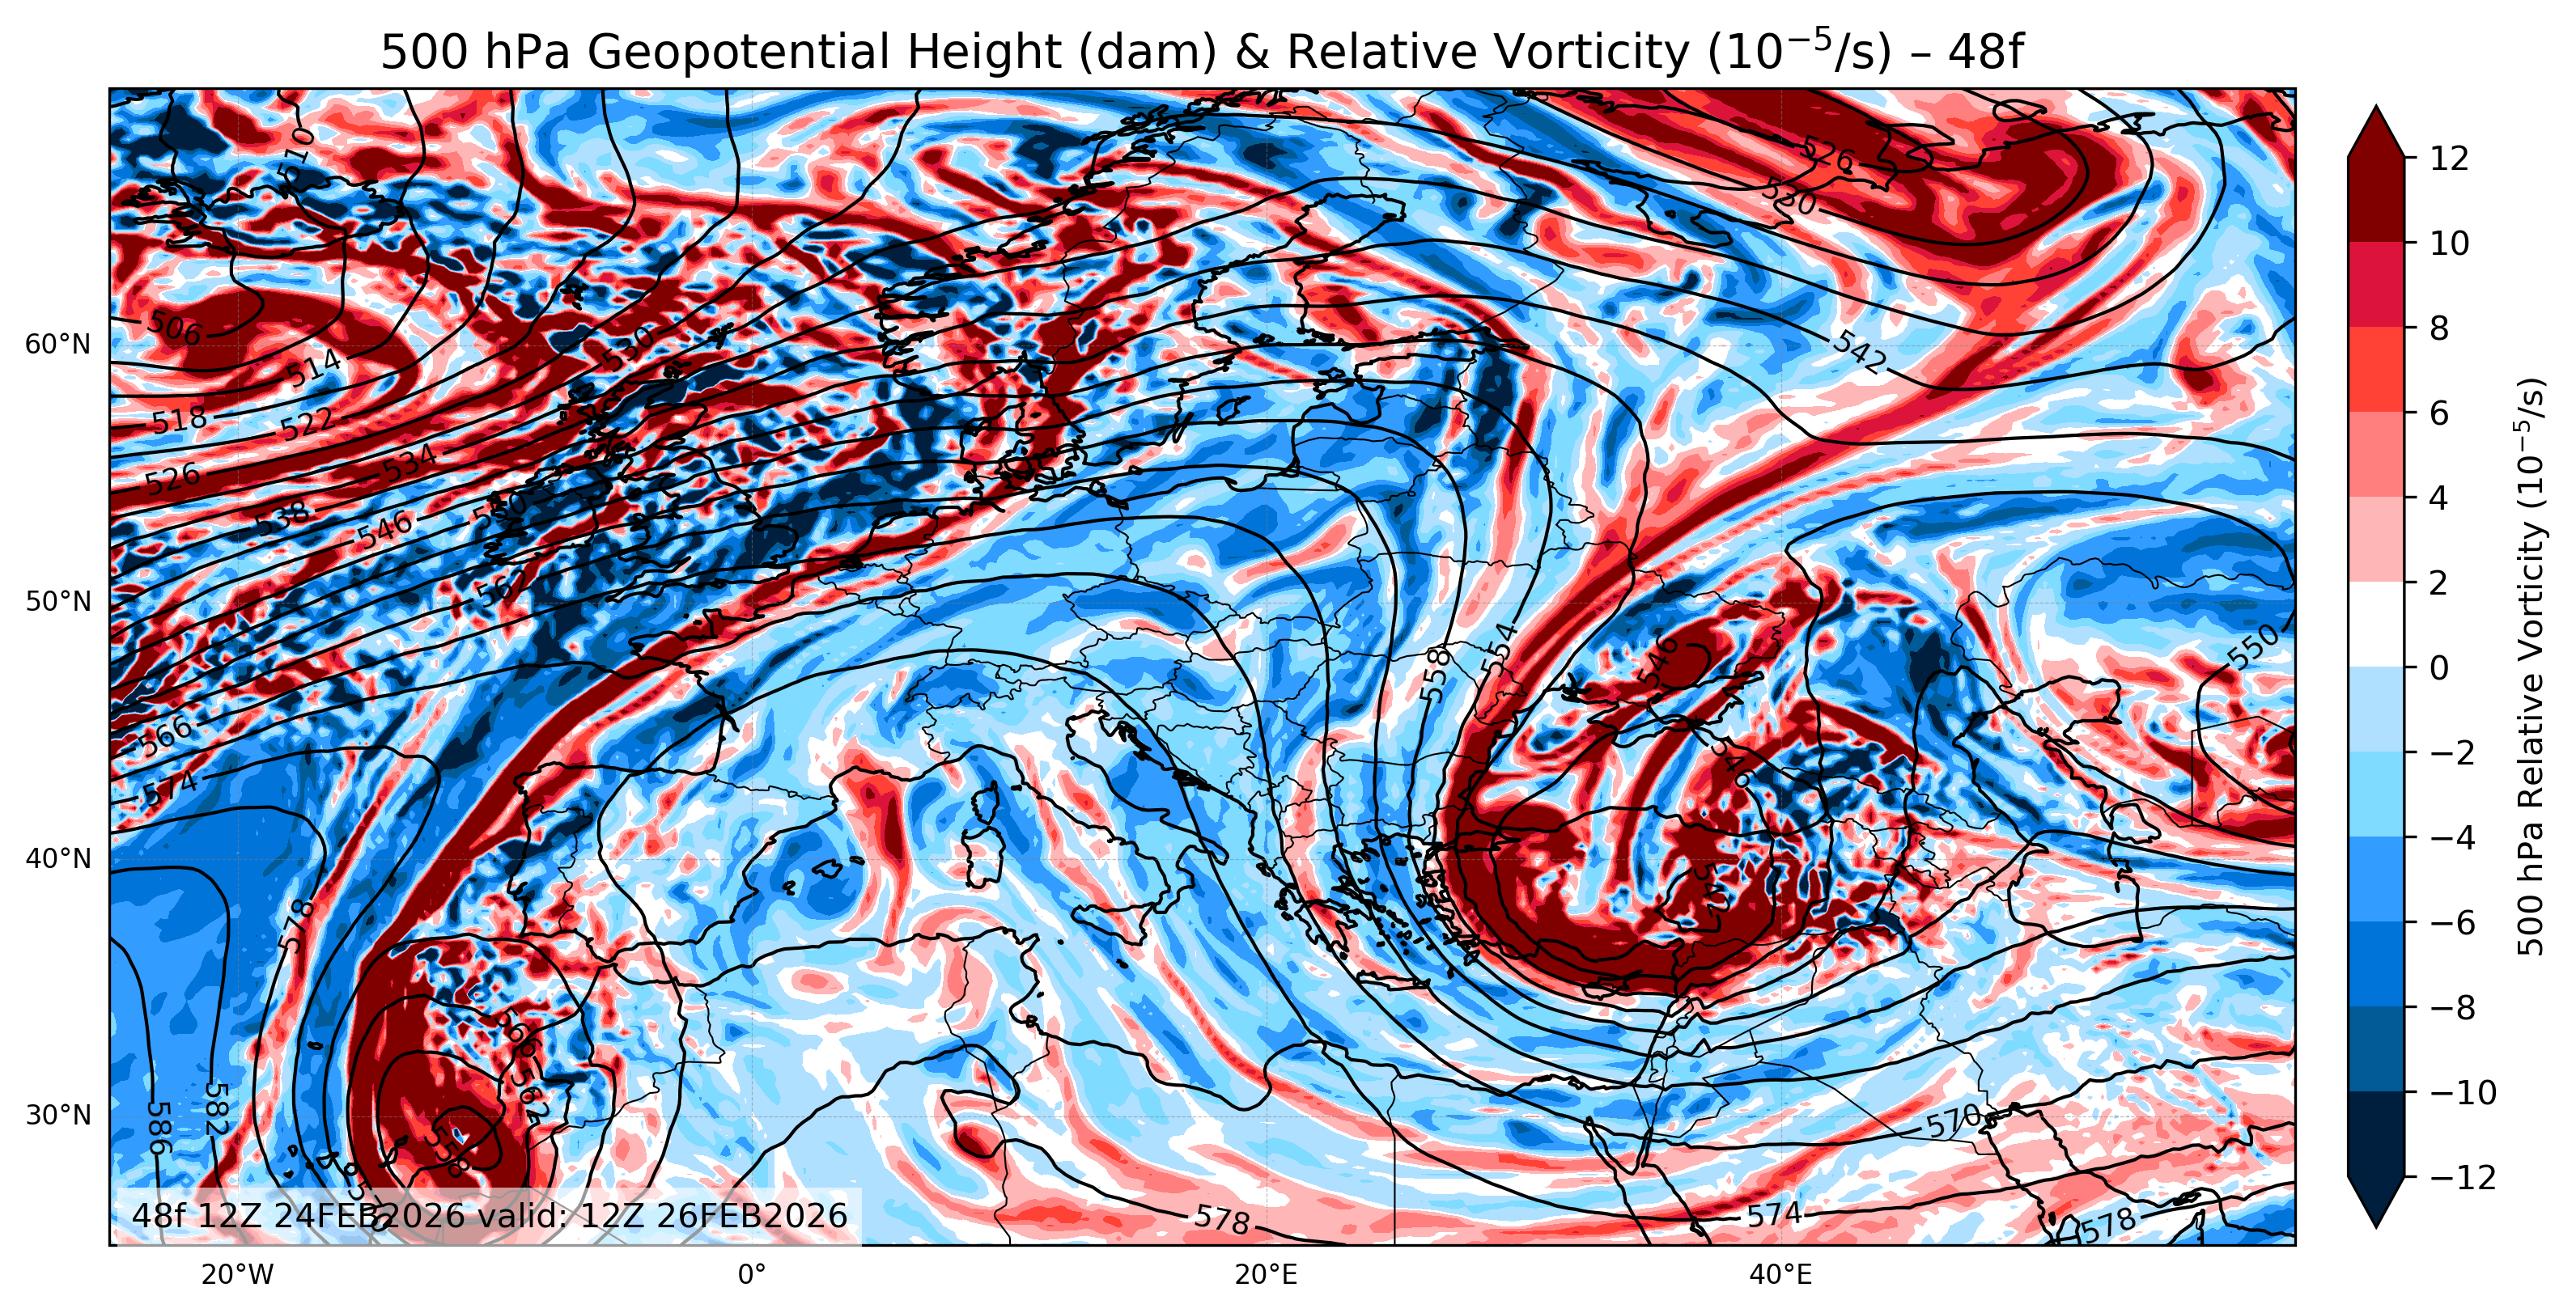
Interpreting the Euro 500 hPa Geopotential Height and Relative Vorticity 48 Map
This chart overlays color-coded relative vorticity onto the height contours. Since this is the “48” output, it predicts conditions exactly two days into the future. Here is how to read the colors:
1. Red Areas (Positive Relative Vorticity)
The red and brown zones on the Geopotential Height and Relative Vorticity 48 map represent predicted positive relative vorticity.
- Meaning: This indicates cyclonic rotation (counter-clockwise spin).
- 48-Hour Outlook: If you see a red zone moving toward your location on this chart, expect active weather, lifting air, and potential storms in two days. These areas are often the “energy centers” of low-pressure systems.
2. Blue Areas (Negative Relative Vorticity)
The blue zones represent predicted negative relative vorticity.
- Meaning: This indicates anticyclonic rotation (clockwise spin).
- 48-Hour Outlook: These areas suggest sinking air and stability. Consequently, if the map shows blue over your region in 48 hours, you can likely predict fair weather and clearing skies.
Conclusion: Euro 500 hPa Geopotential Height and Relative Vorticity 48
In summary, the Euro 500 mb Geopotential Height and Relative Vorticity 48 chart is essential for planning. By tracking the red positive vorticity zones (storms) and blue negative vorticity zones (calm) on this geopotential height map, you can confidently forecast the weather for the days ahead. But you need to compare it with other maps.
Click for Euro 500 mb geopotential height and relative vorticity 72f