Weather Forecast for Australia and New Zealand:
Medium Range Forecasts
| Weather Map Images | Time: | Analysis | Day 1 24 Hours |
Day 2 48 Hours |
Day 3 72 Hours |
Day 4 96 Hours |
| Field: | All Fields |
All Fields |
All Fields |
All Fields |
All Fields |
|
| 500mb Geopotential Height & Vorticity |
All Times |
🔍 | 🔍 | 🔍 | 🔍 | 🔍 |
| Sea Level Pressure & 1000-500mb Thickness |
All Times |
🔍 | 🔍 | 🔍 | 🔍 | 🔍 |
| 700 mb Vertical Velocity (mb/hr) | All Times |
🔍 | 🔍 | 🔍 | 🔍 | 🔍 |
| 850mb Temperature Relative Humidity & Winds |
All Times |
🔍 | 🔍 | 🔍 | 🔍 | 🔍 |
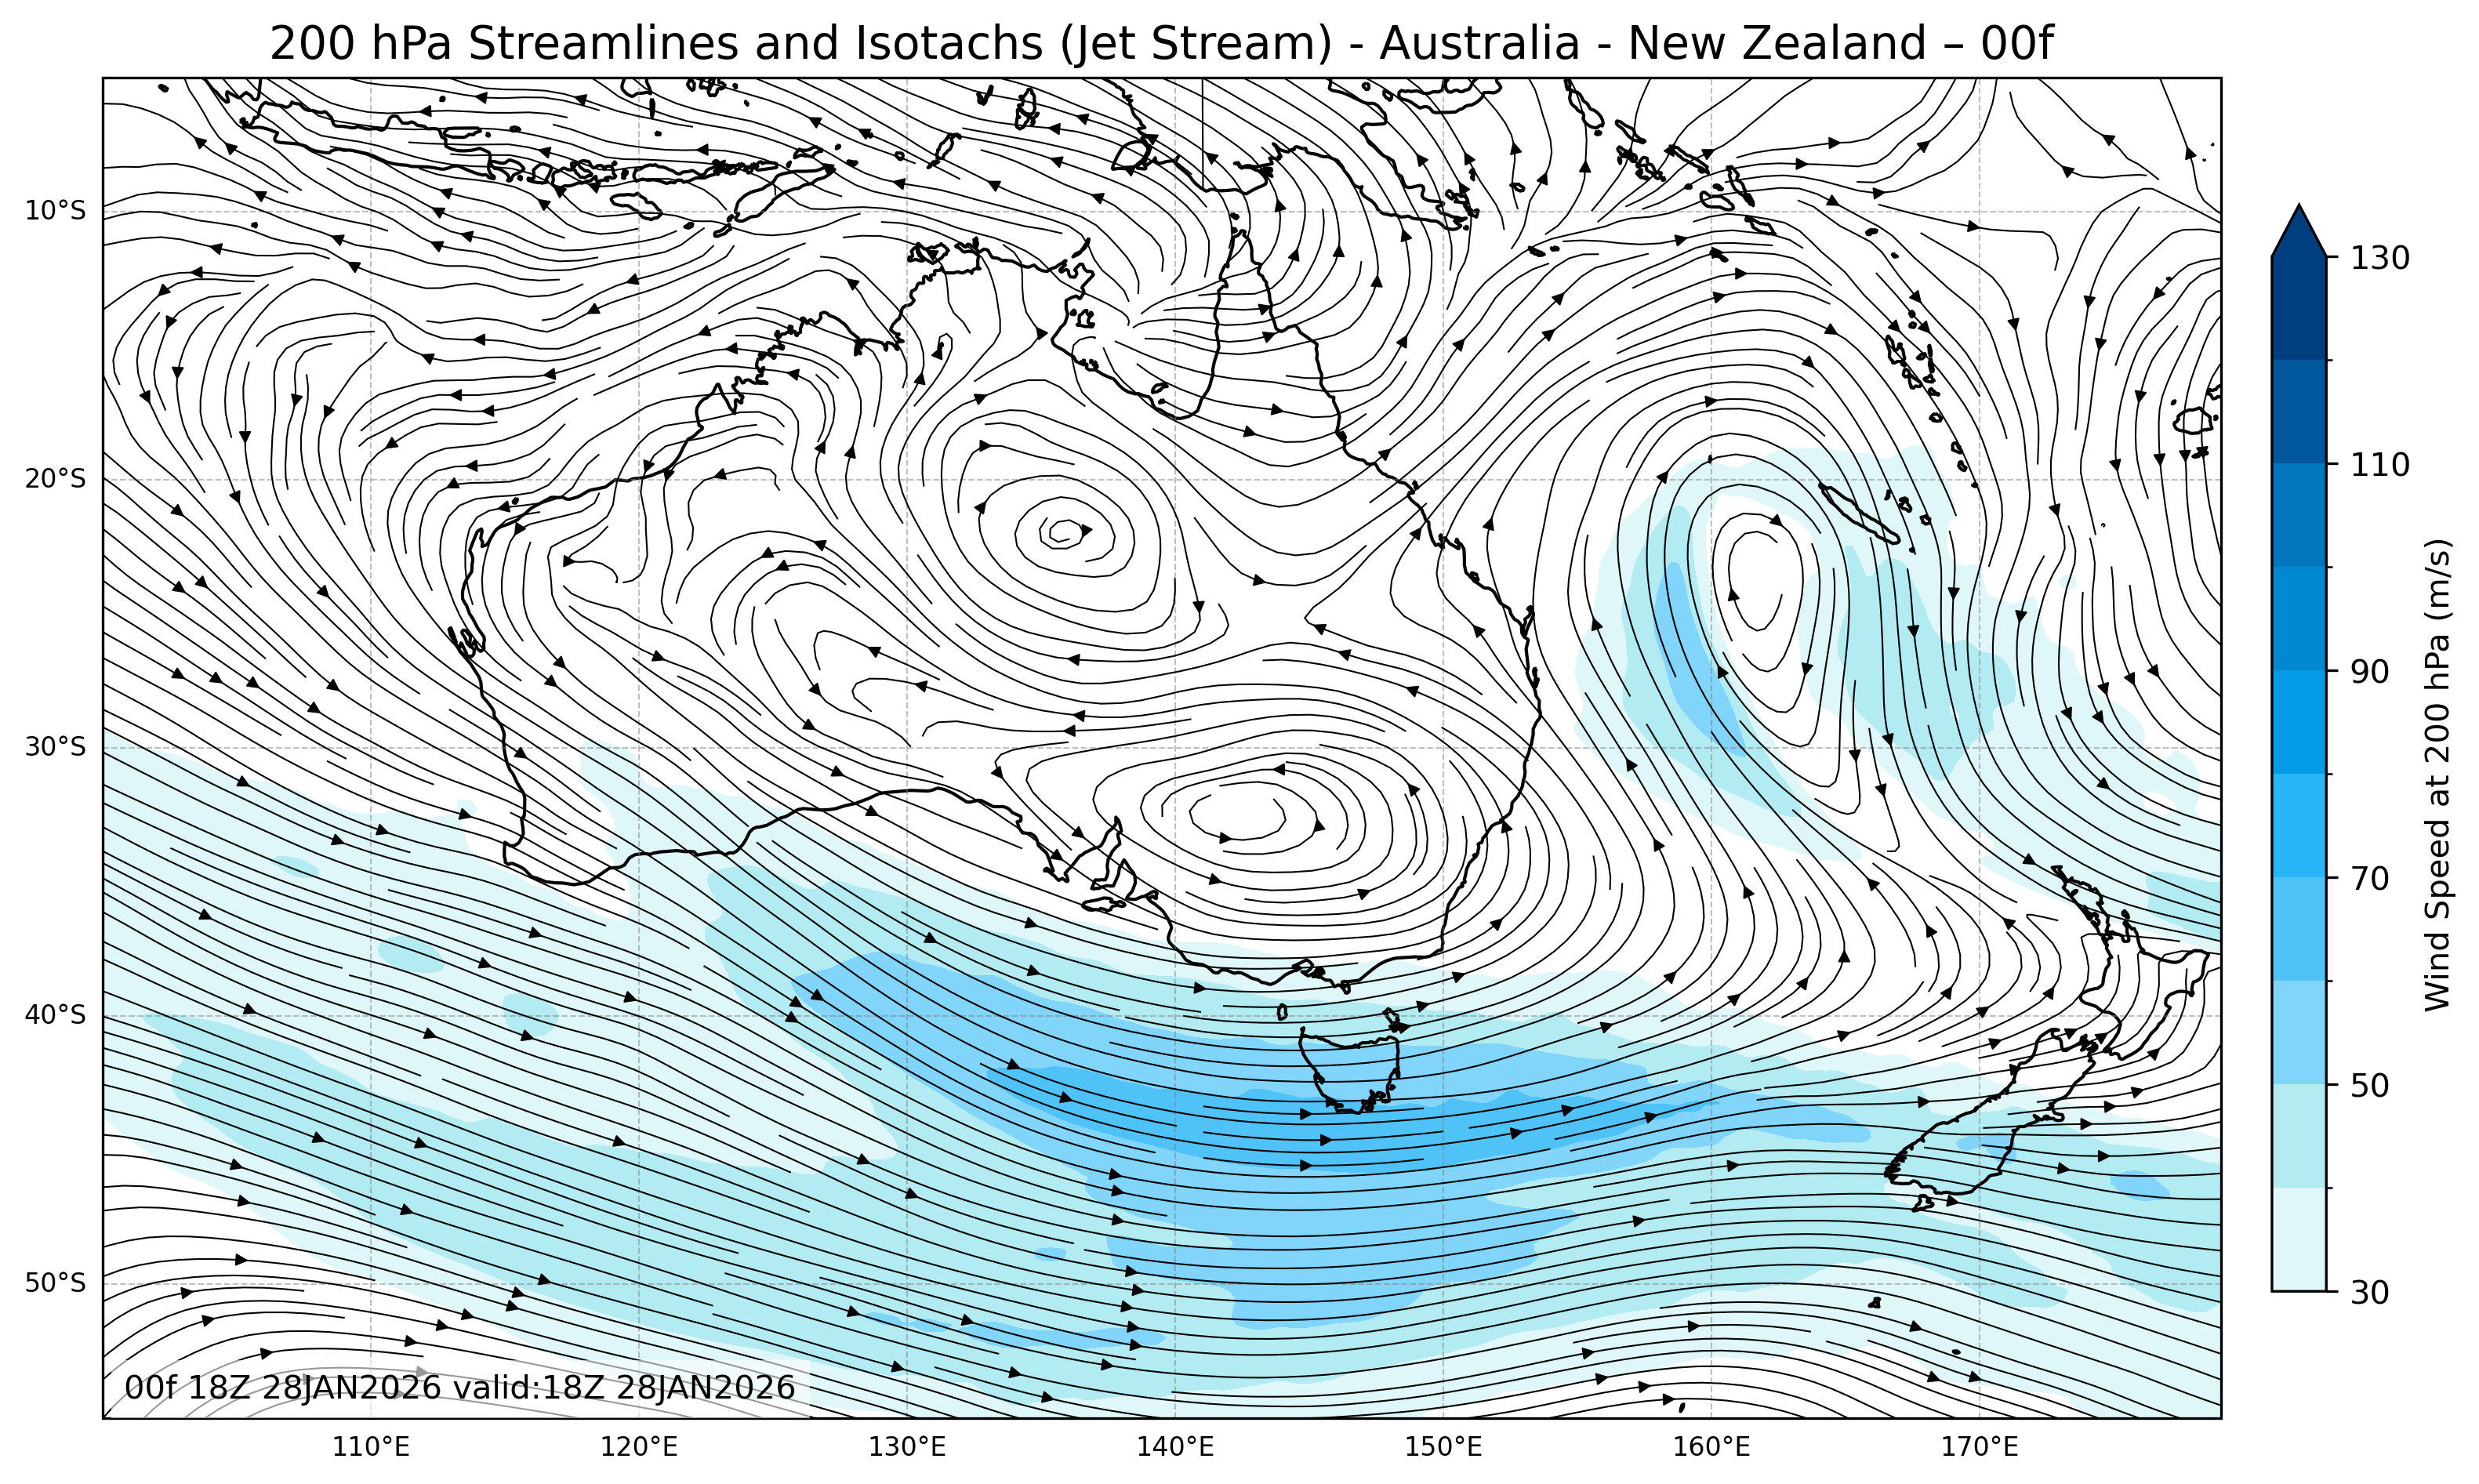
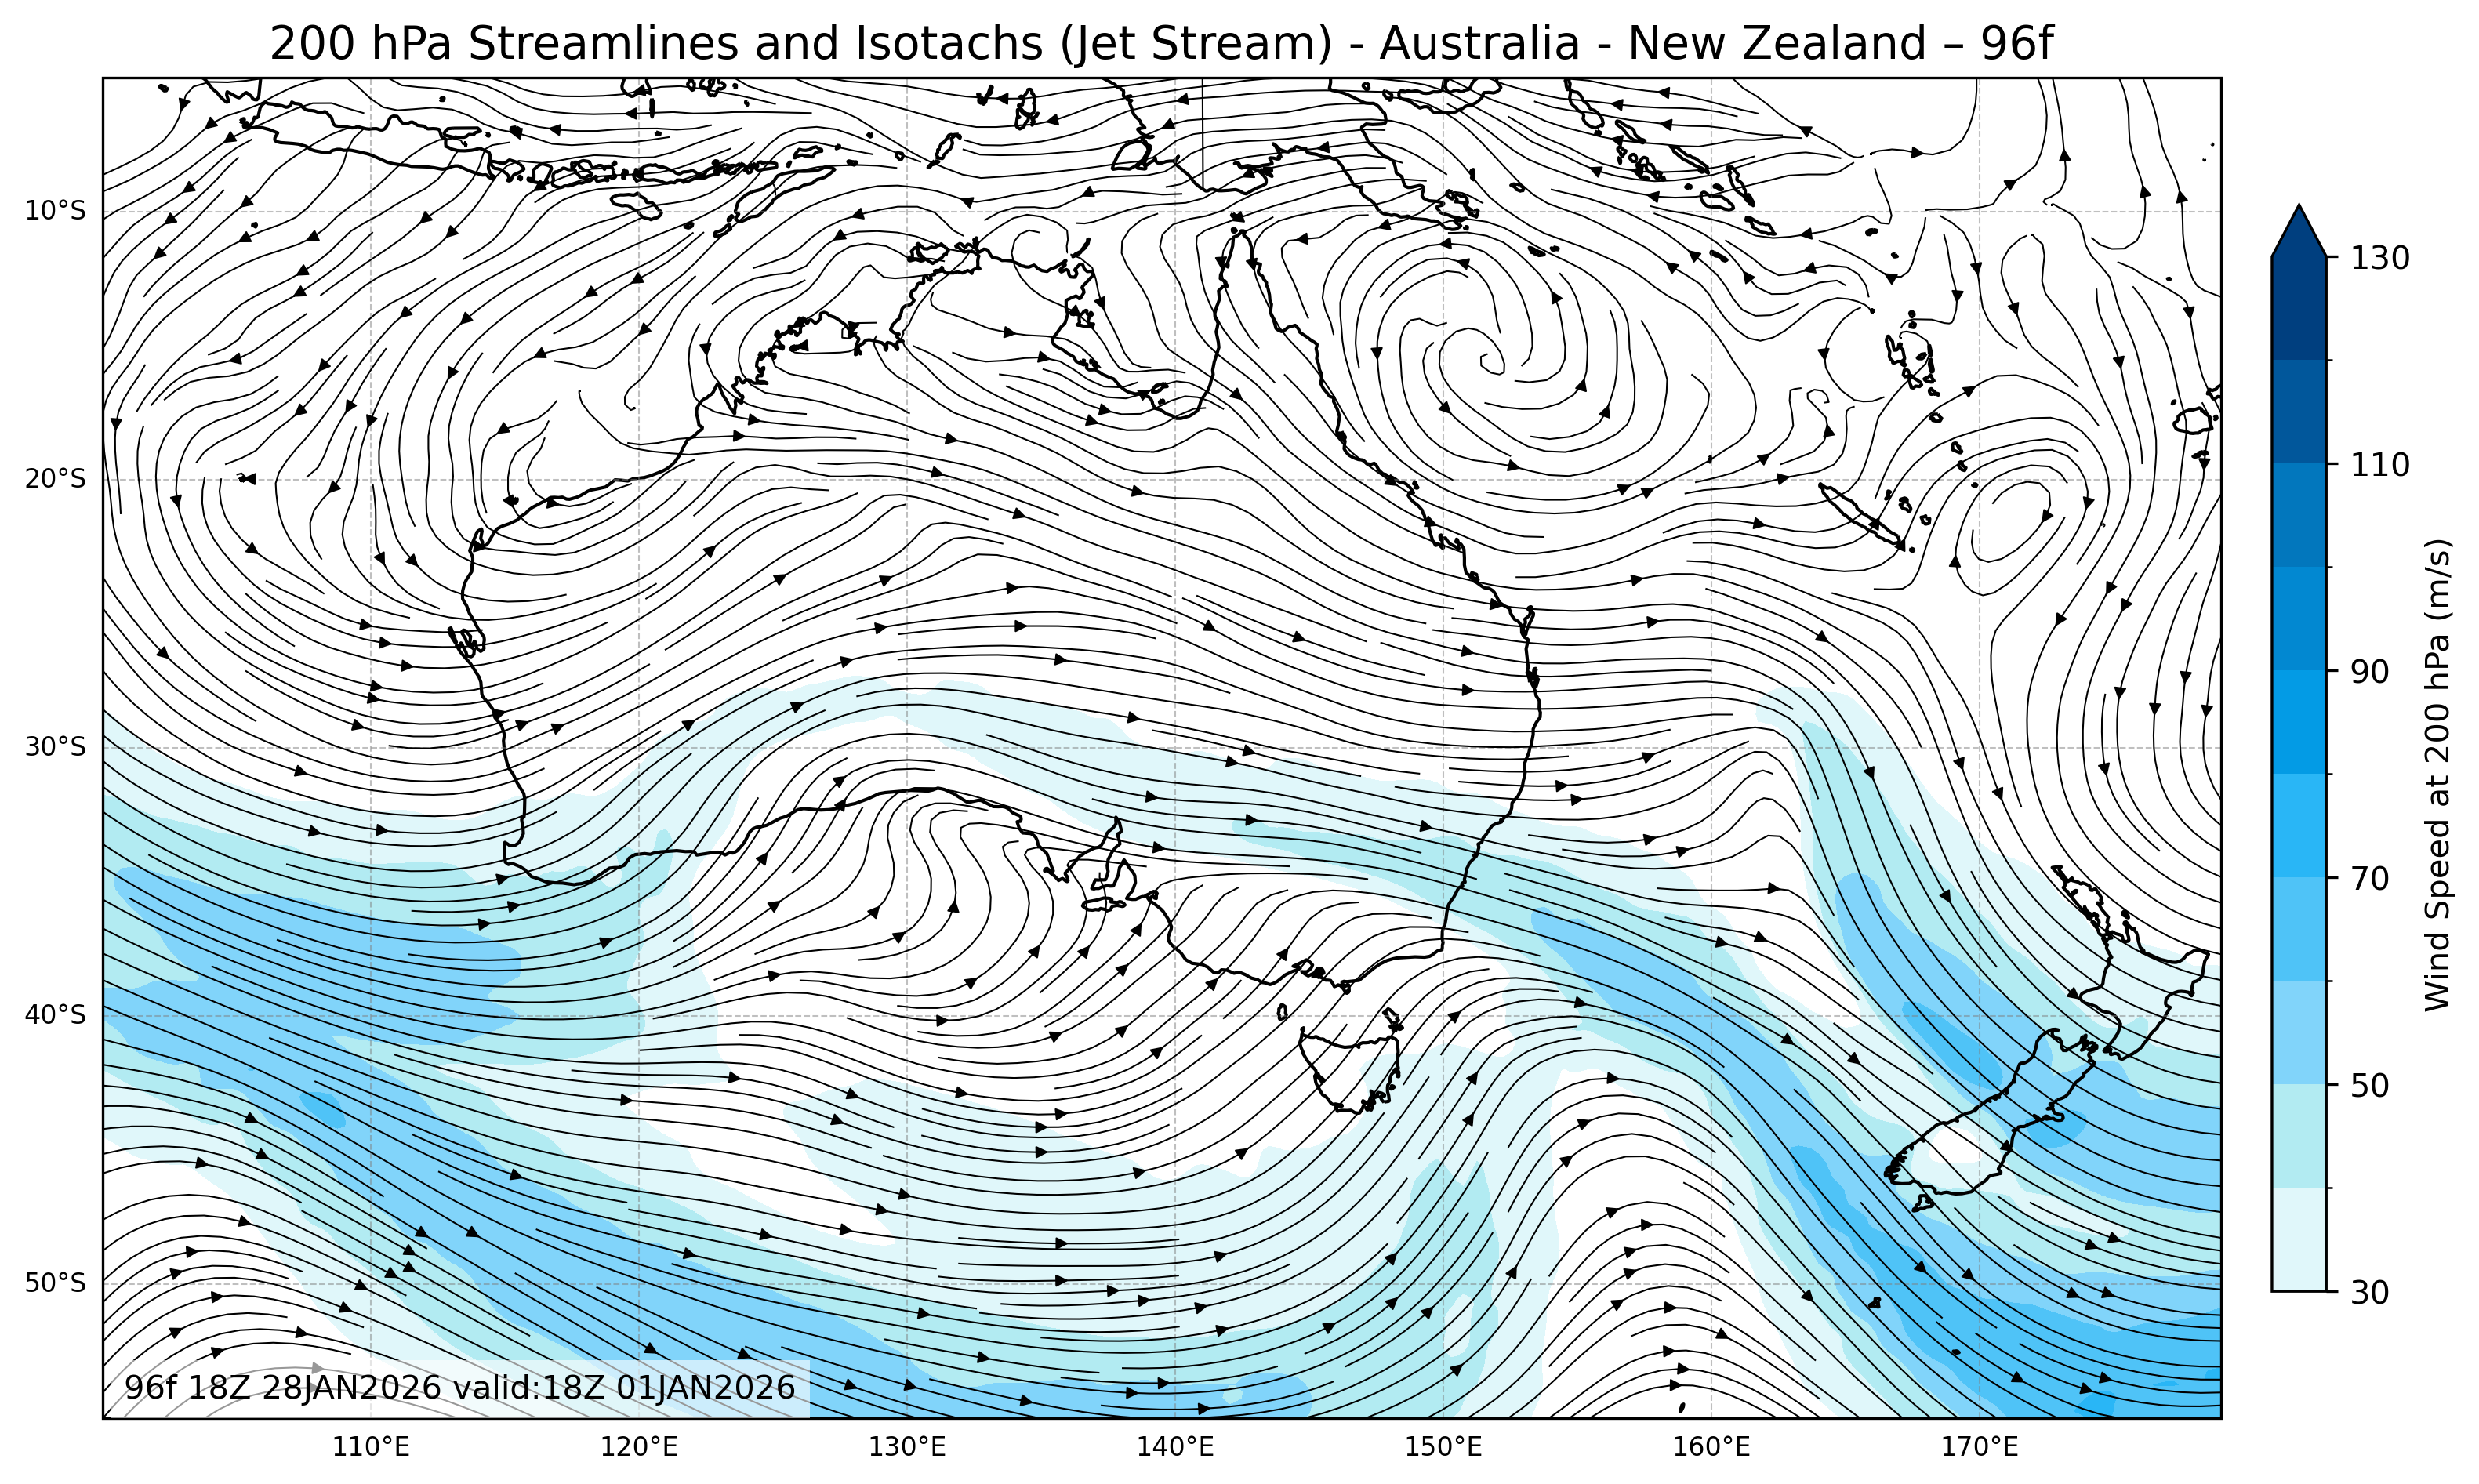
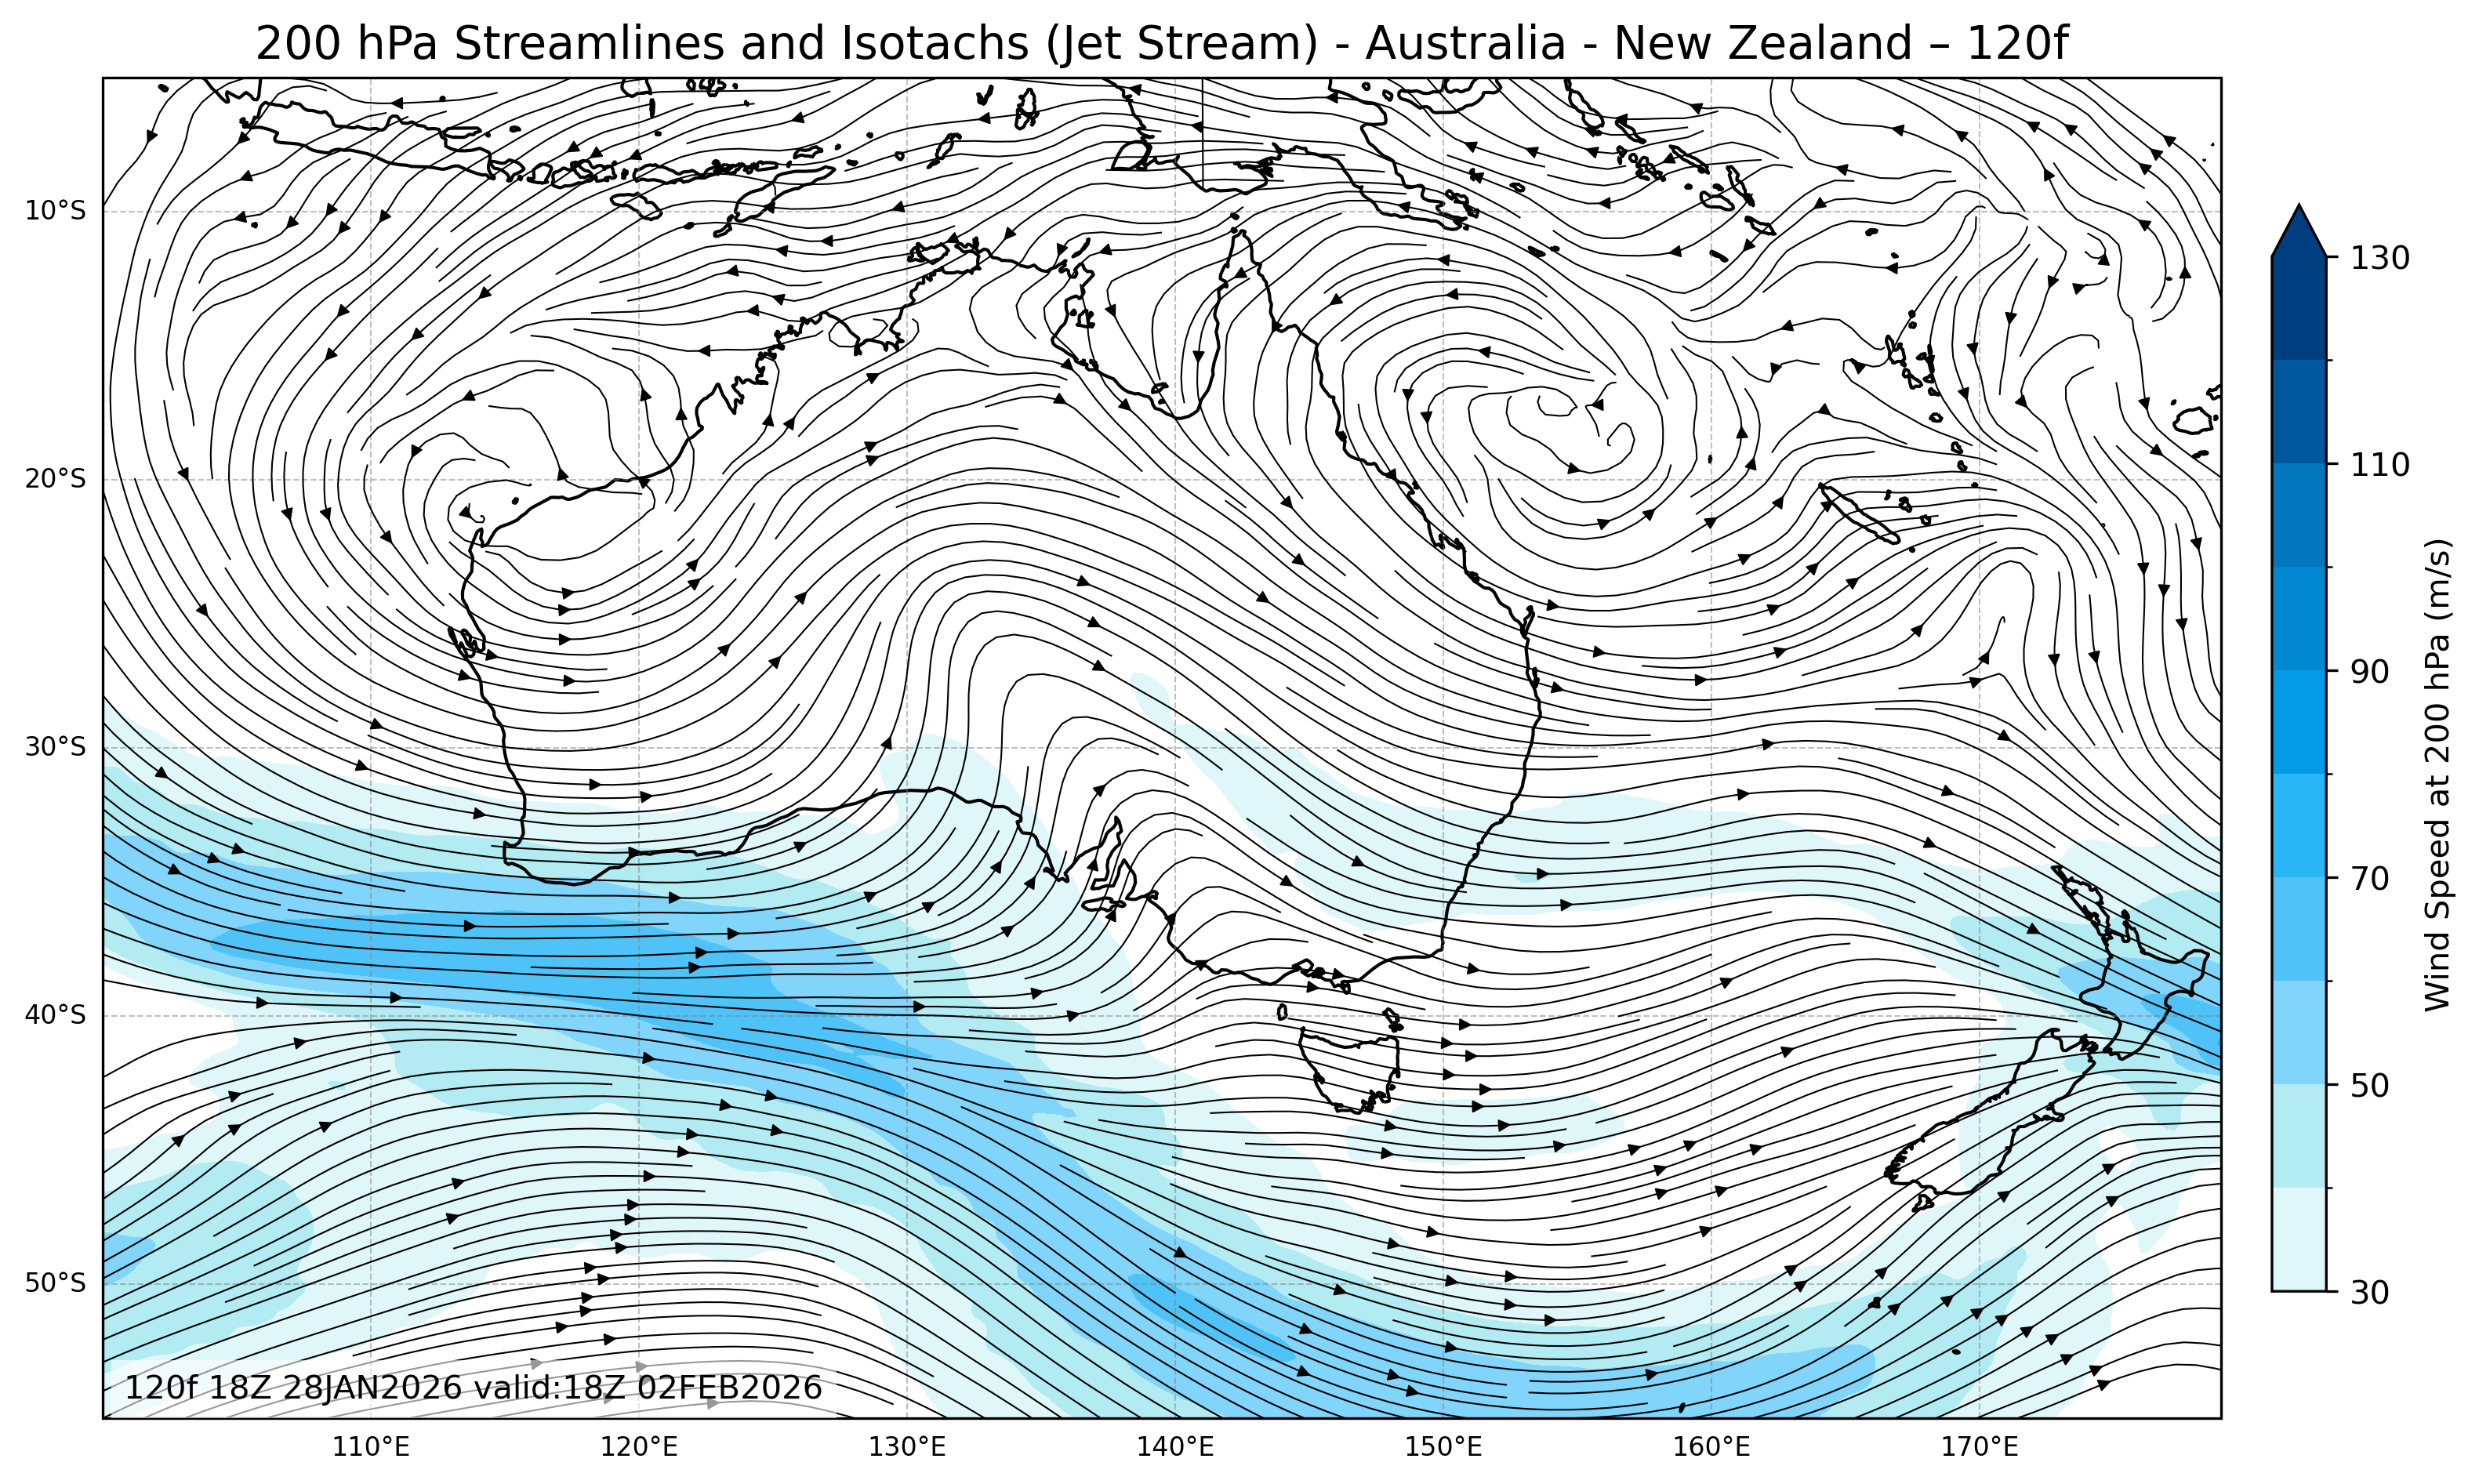
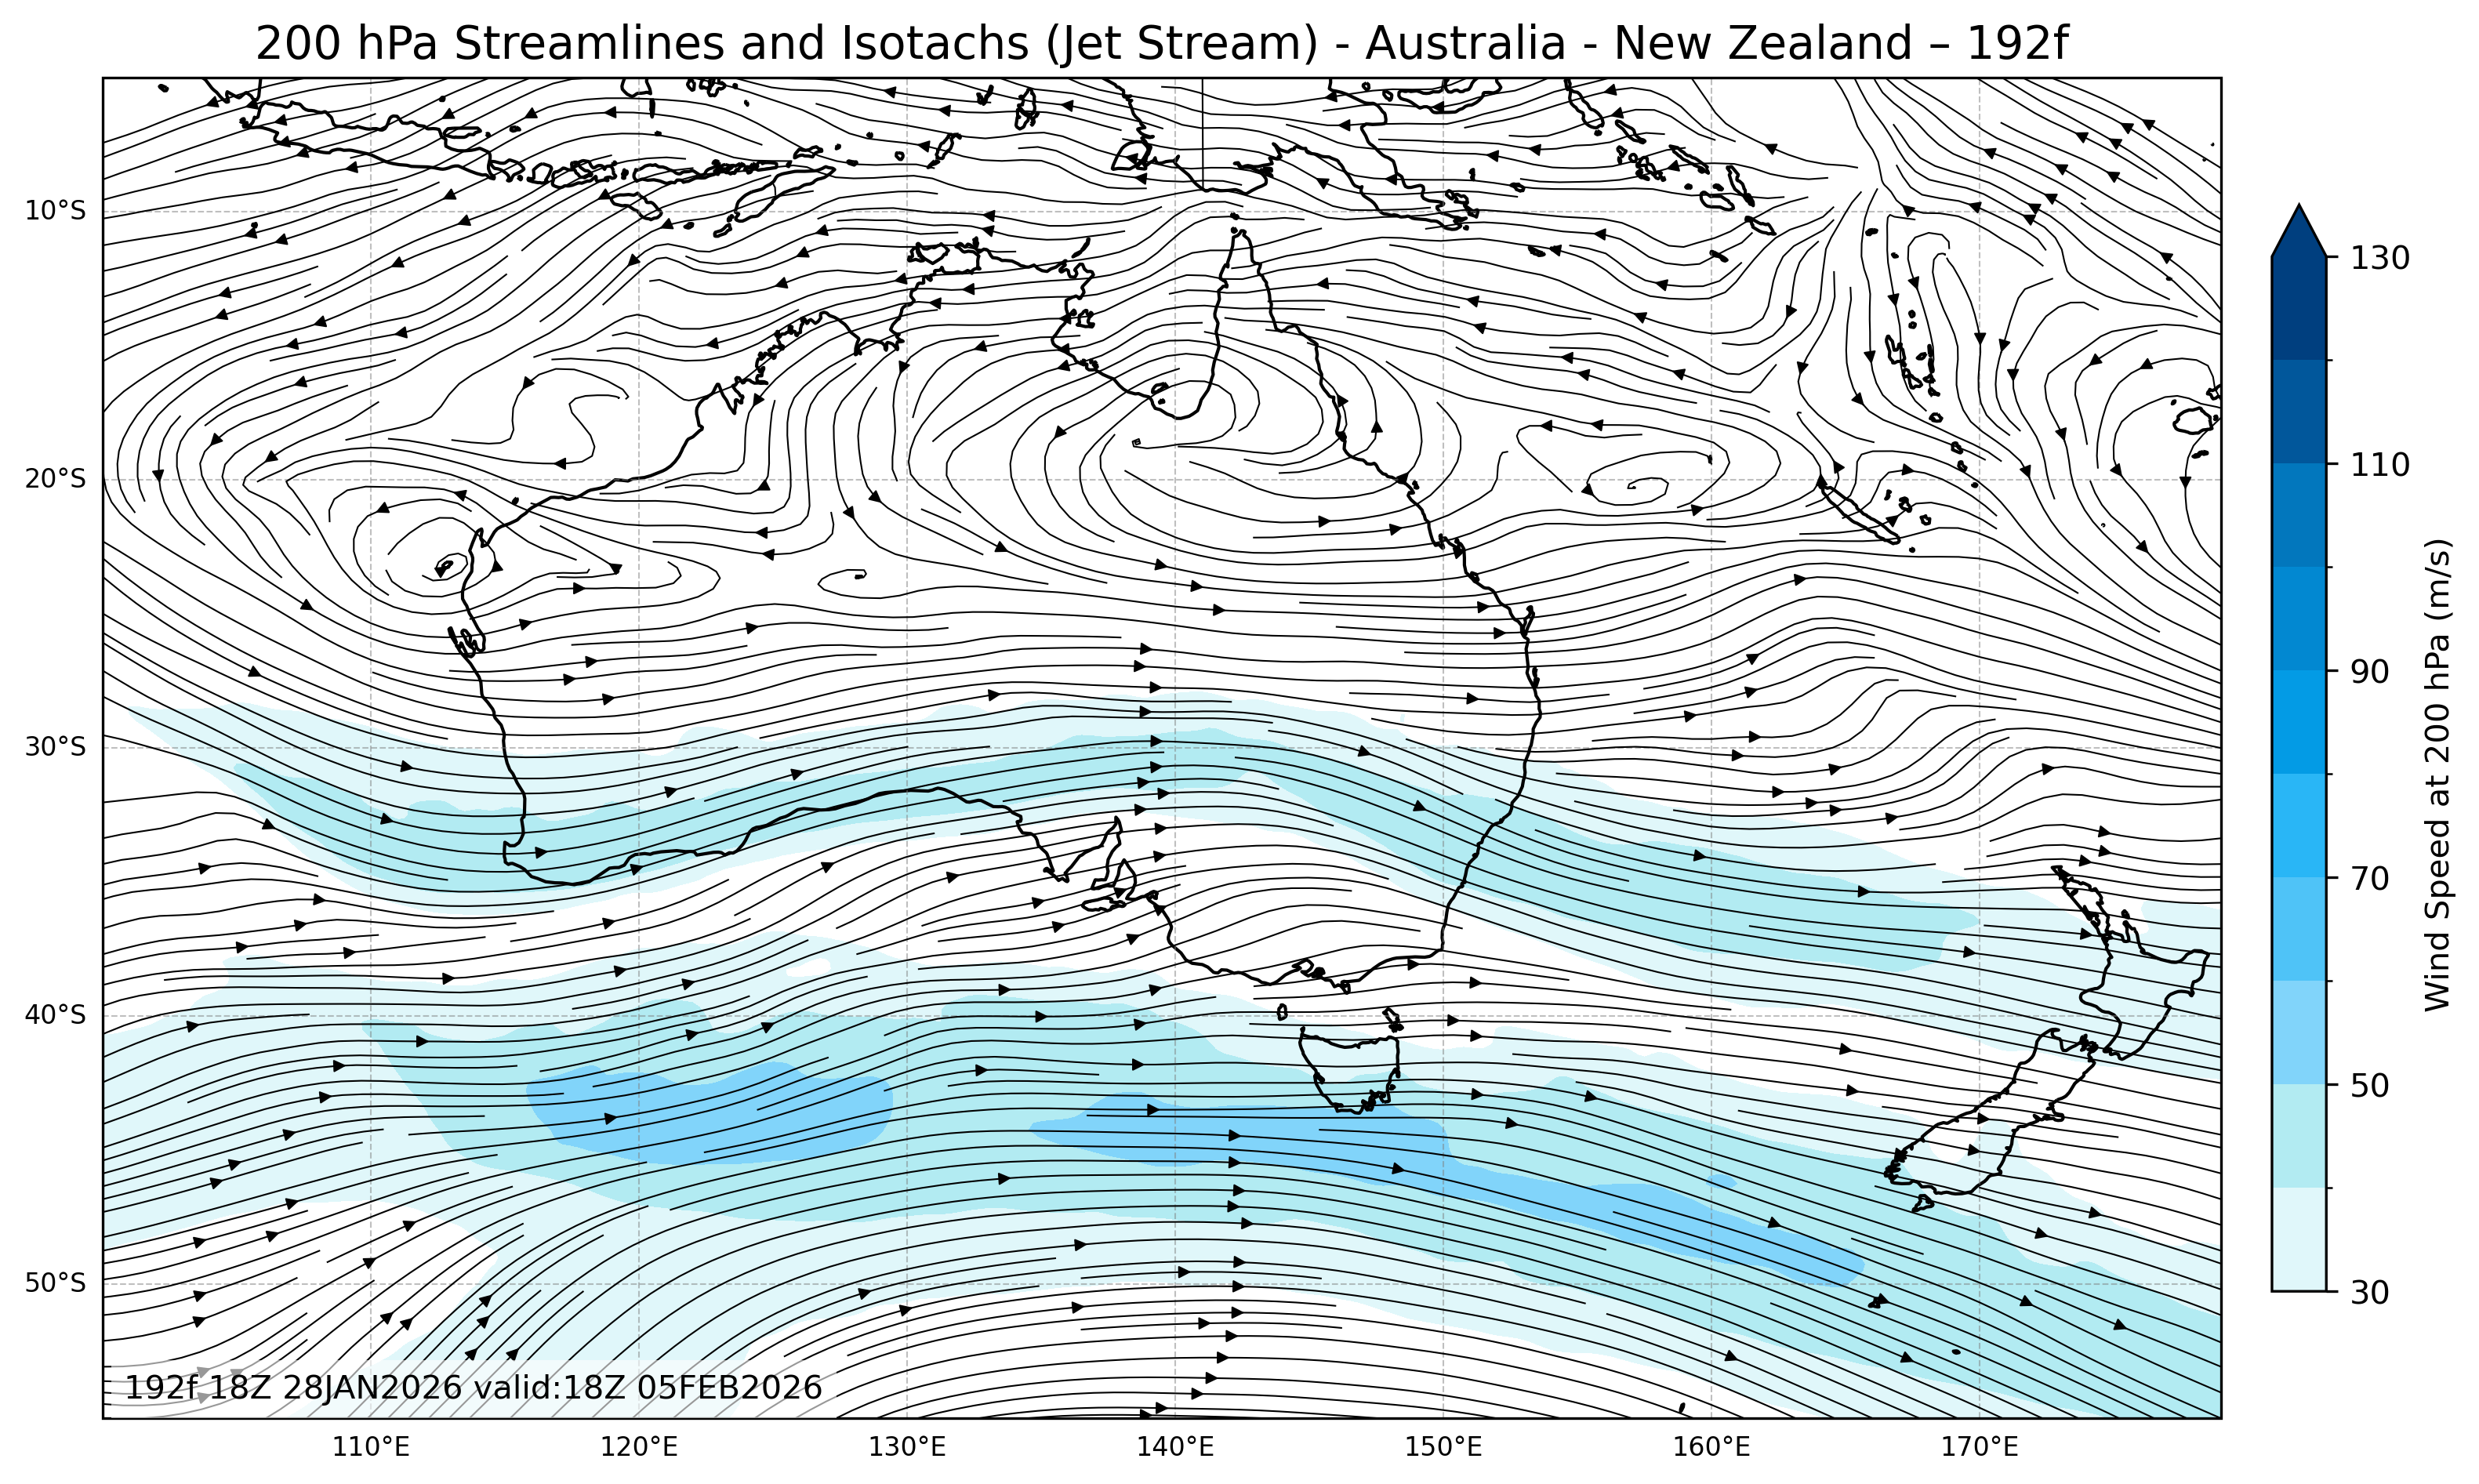
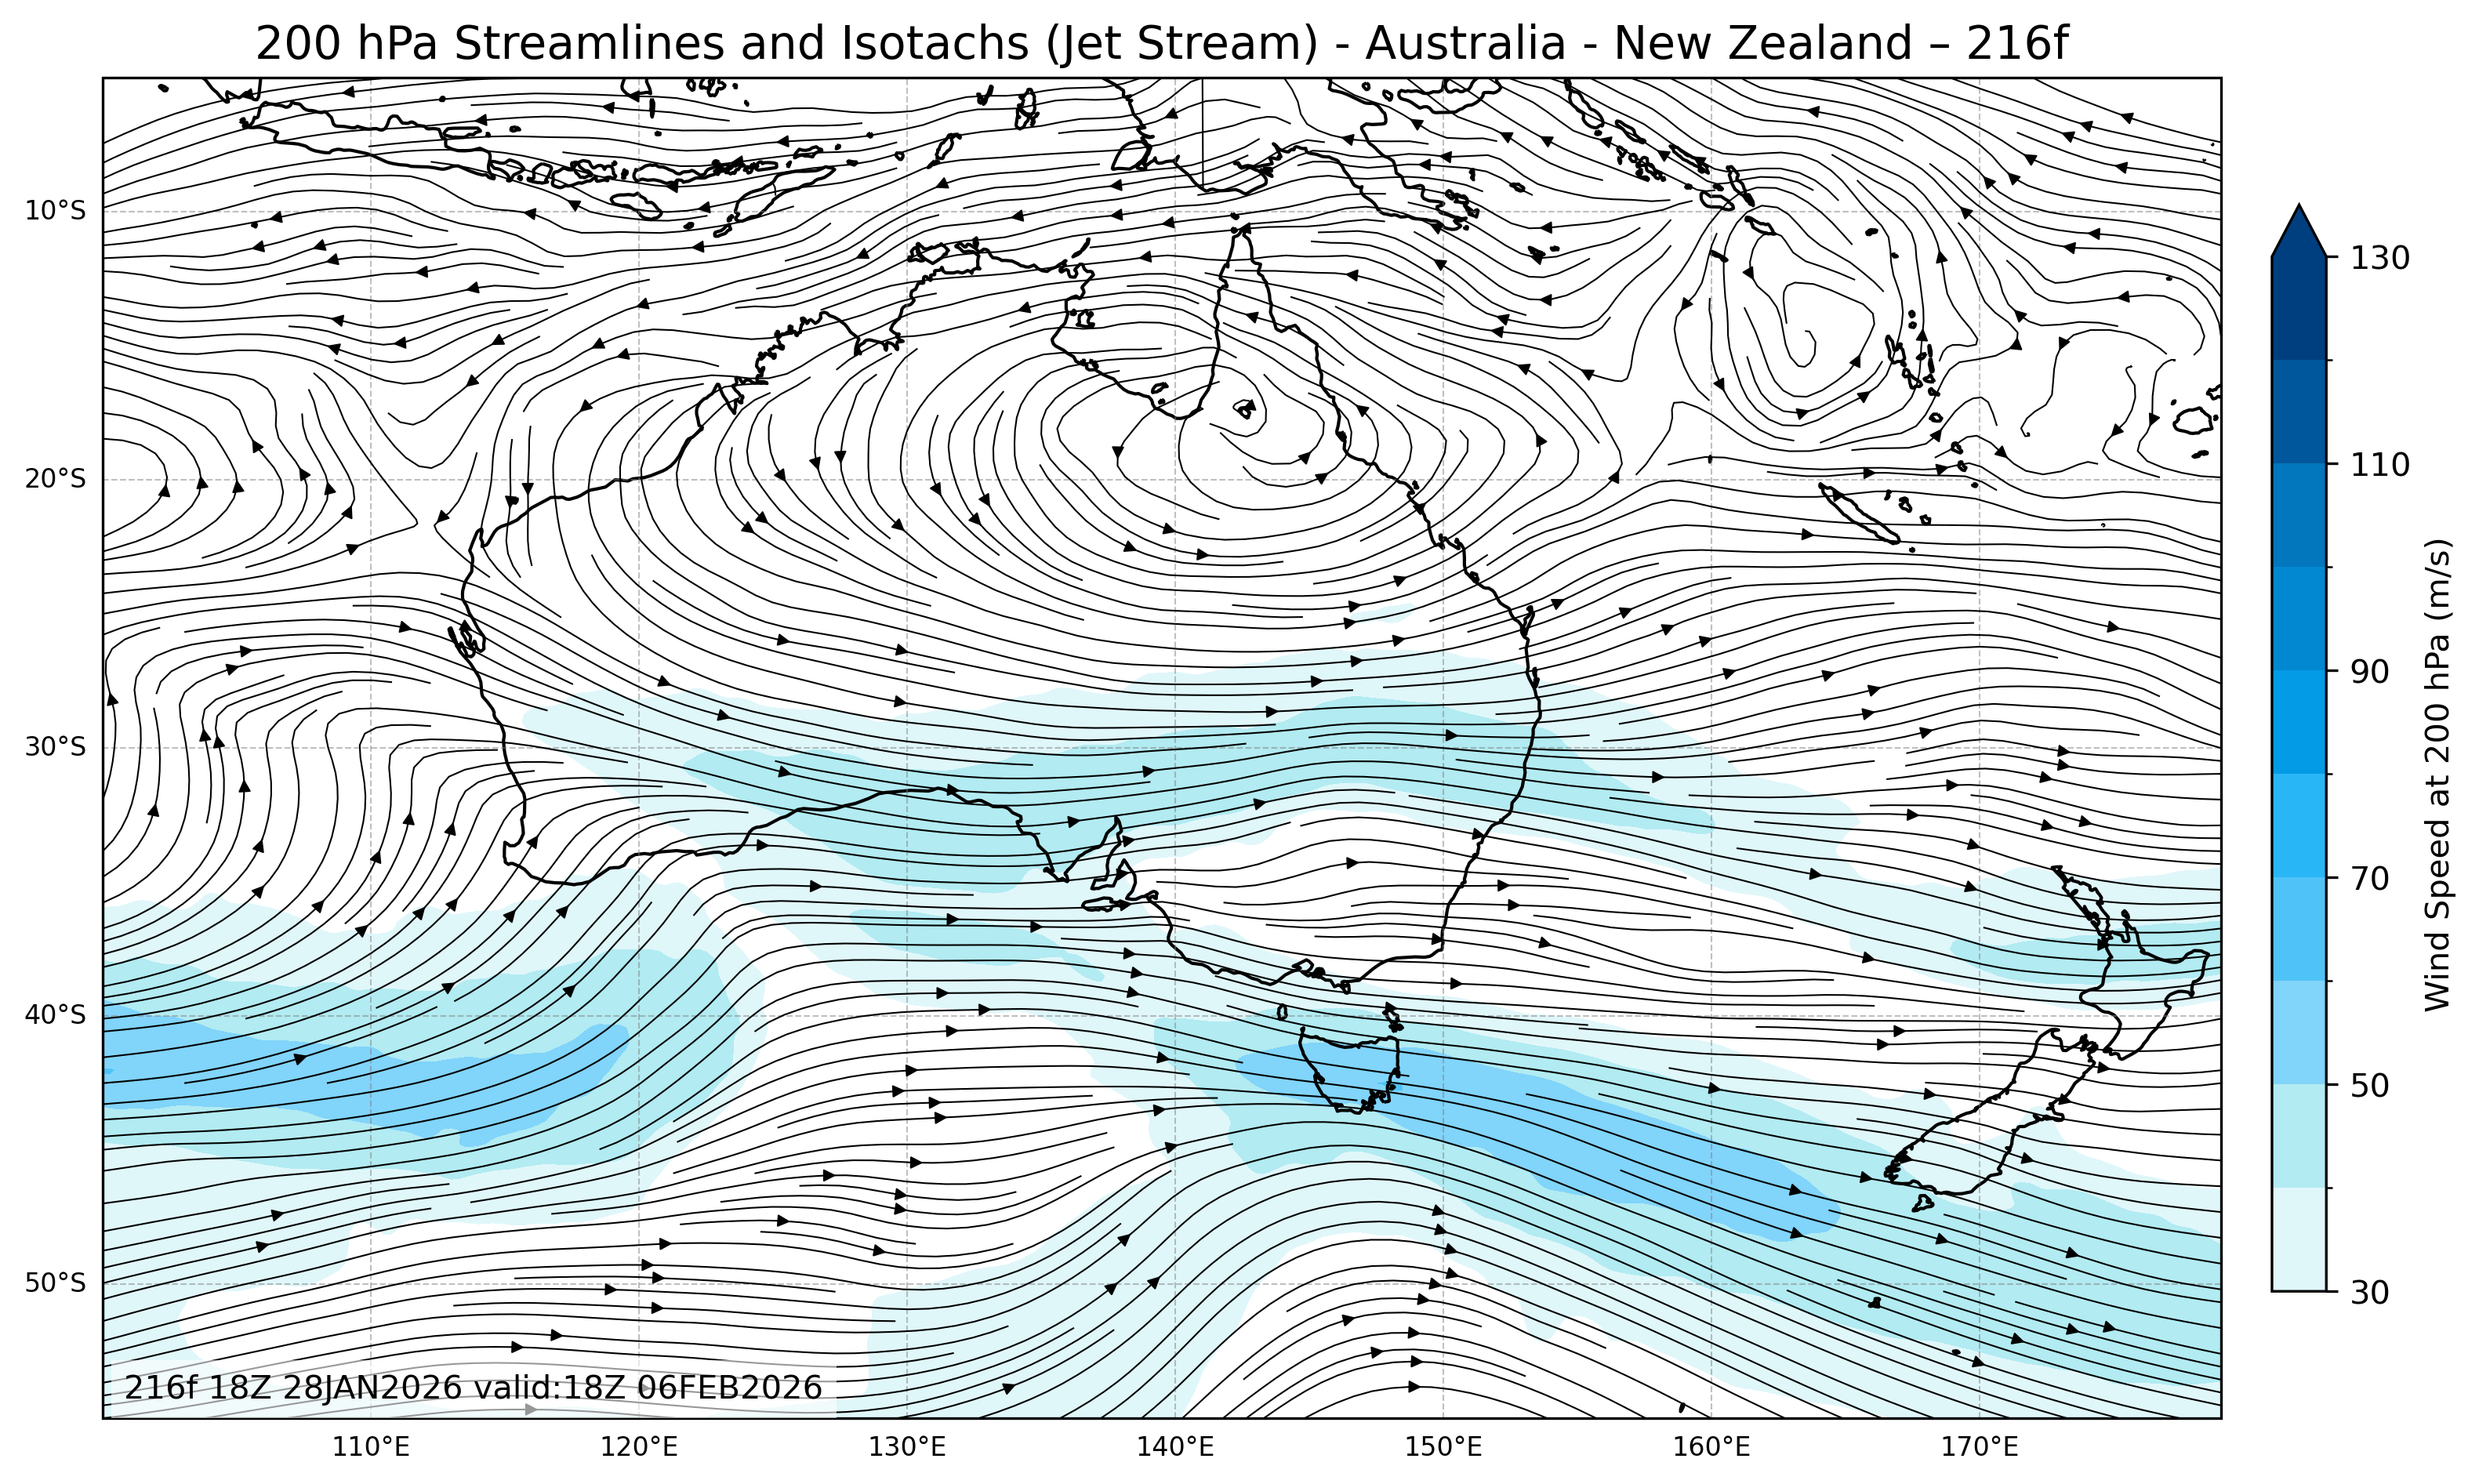
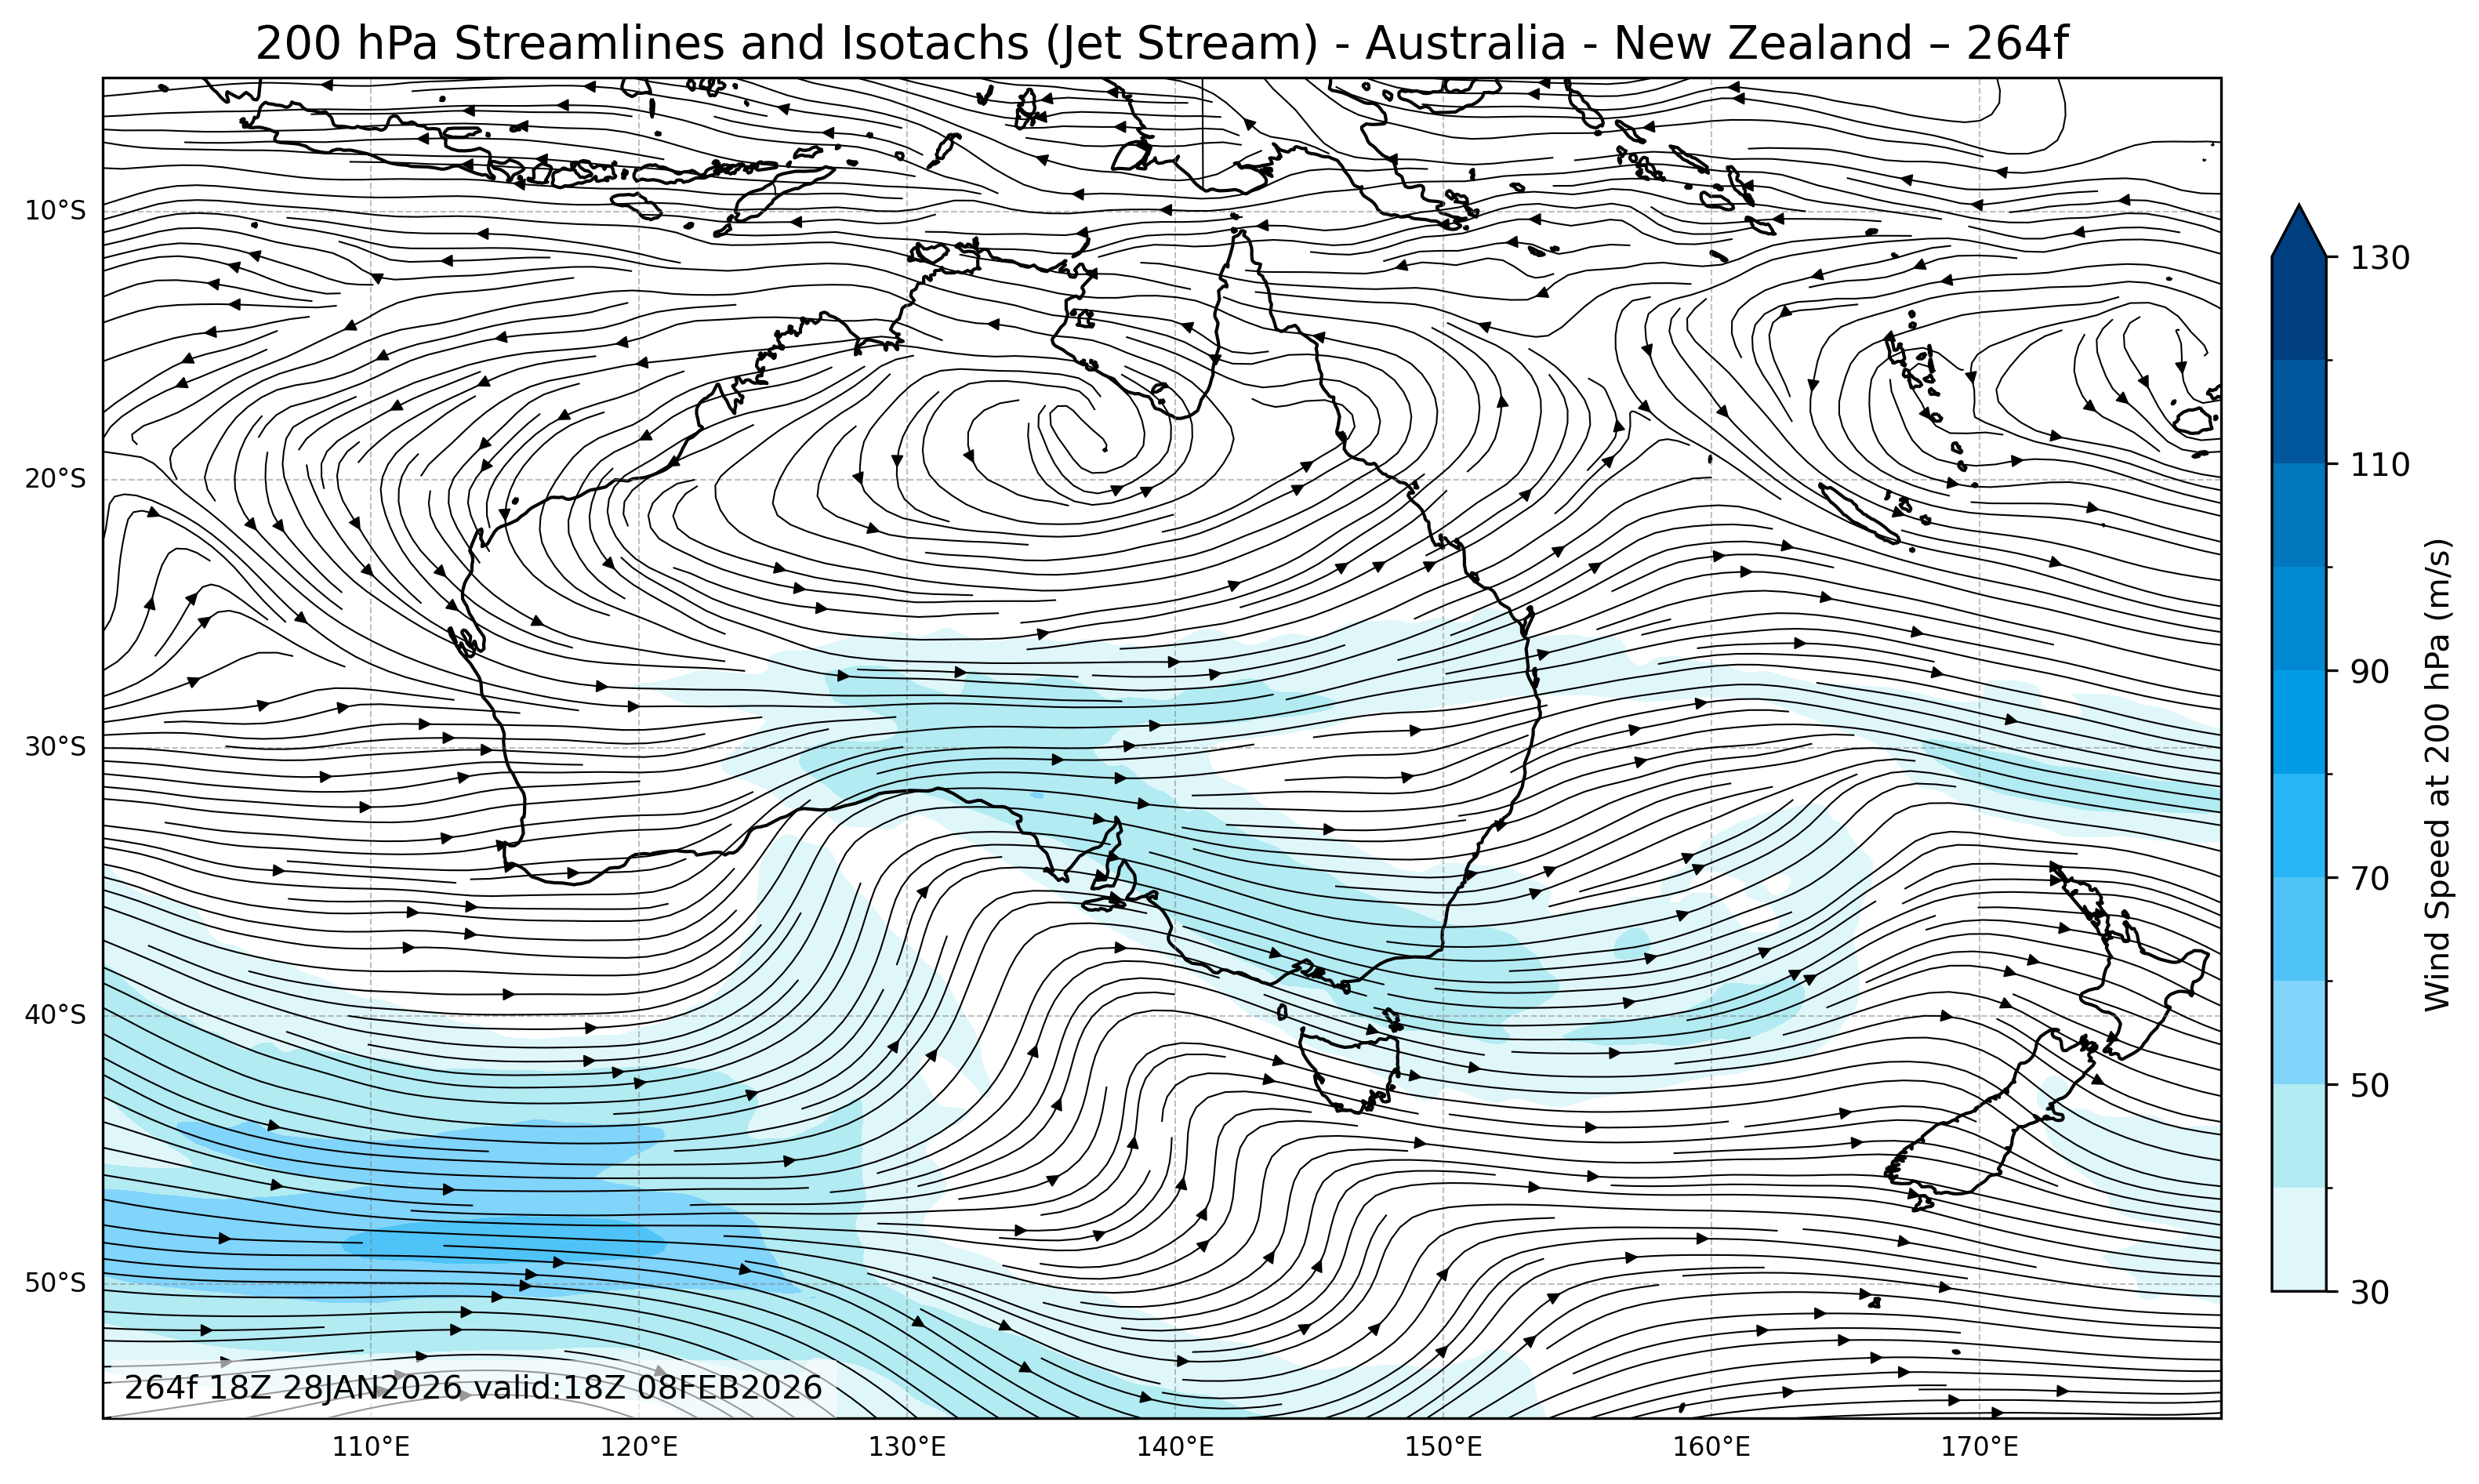
| 200mb Streamlines & Isotachs |
All Times |
🔍 | 🔍 | 🔍 | 🔍 | 🔍 |
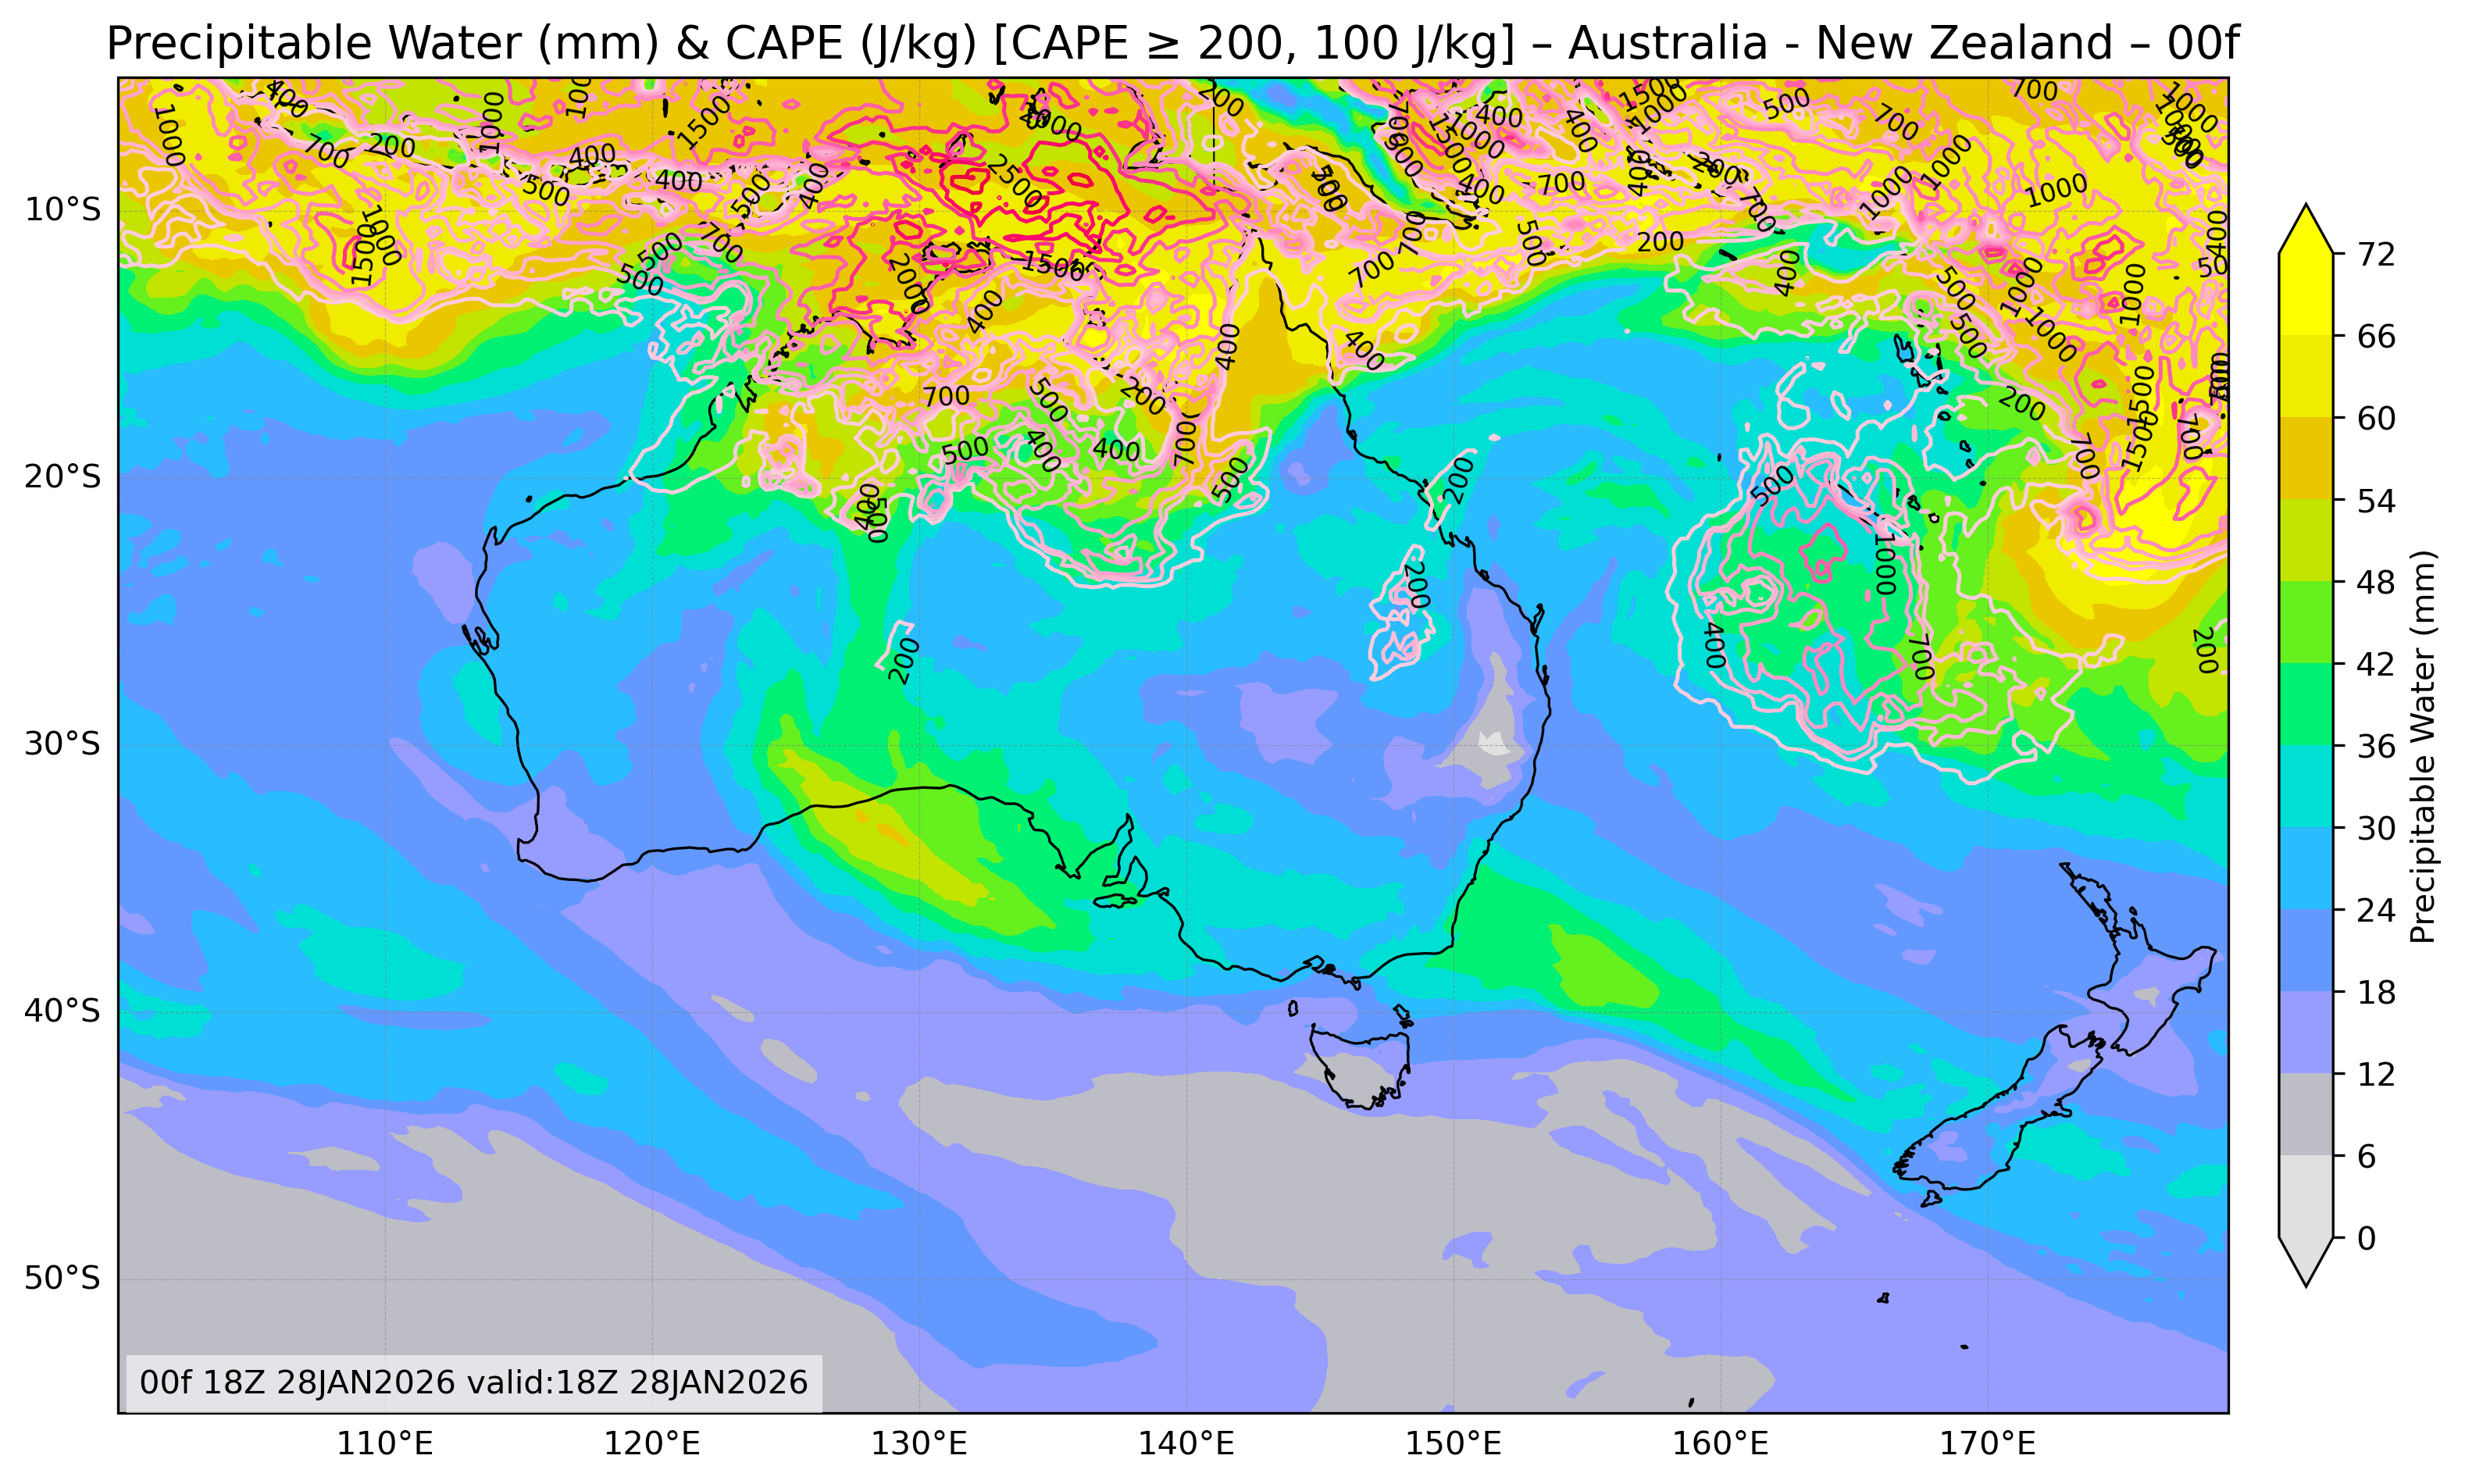
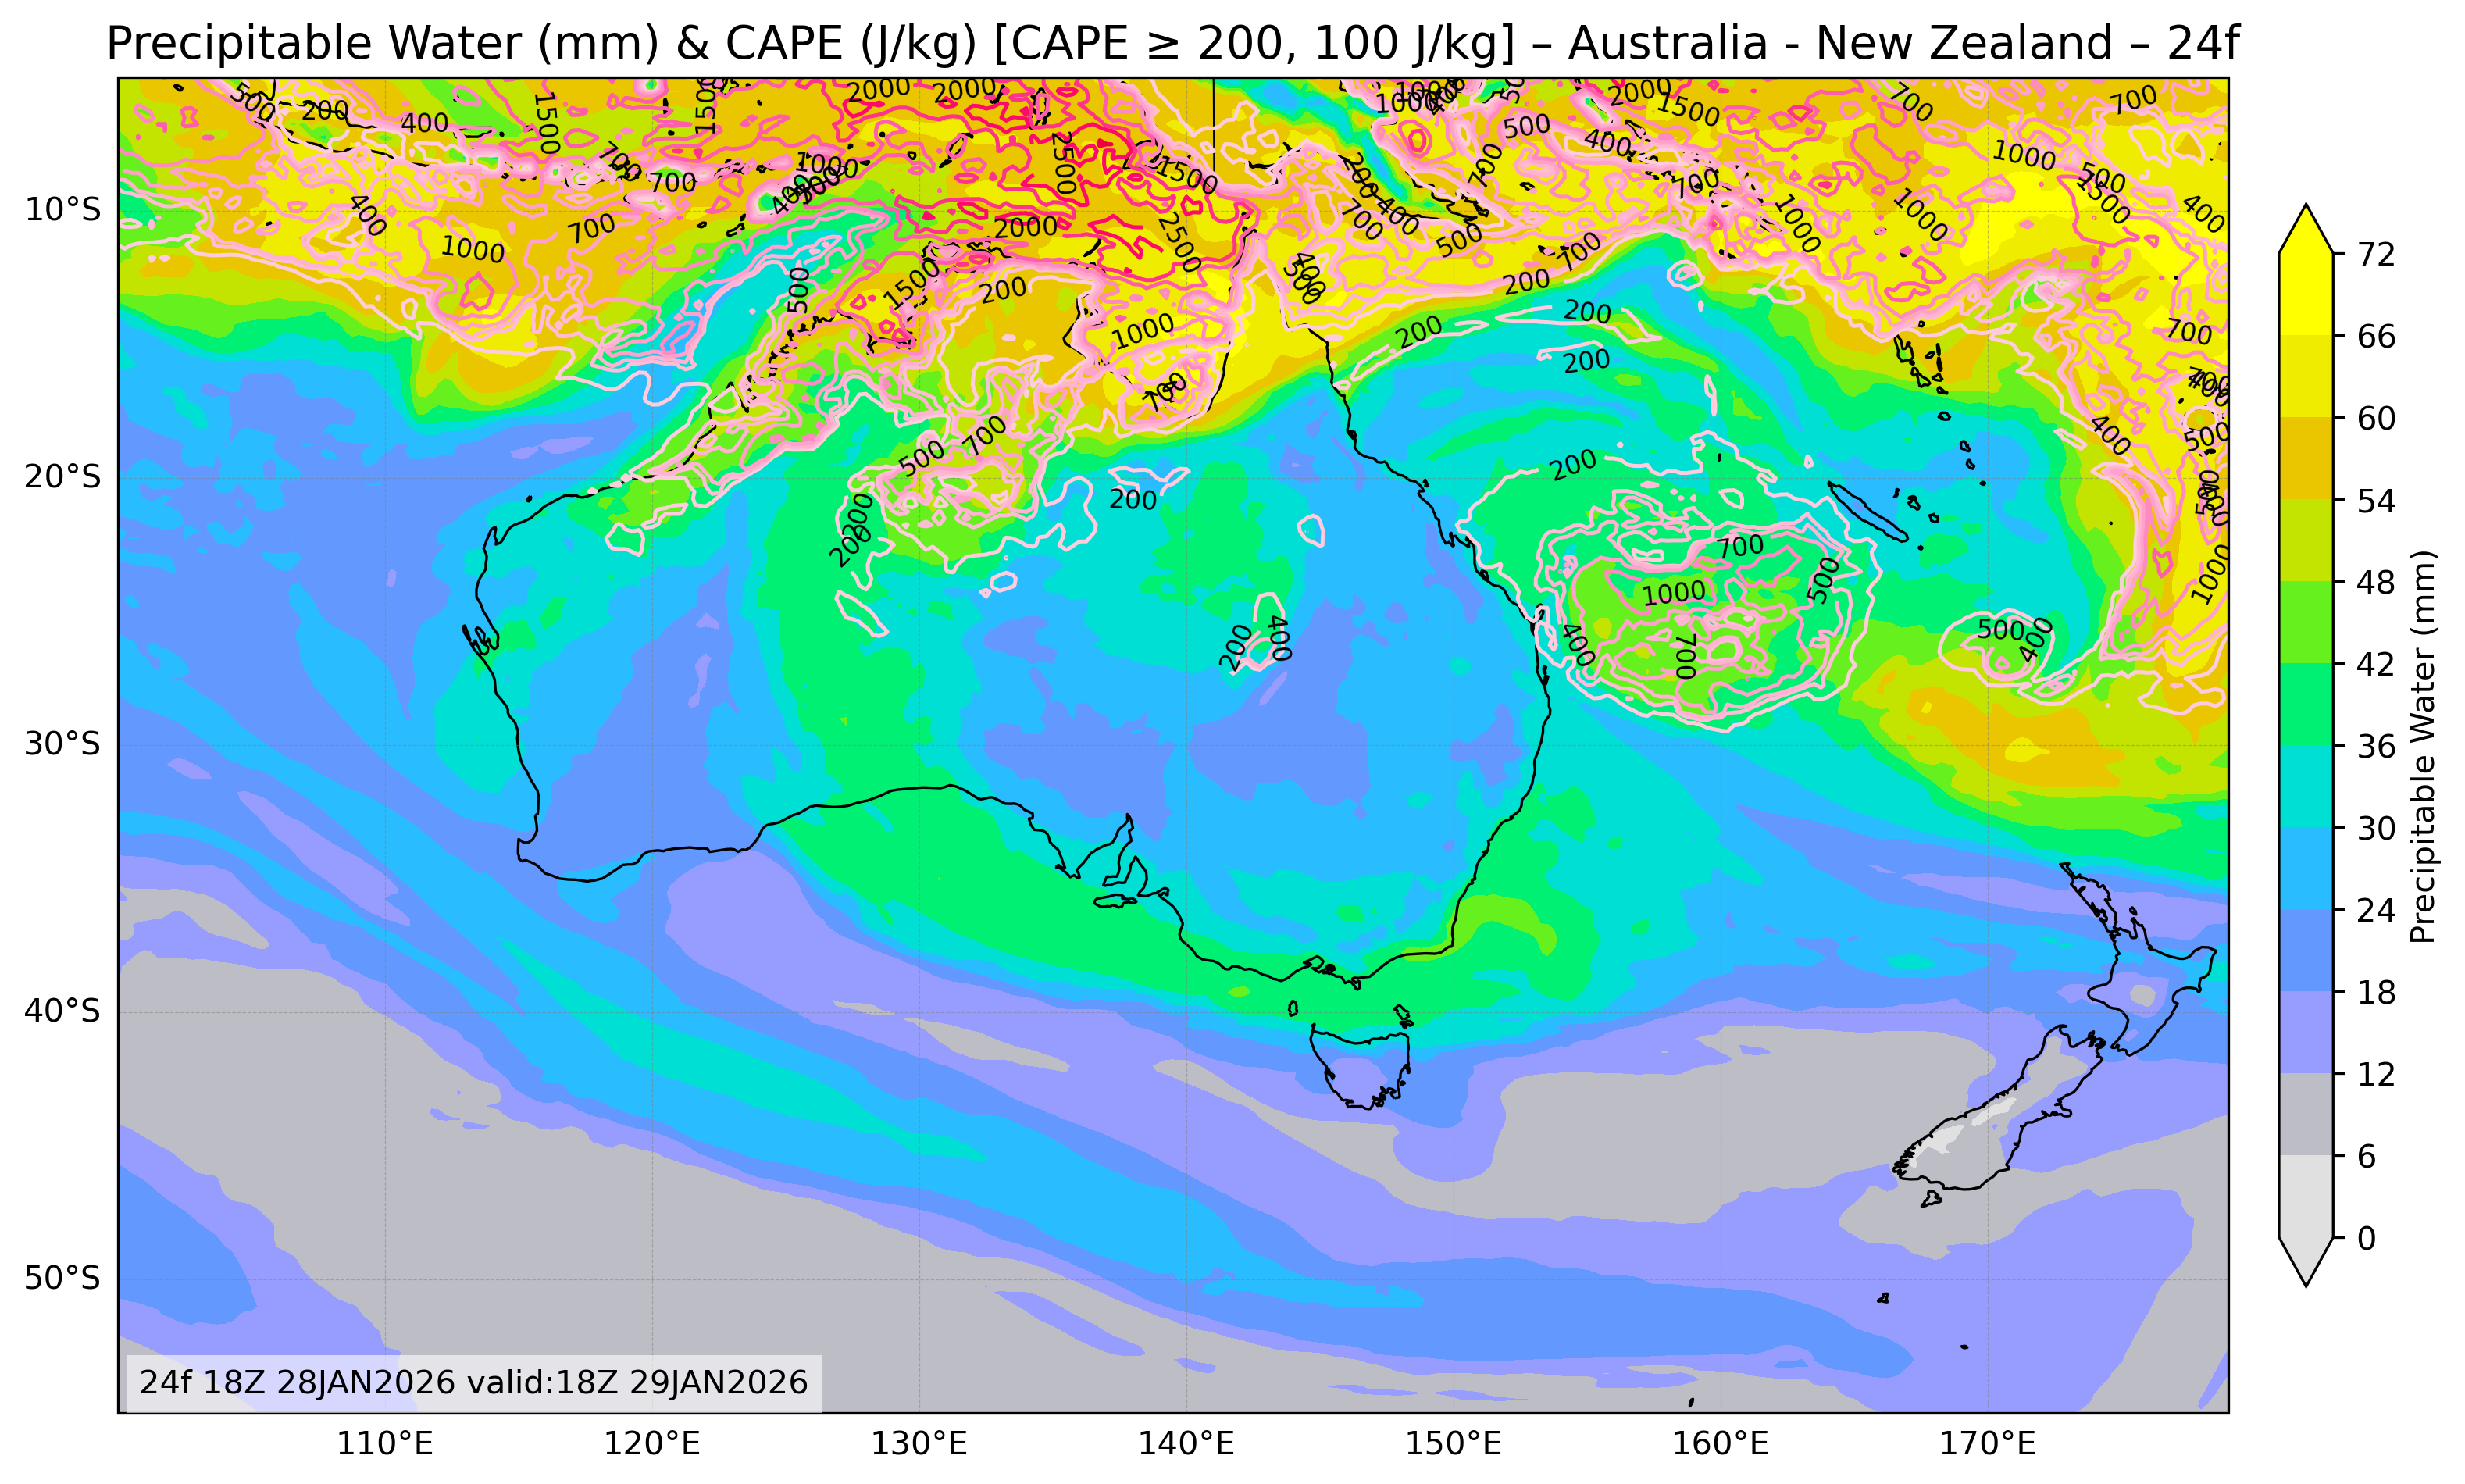
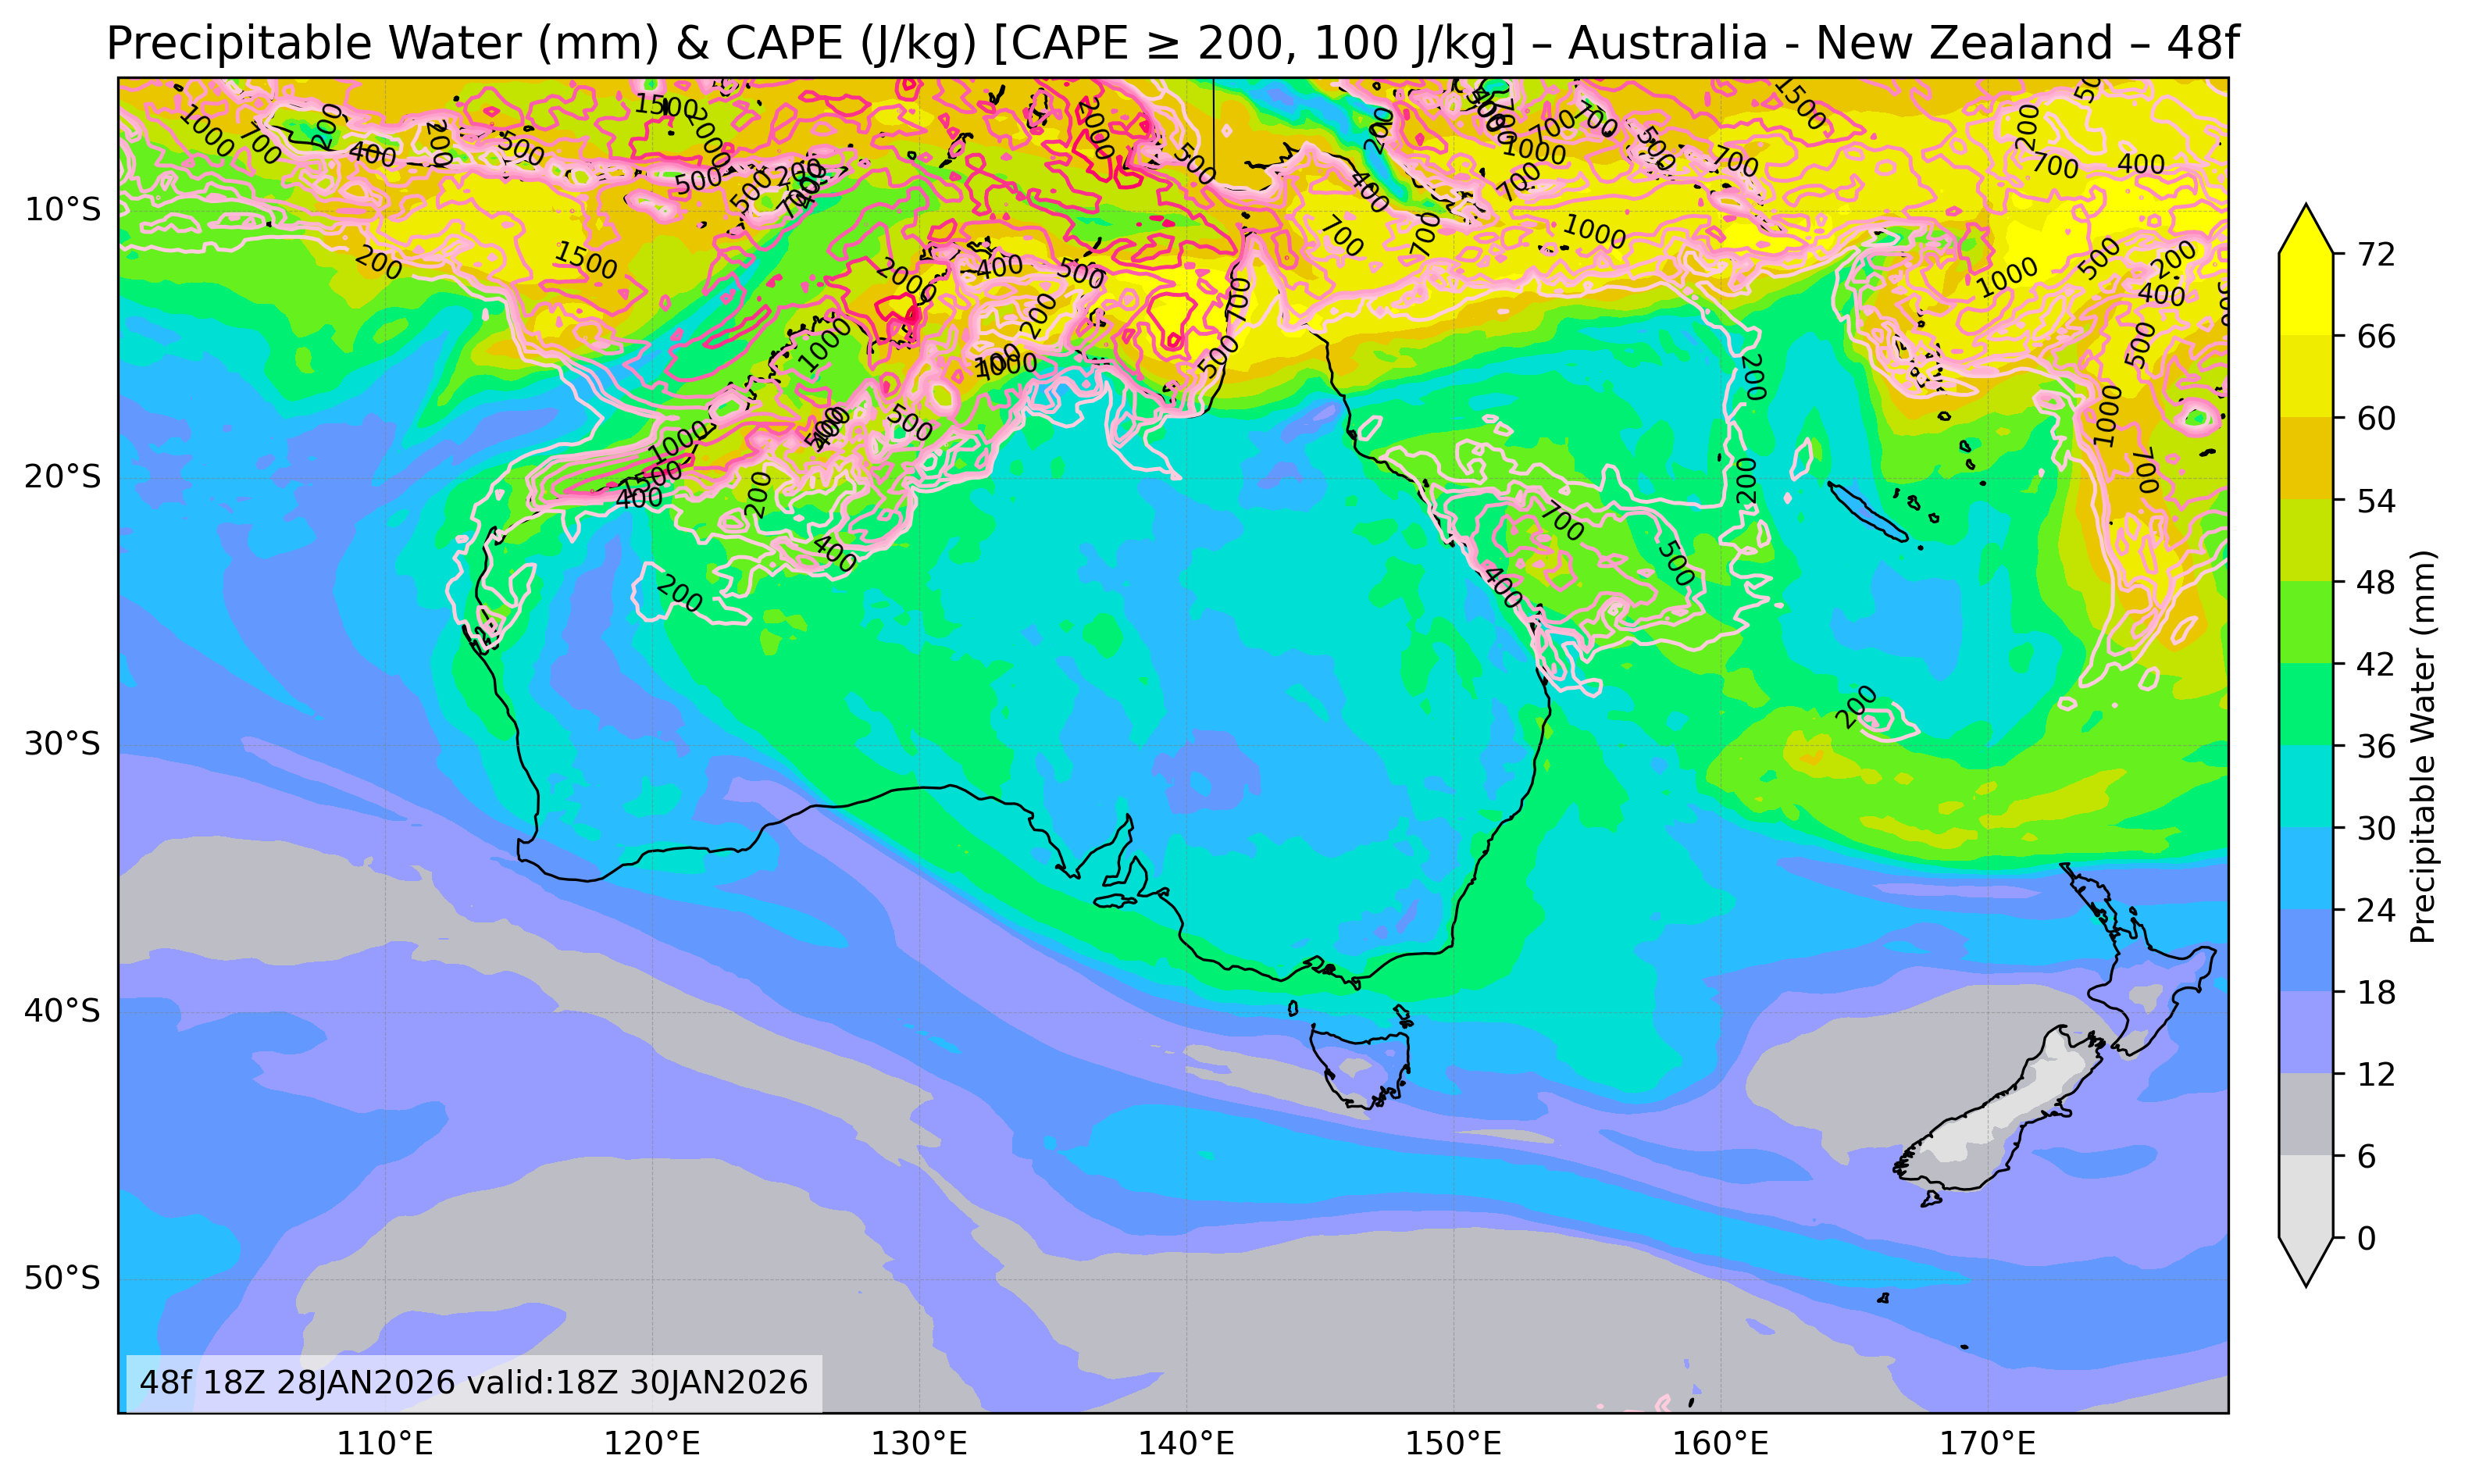
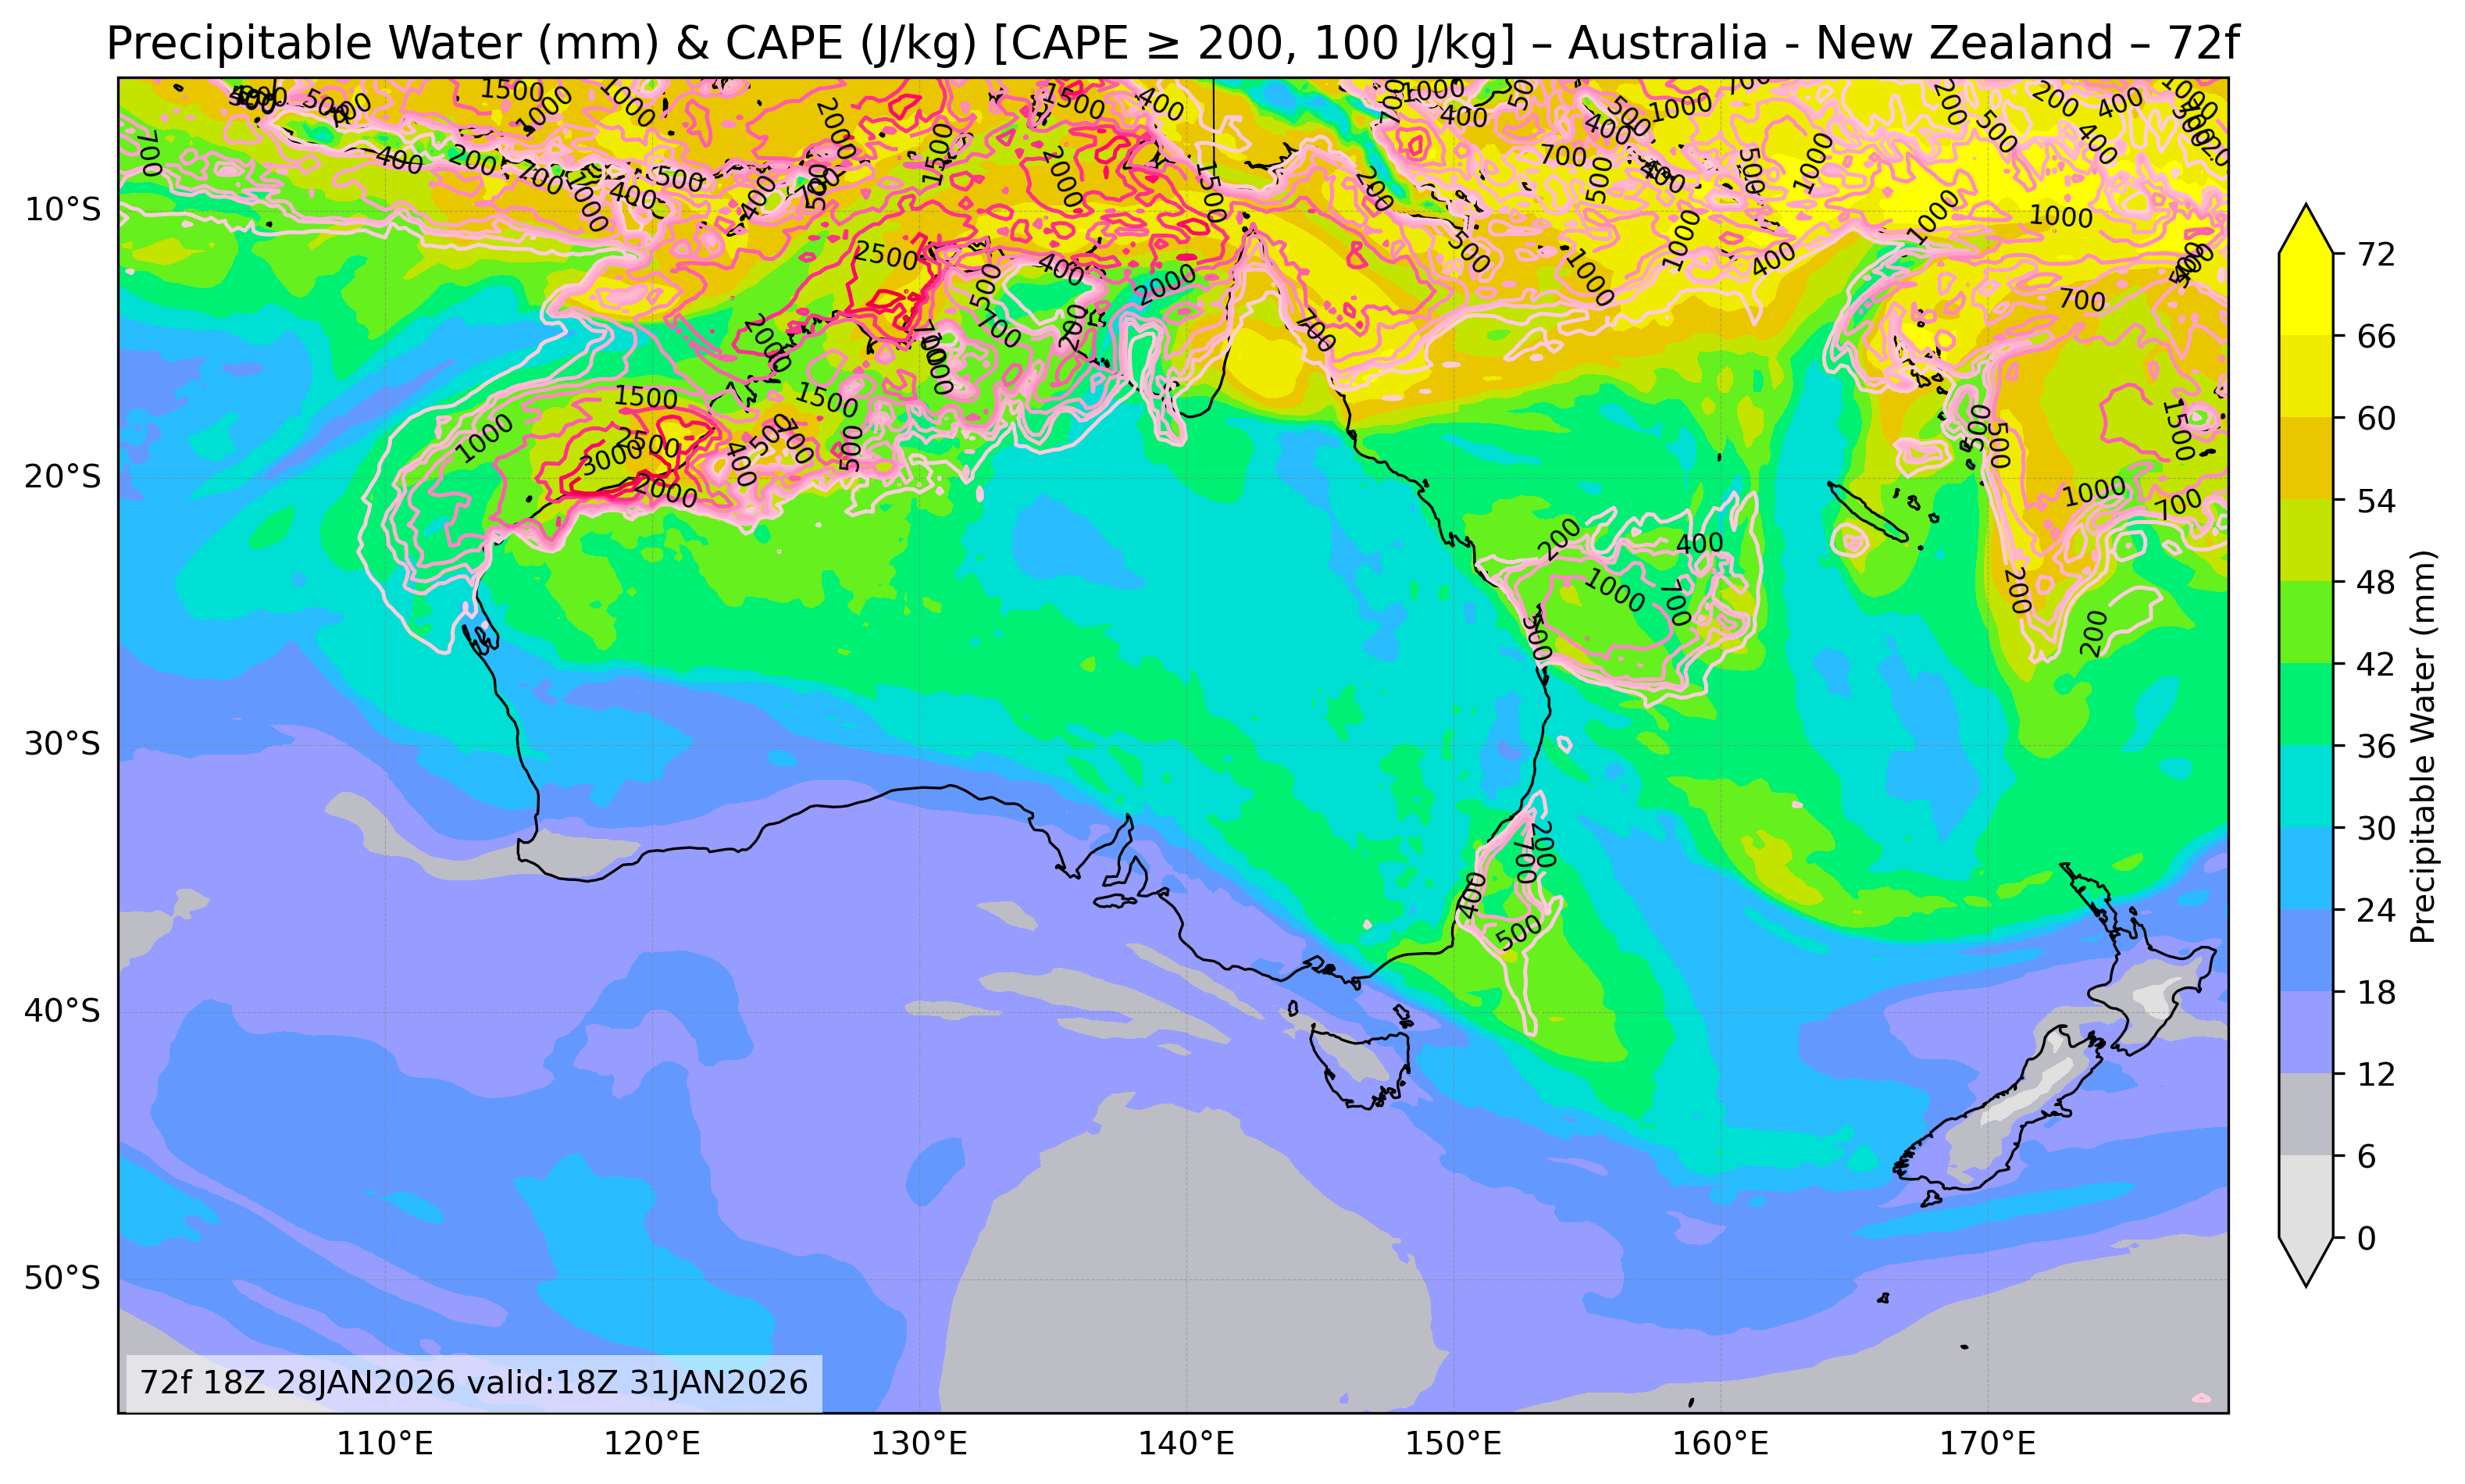
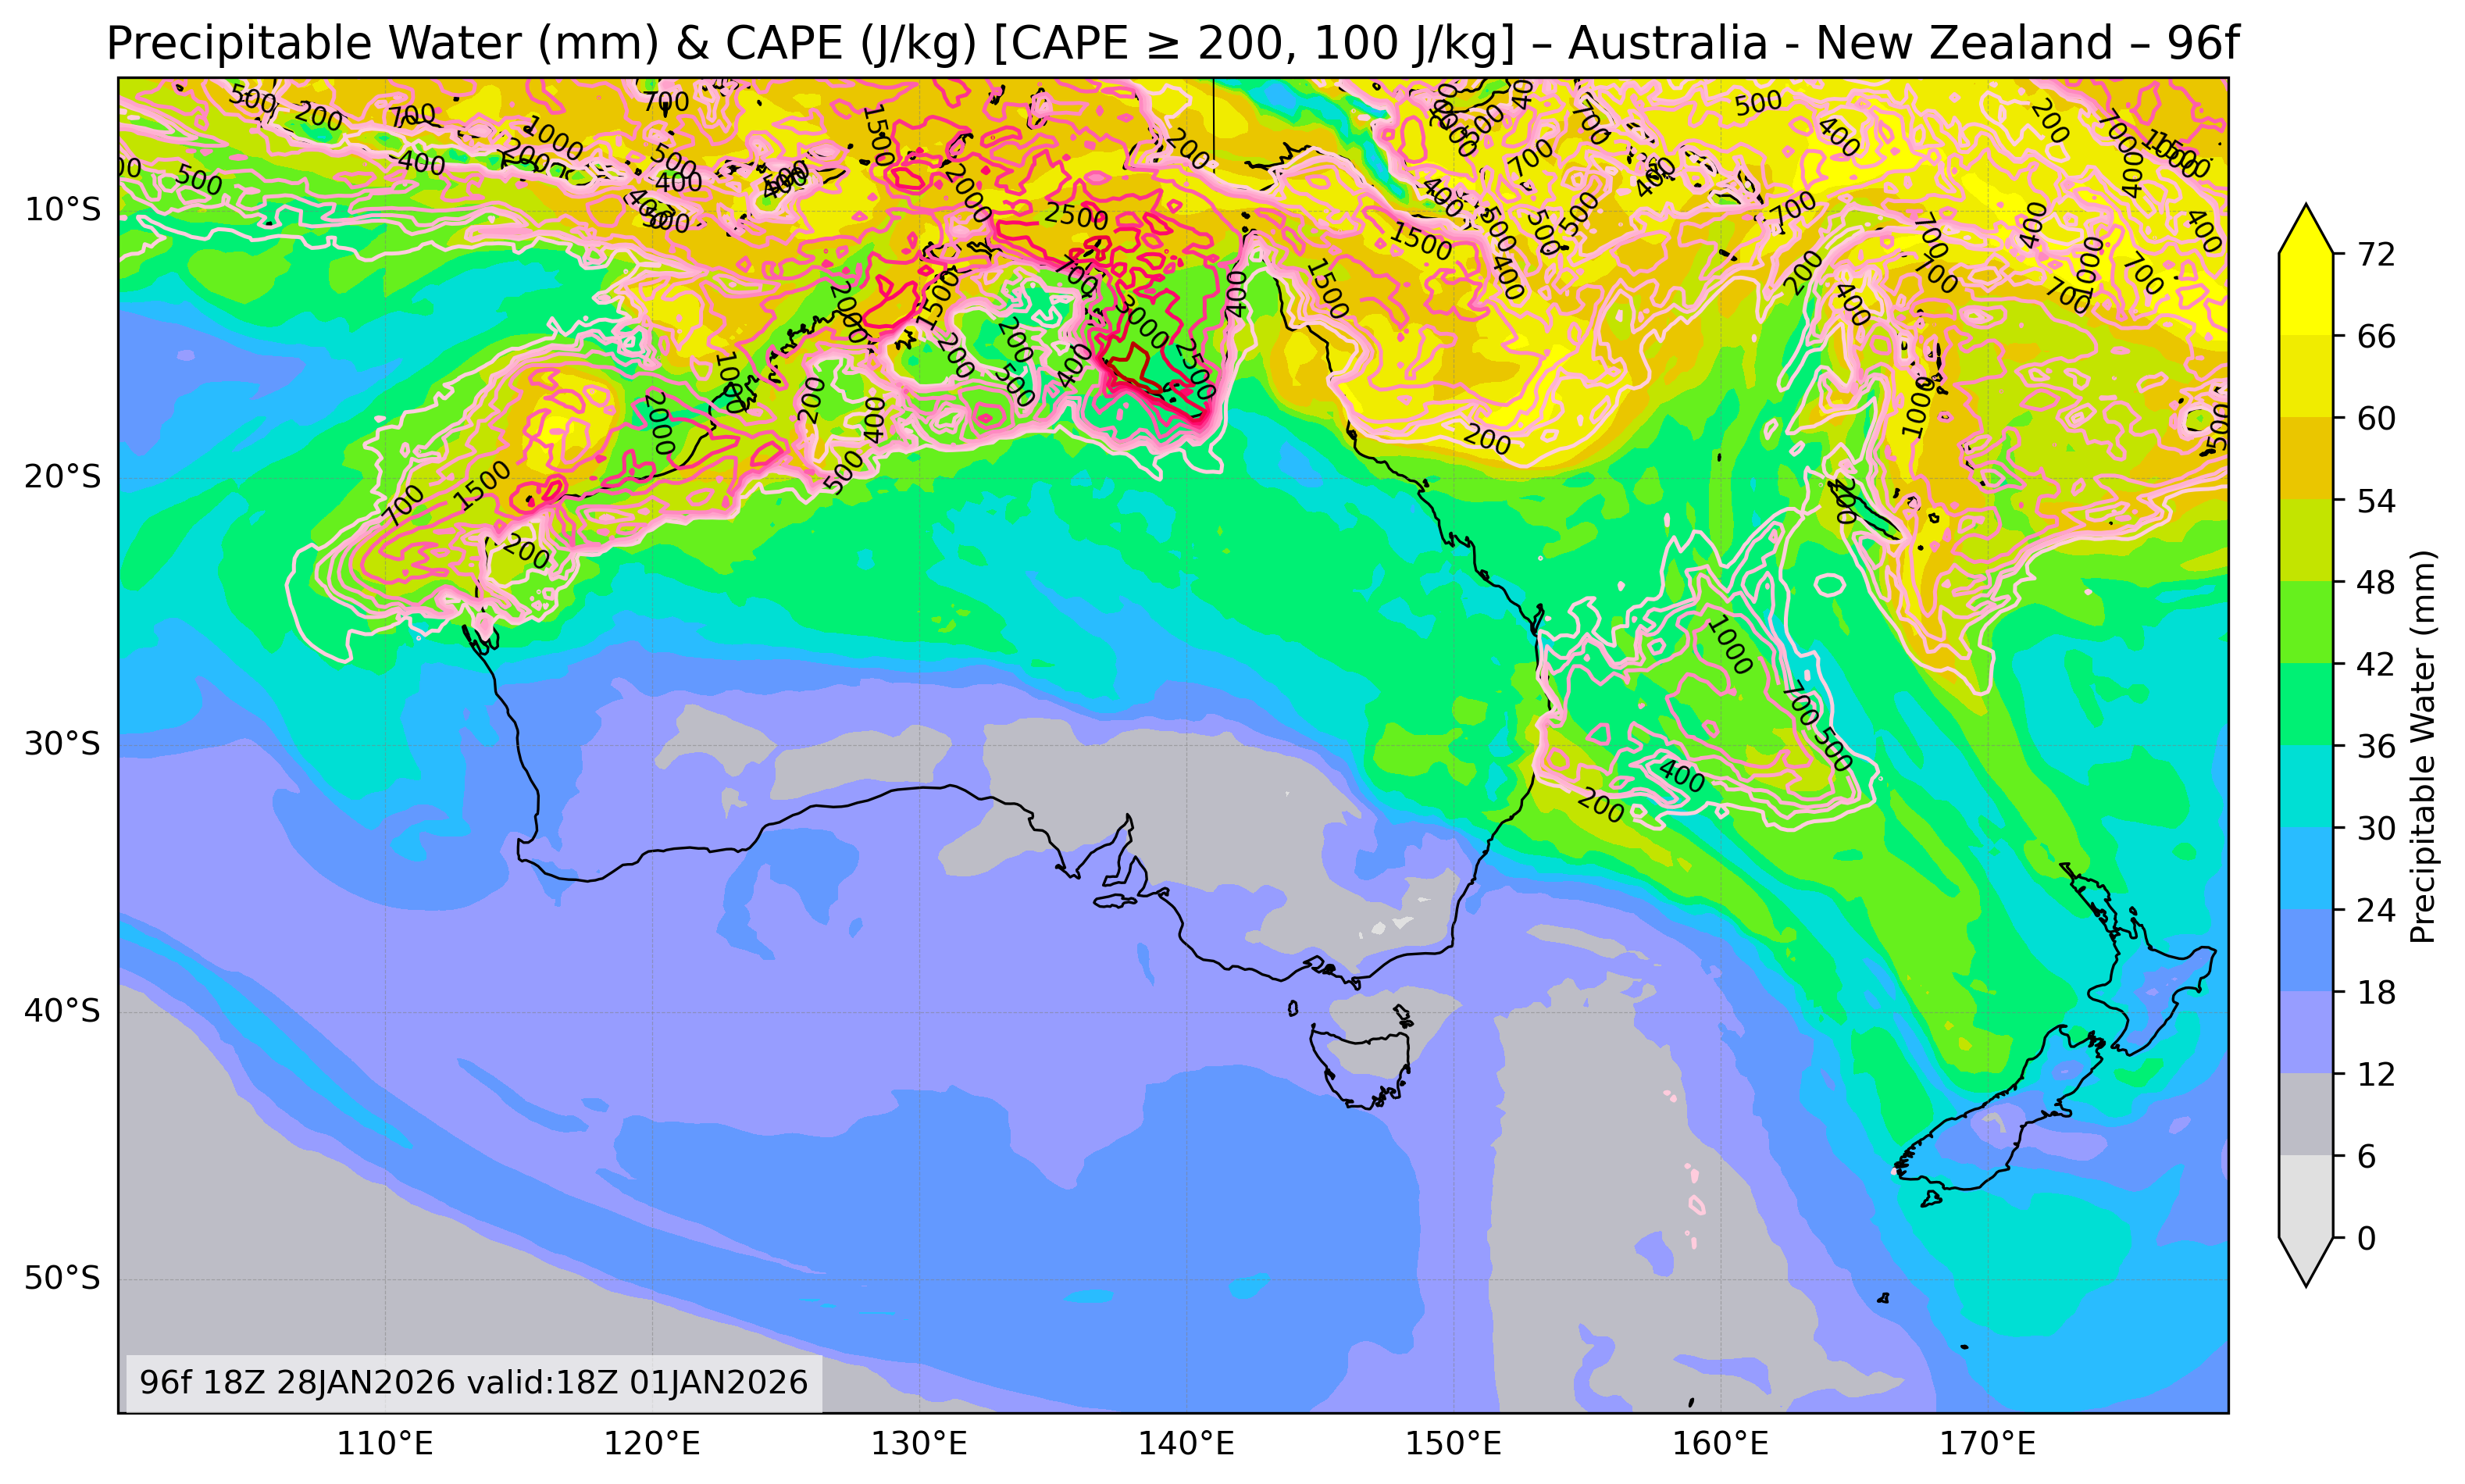
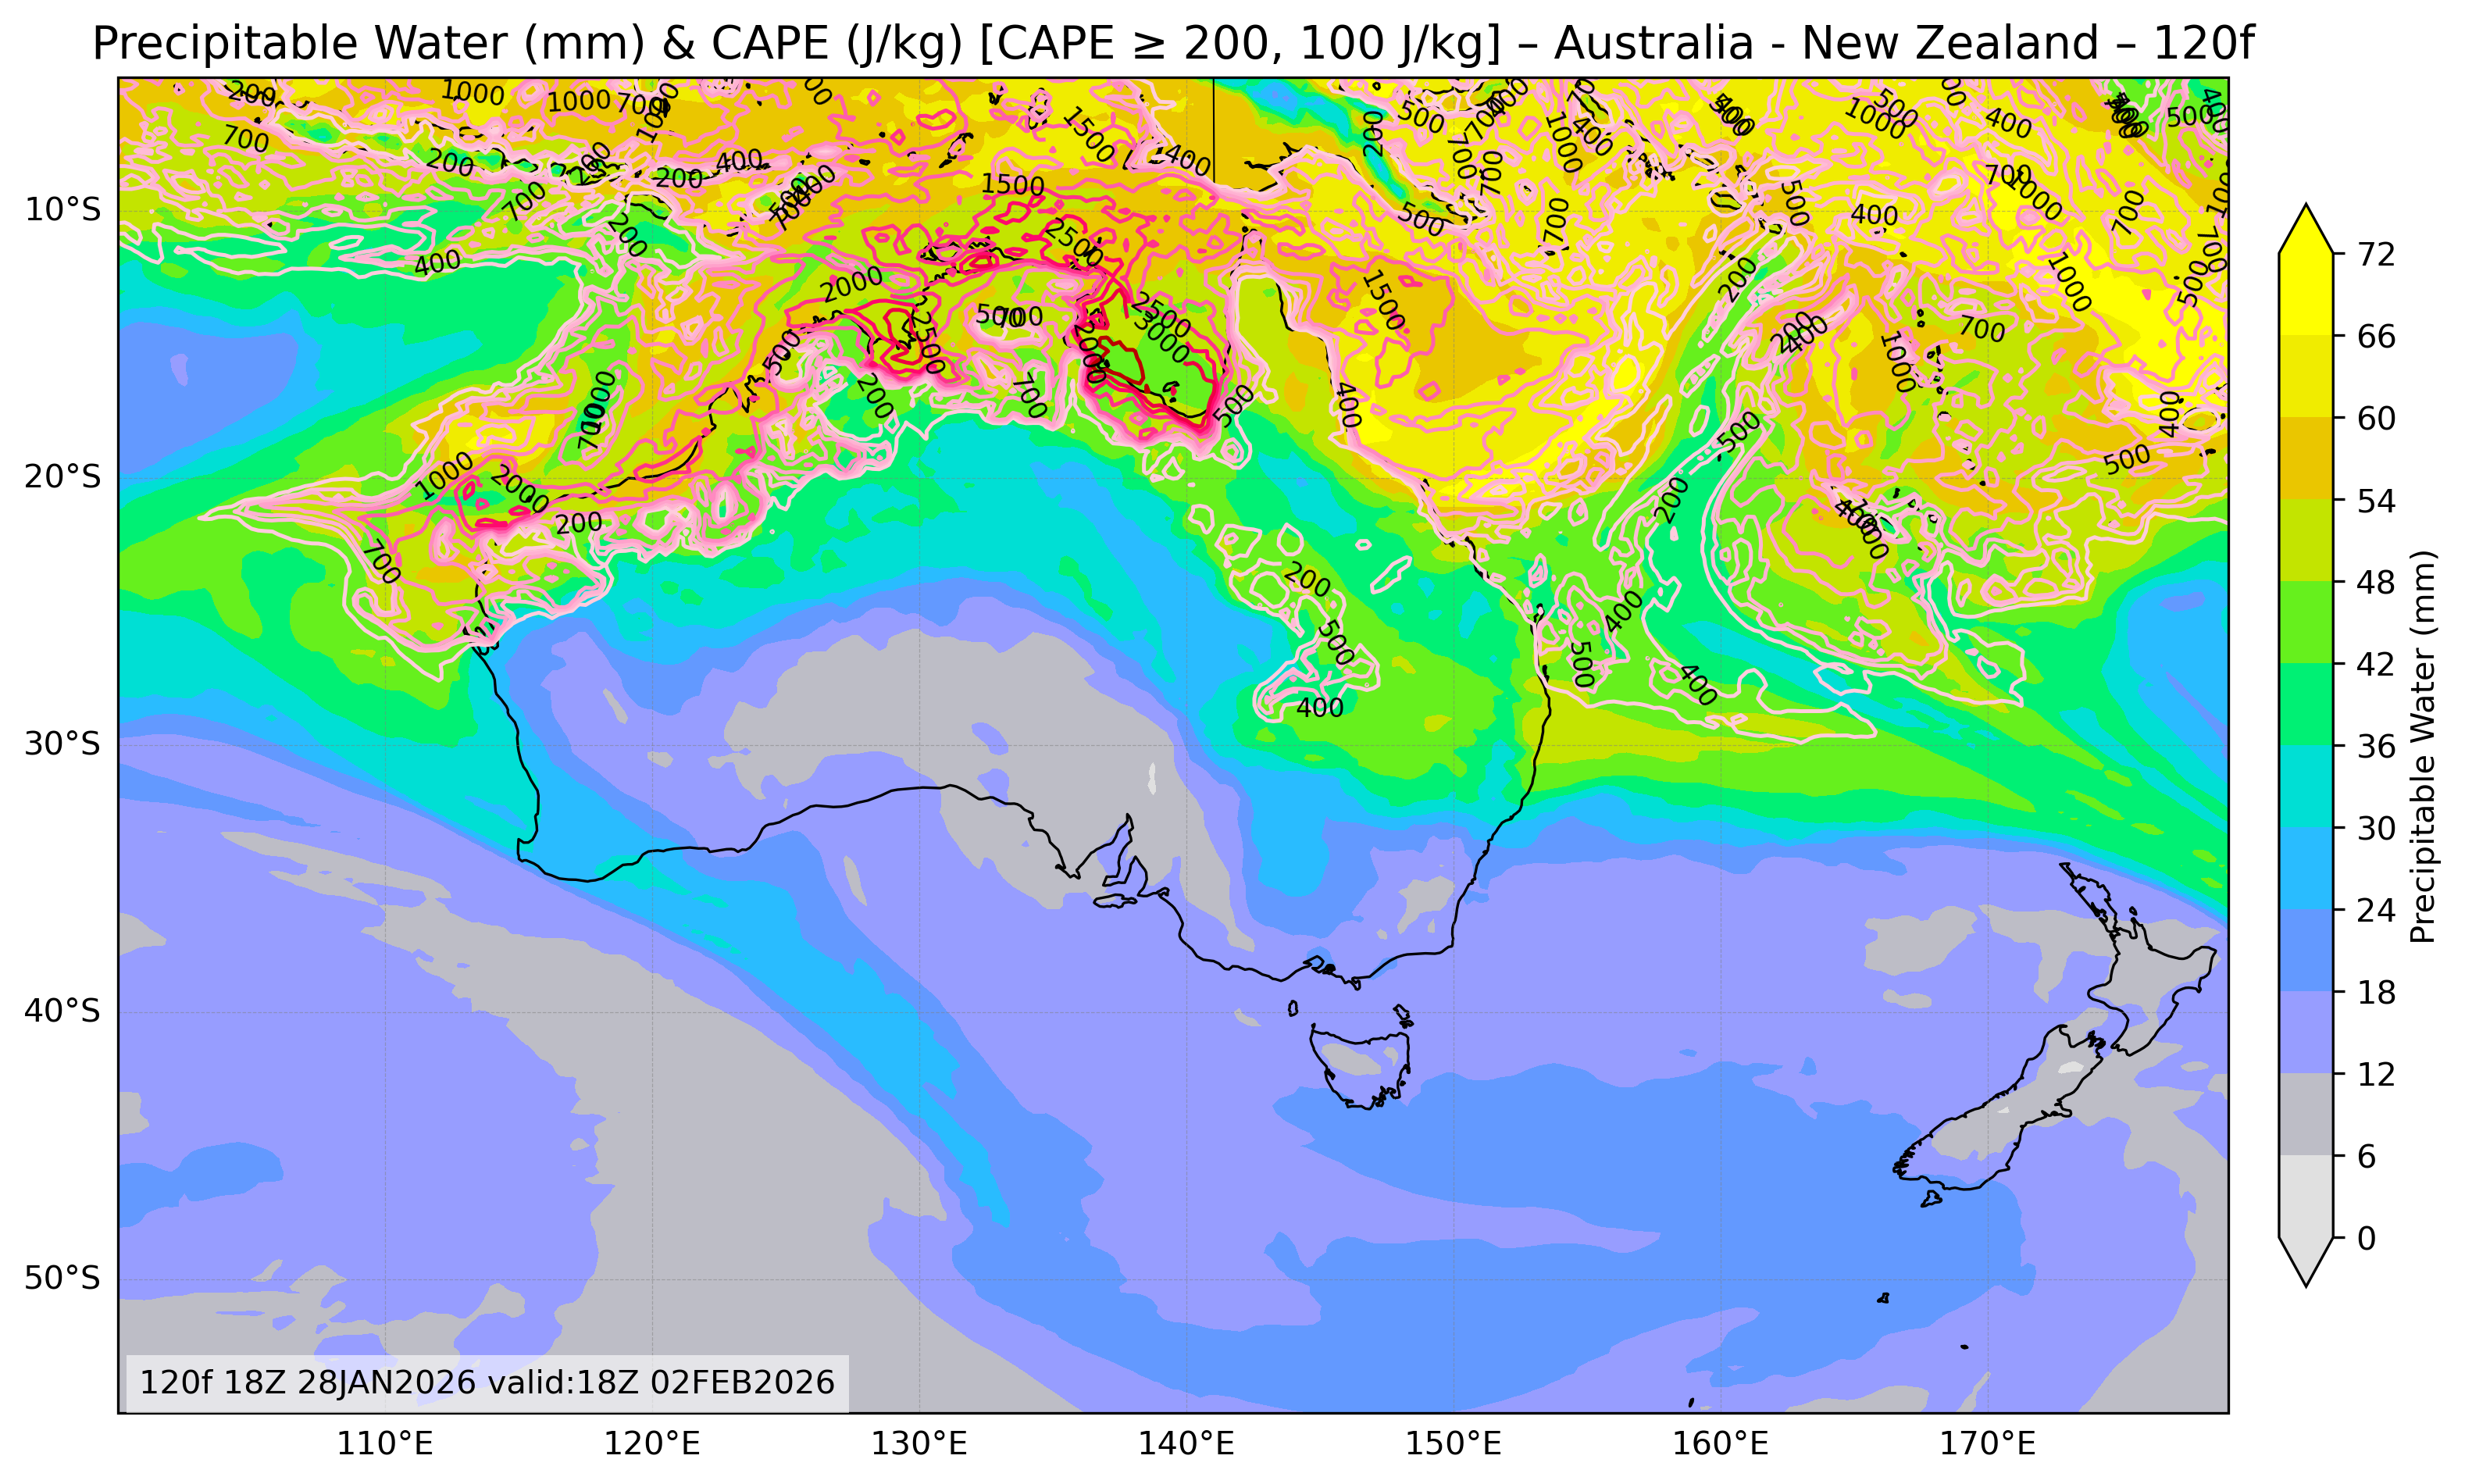
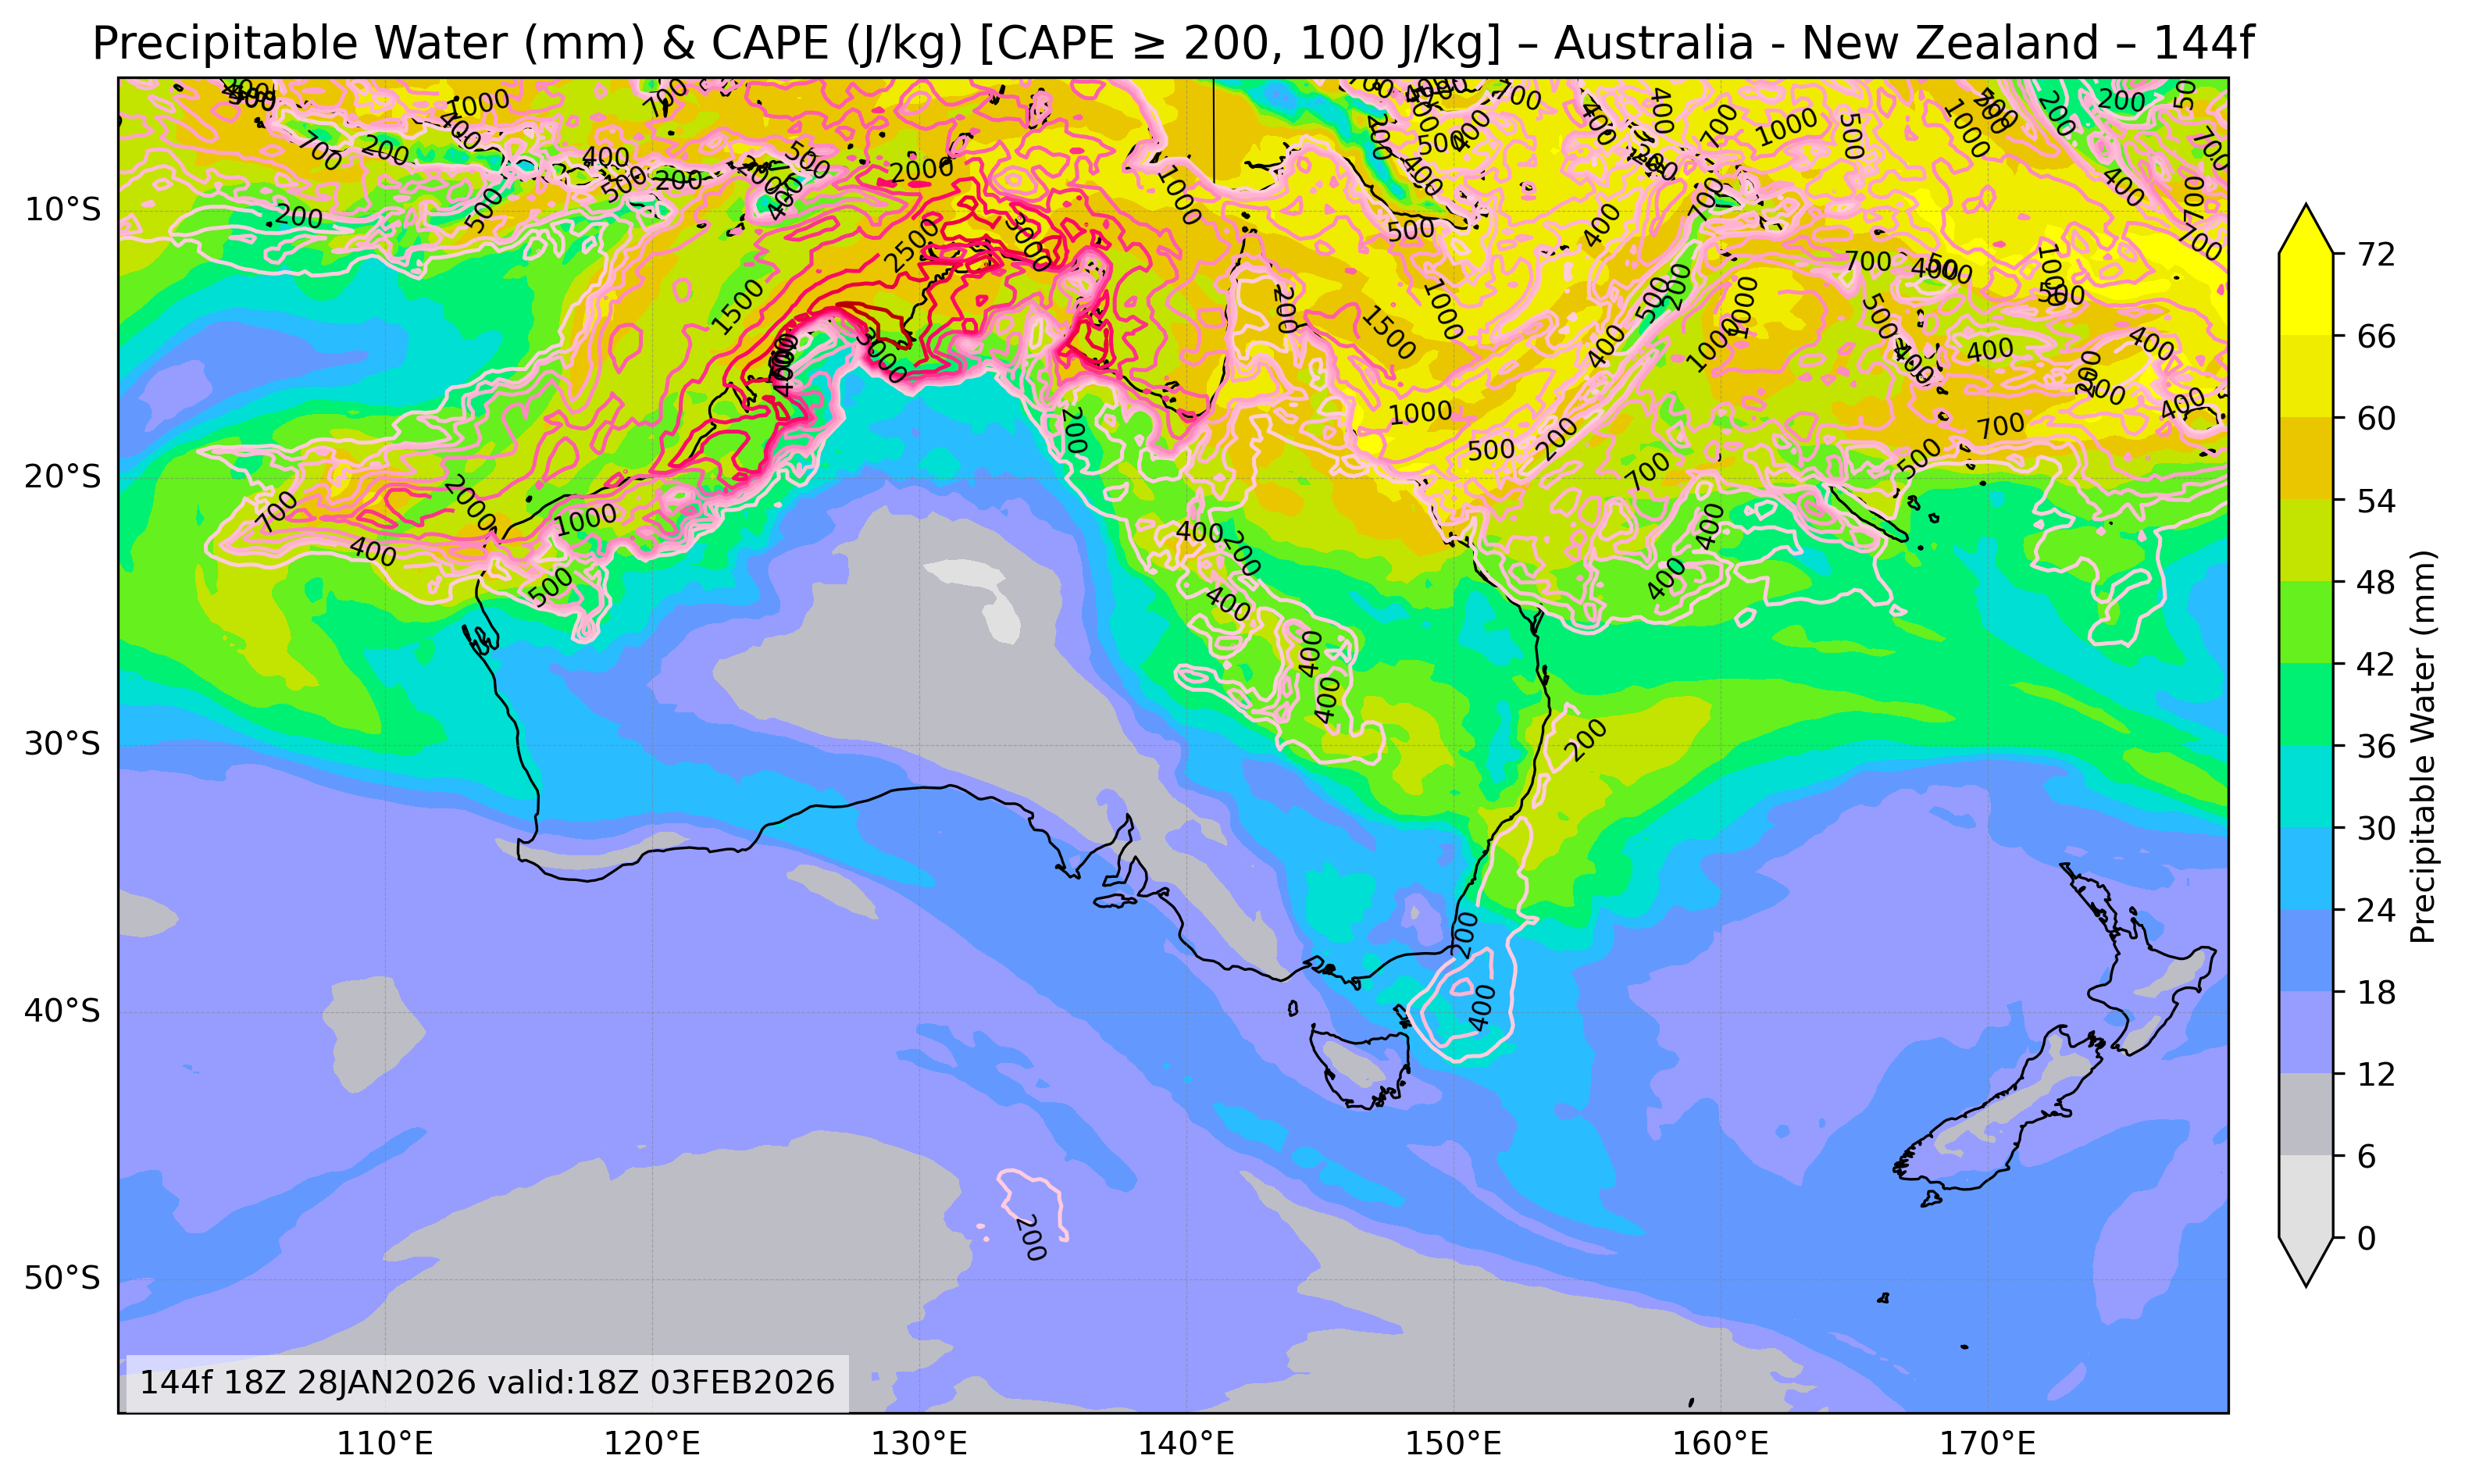
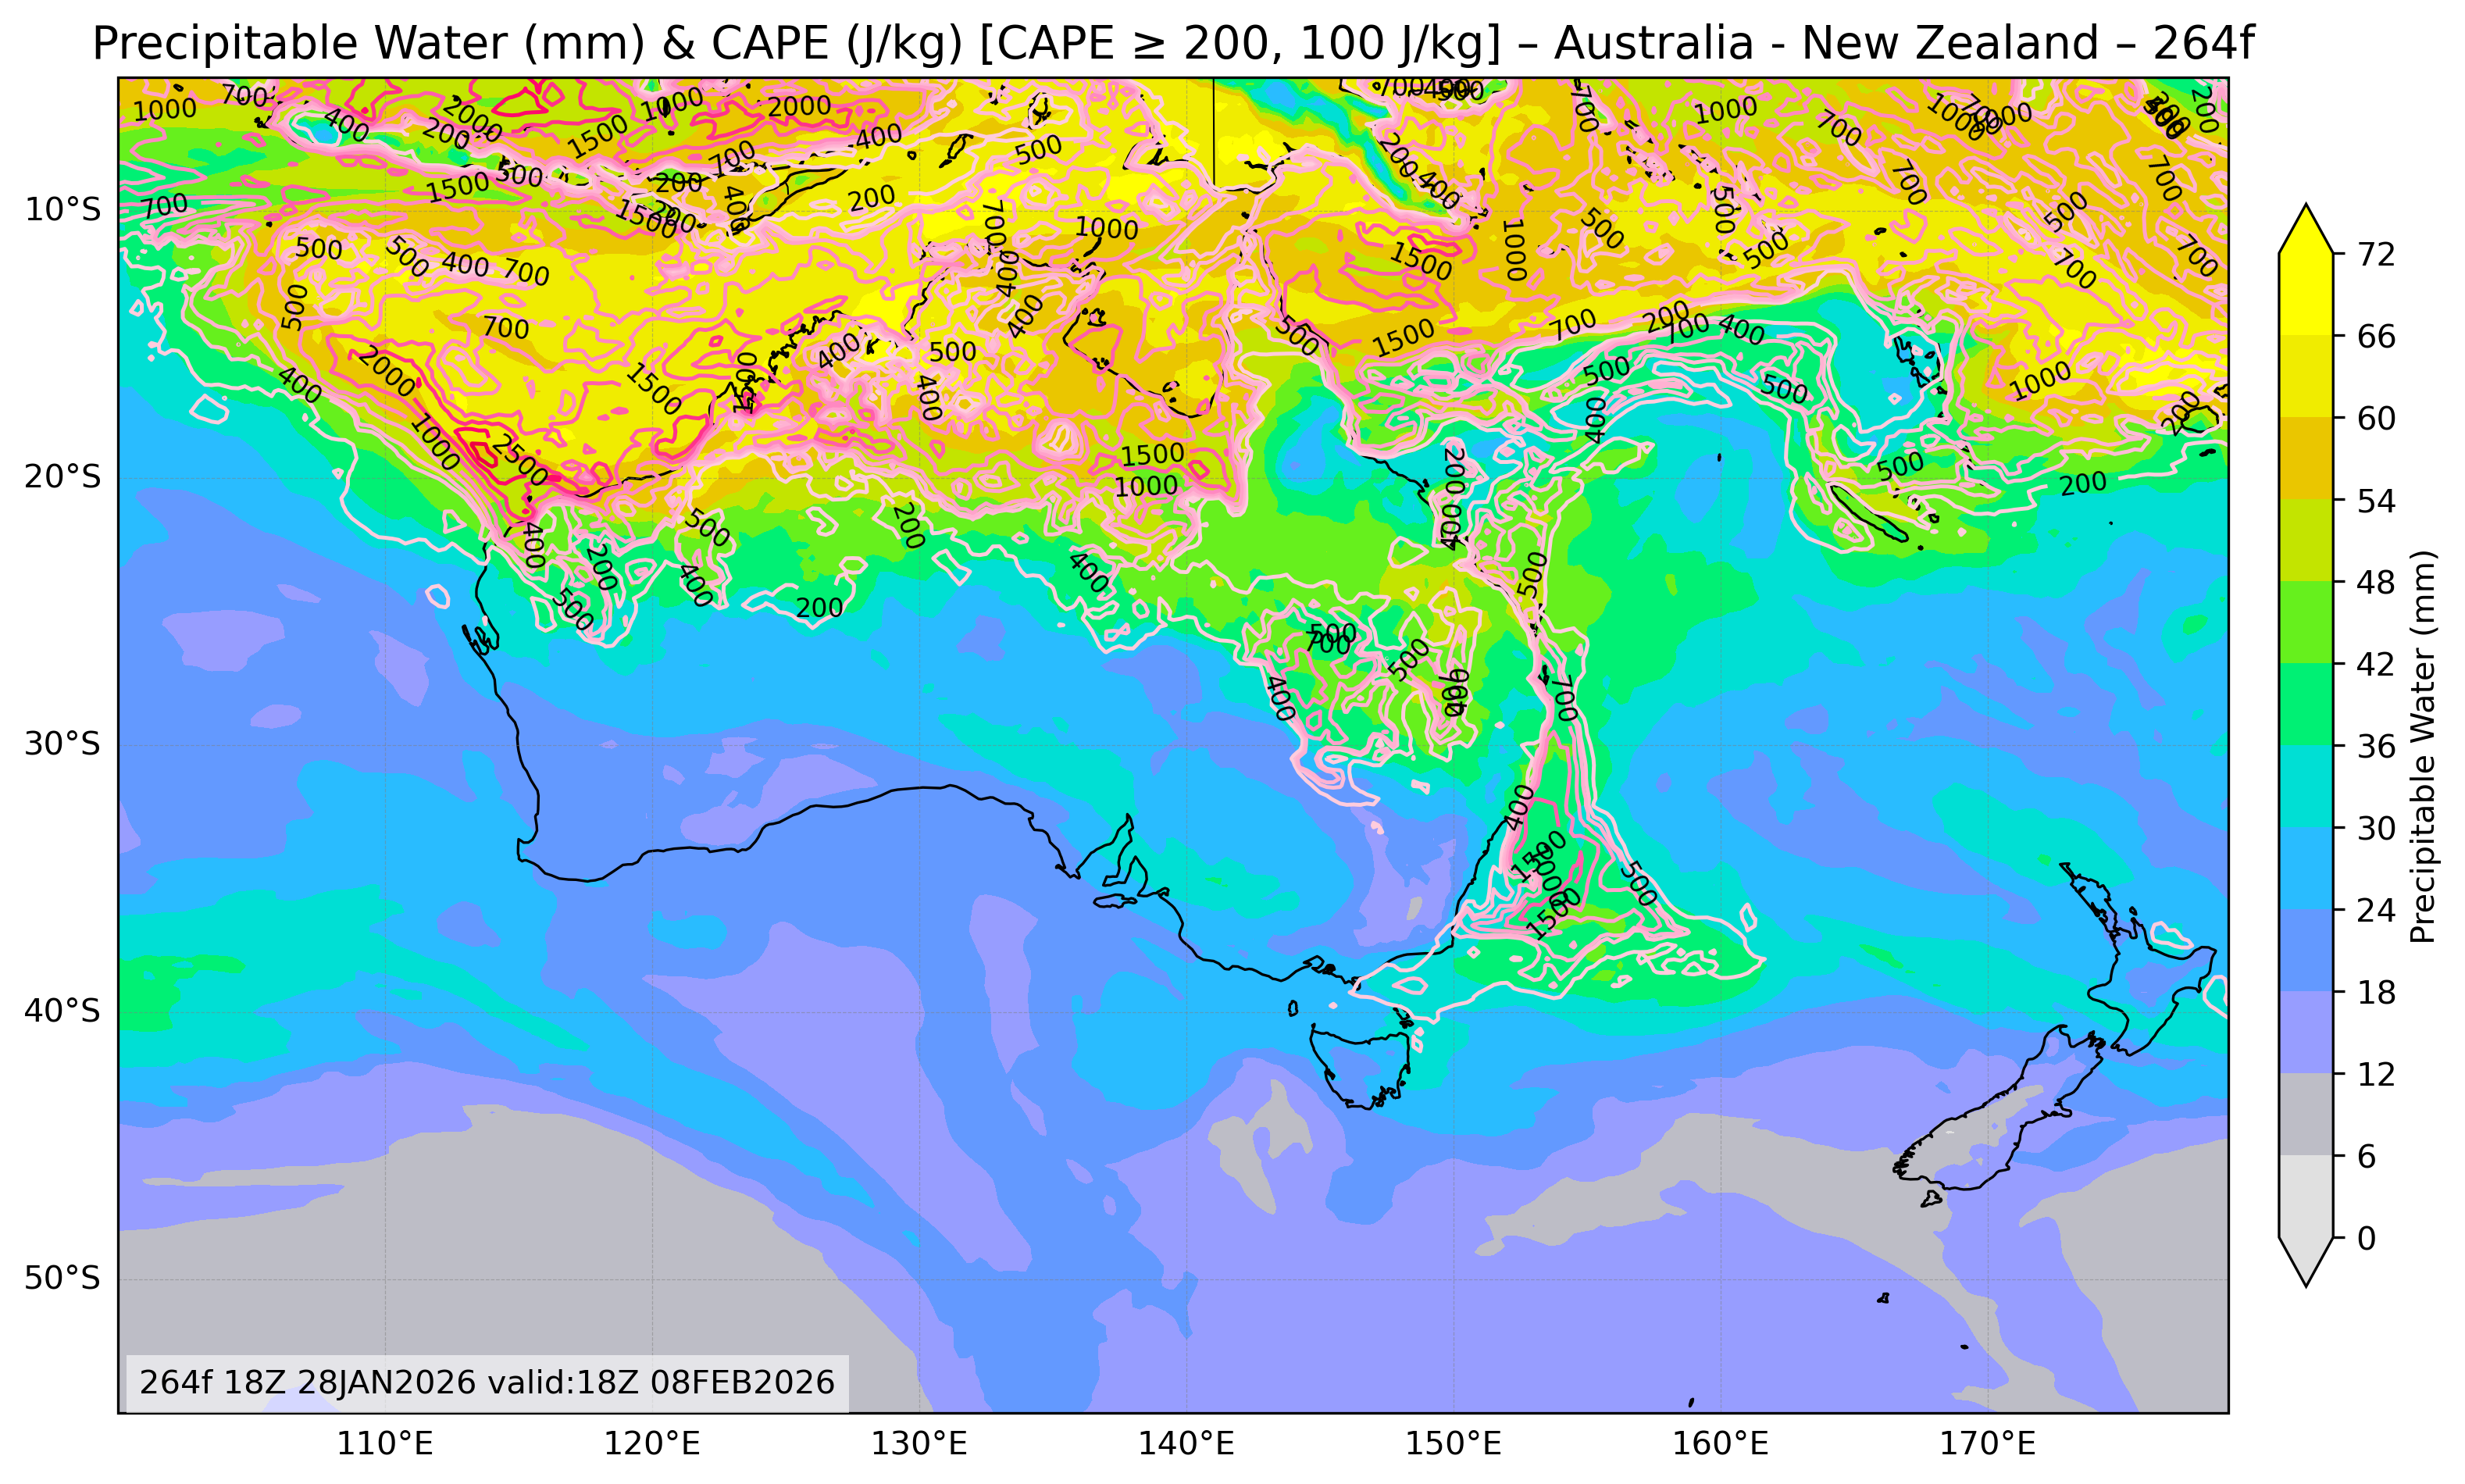
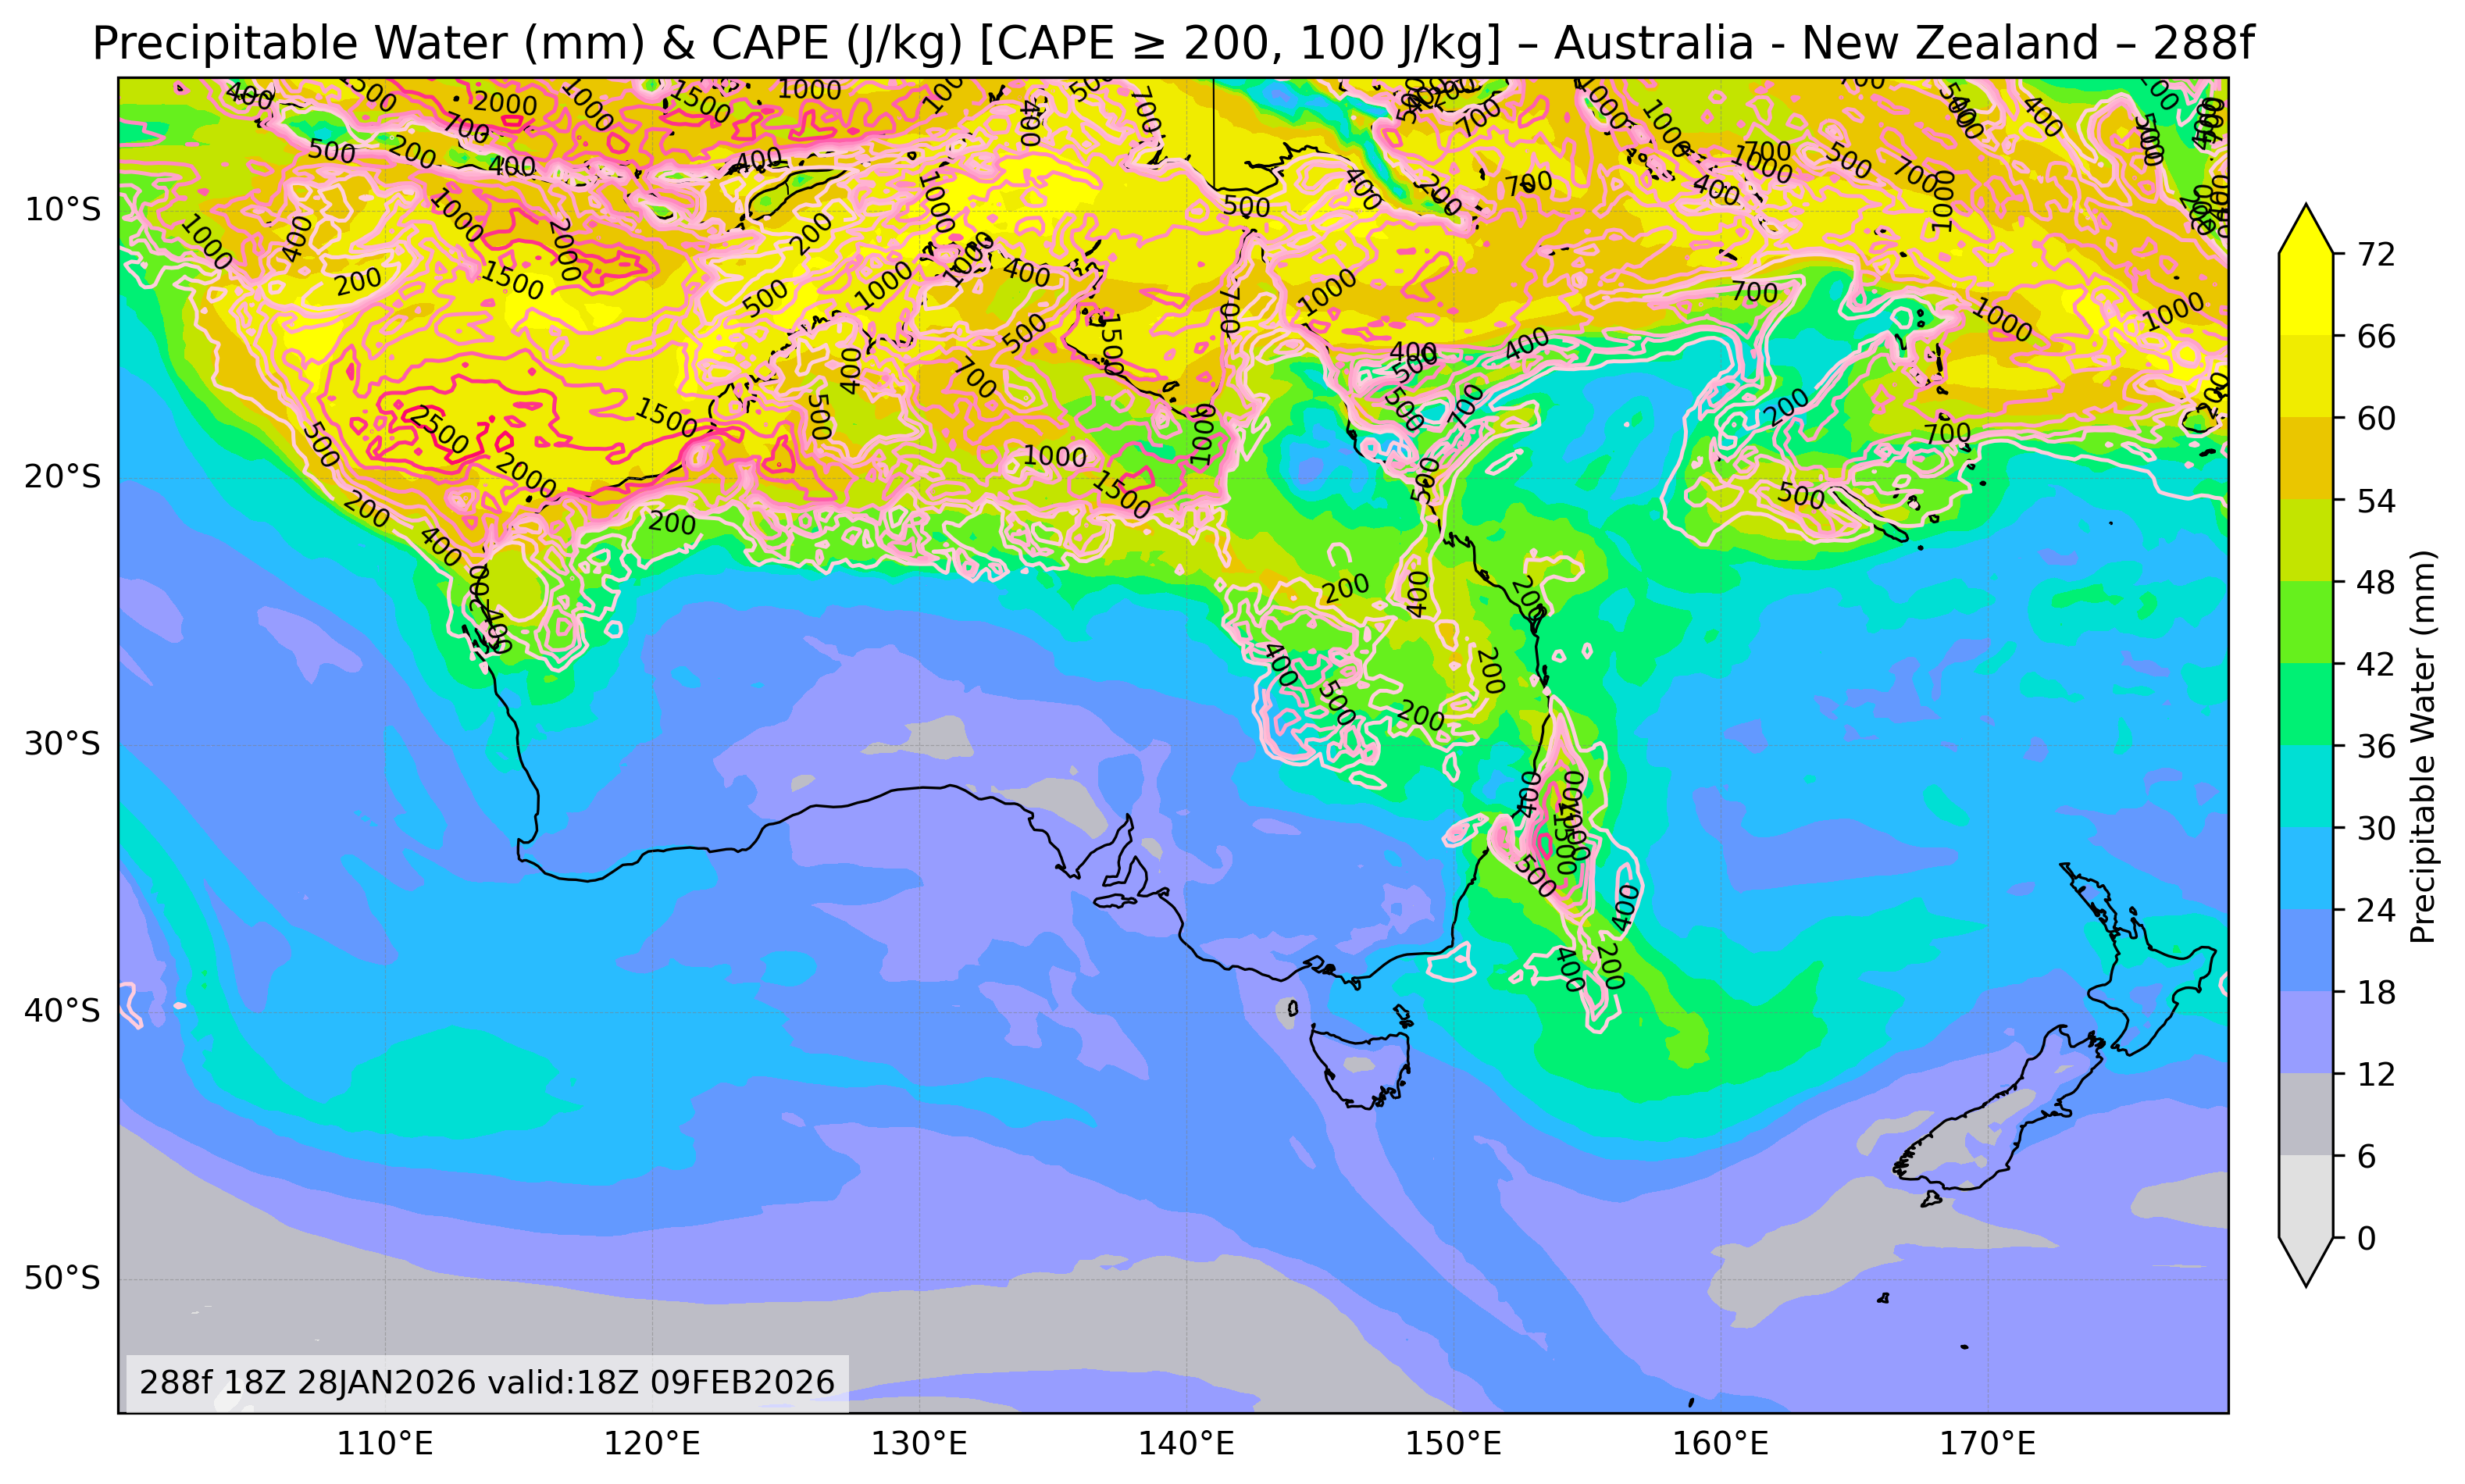
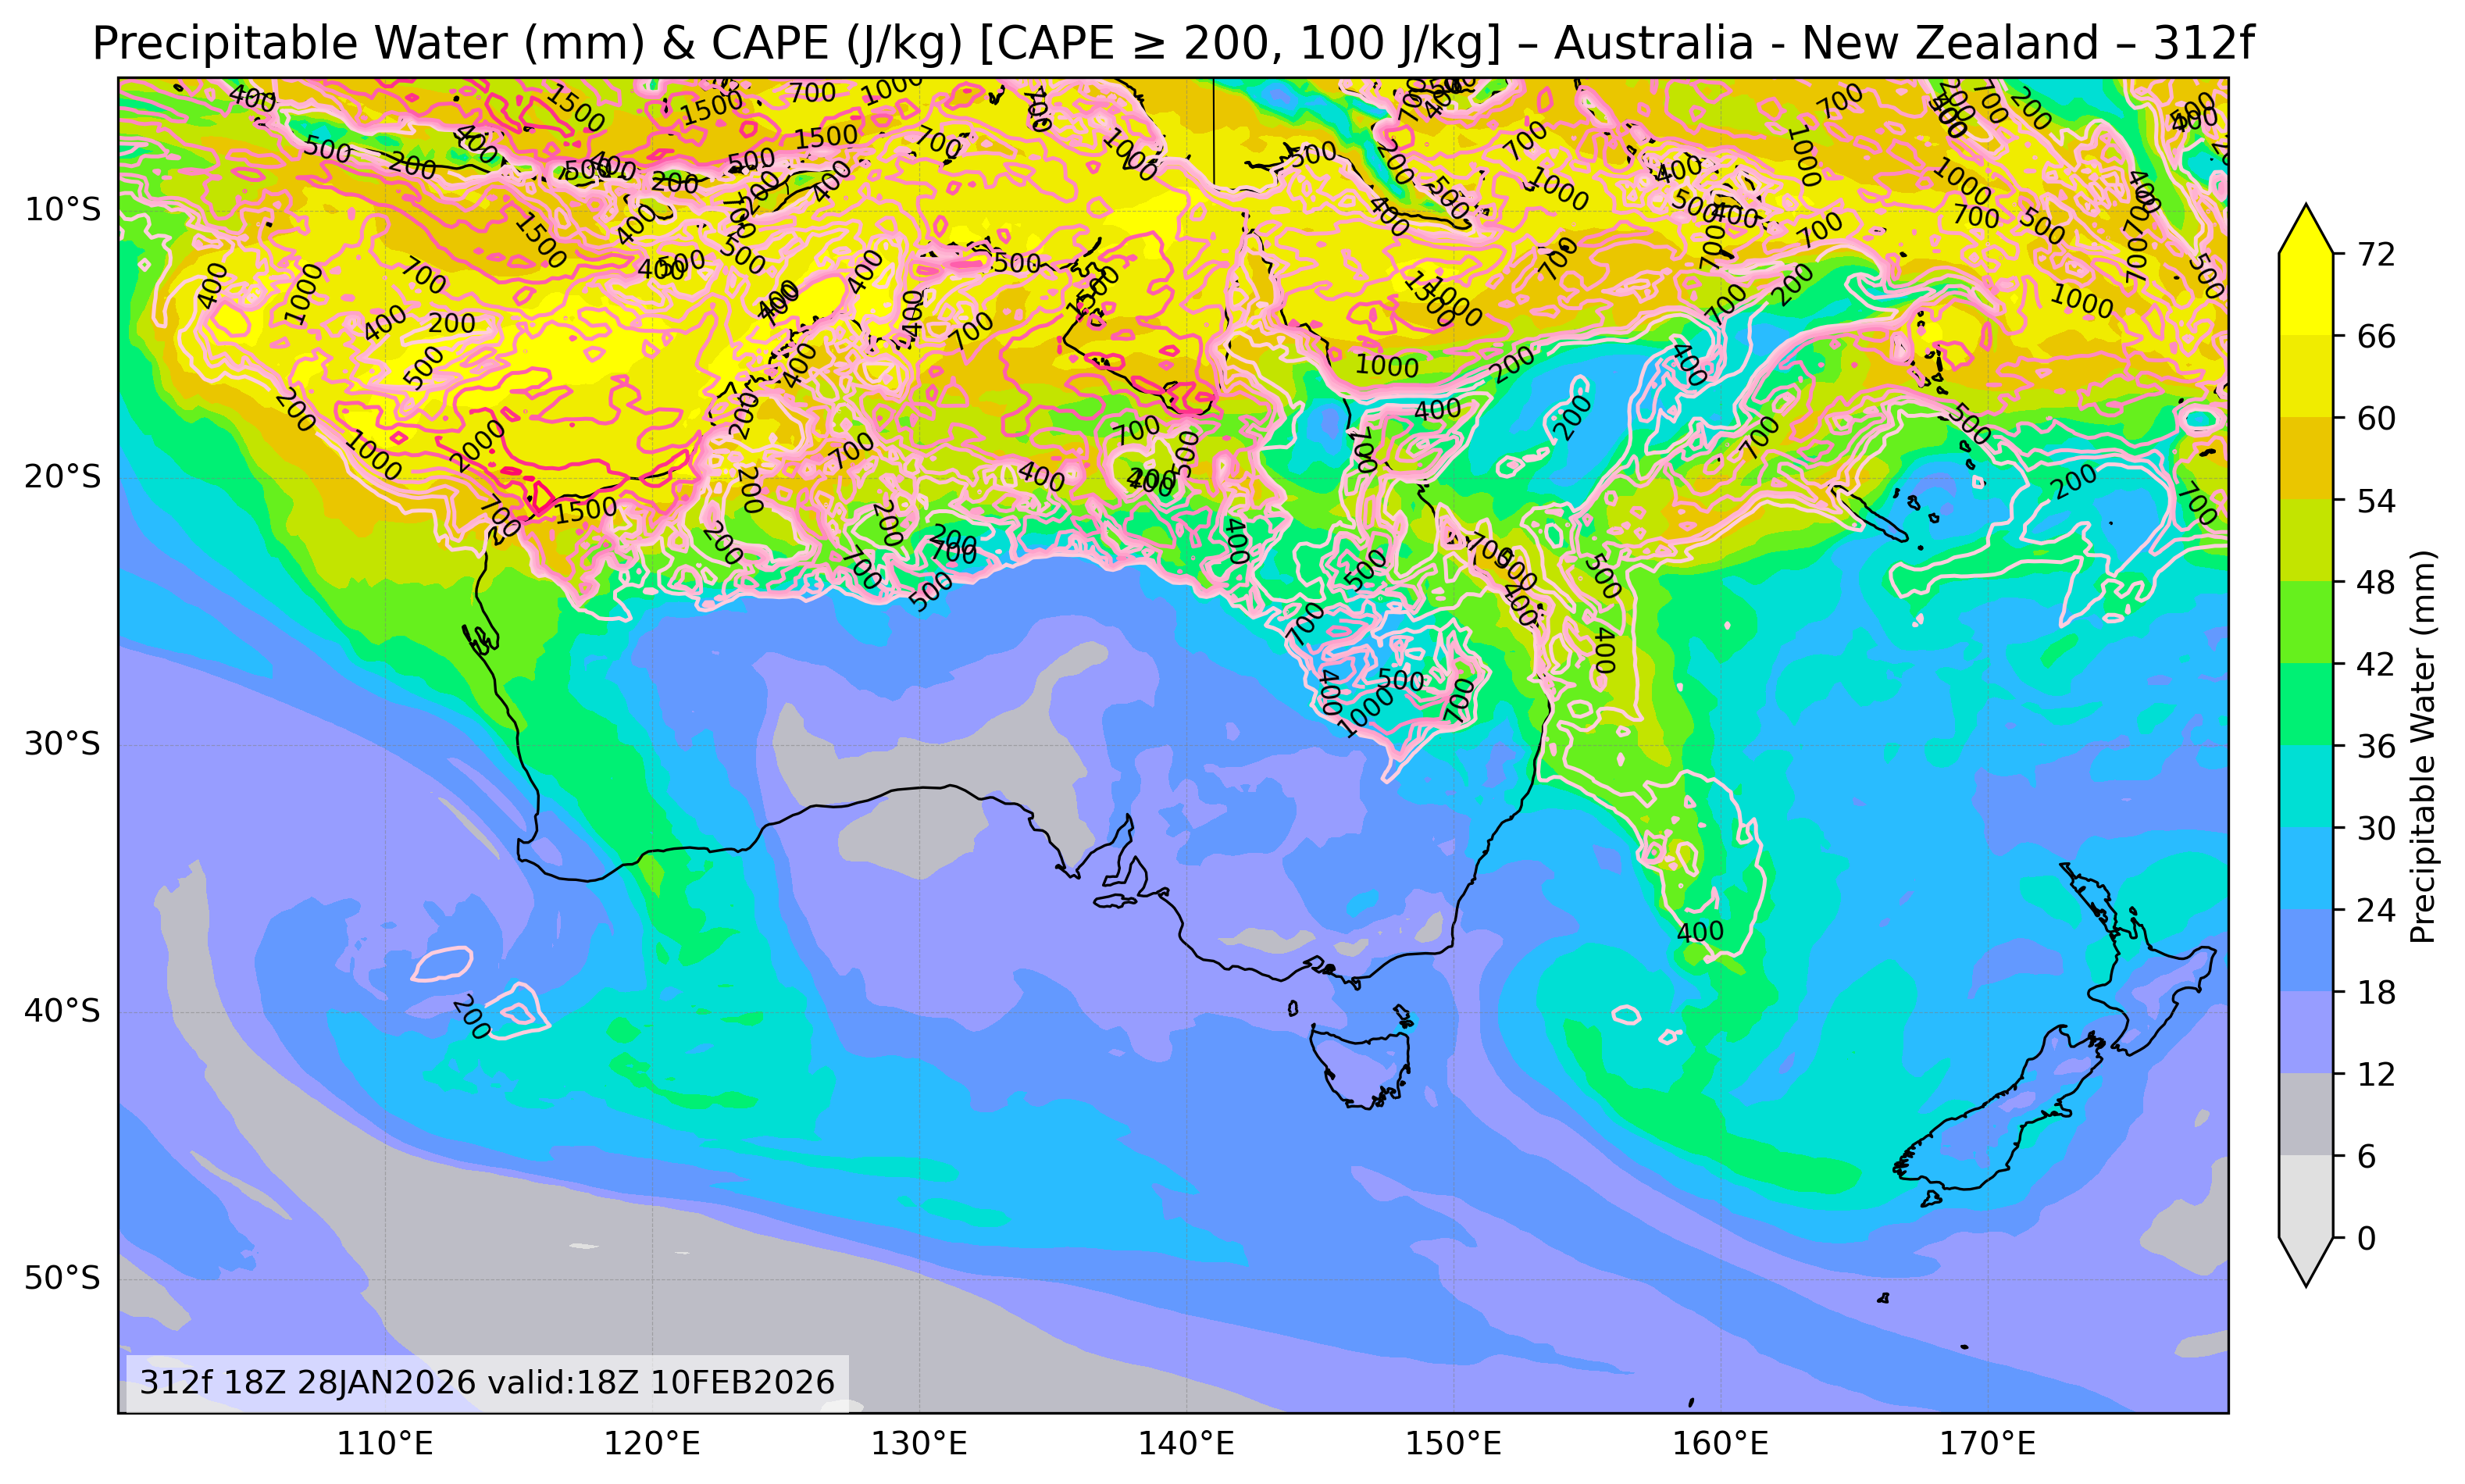
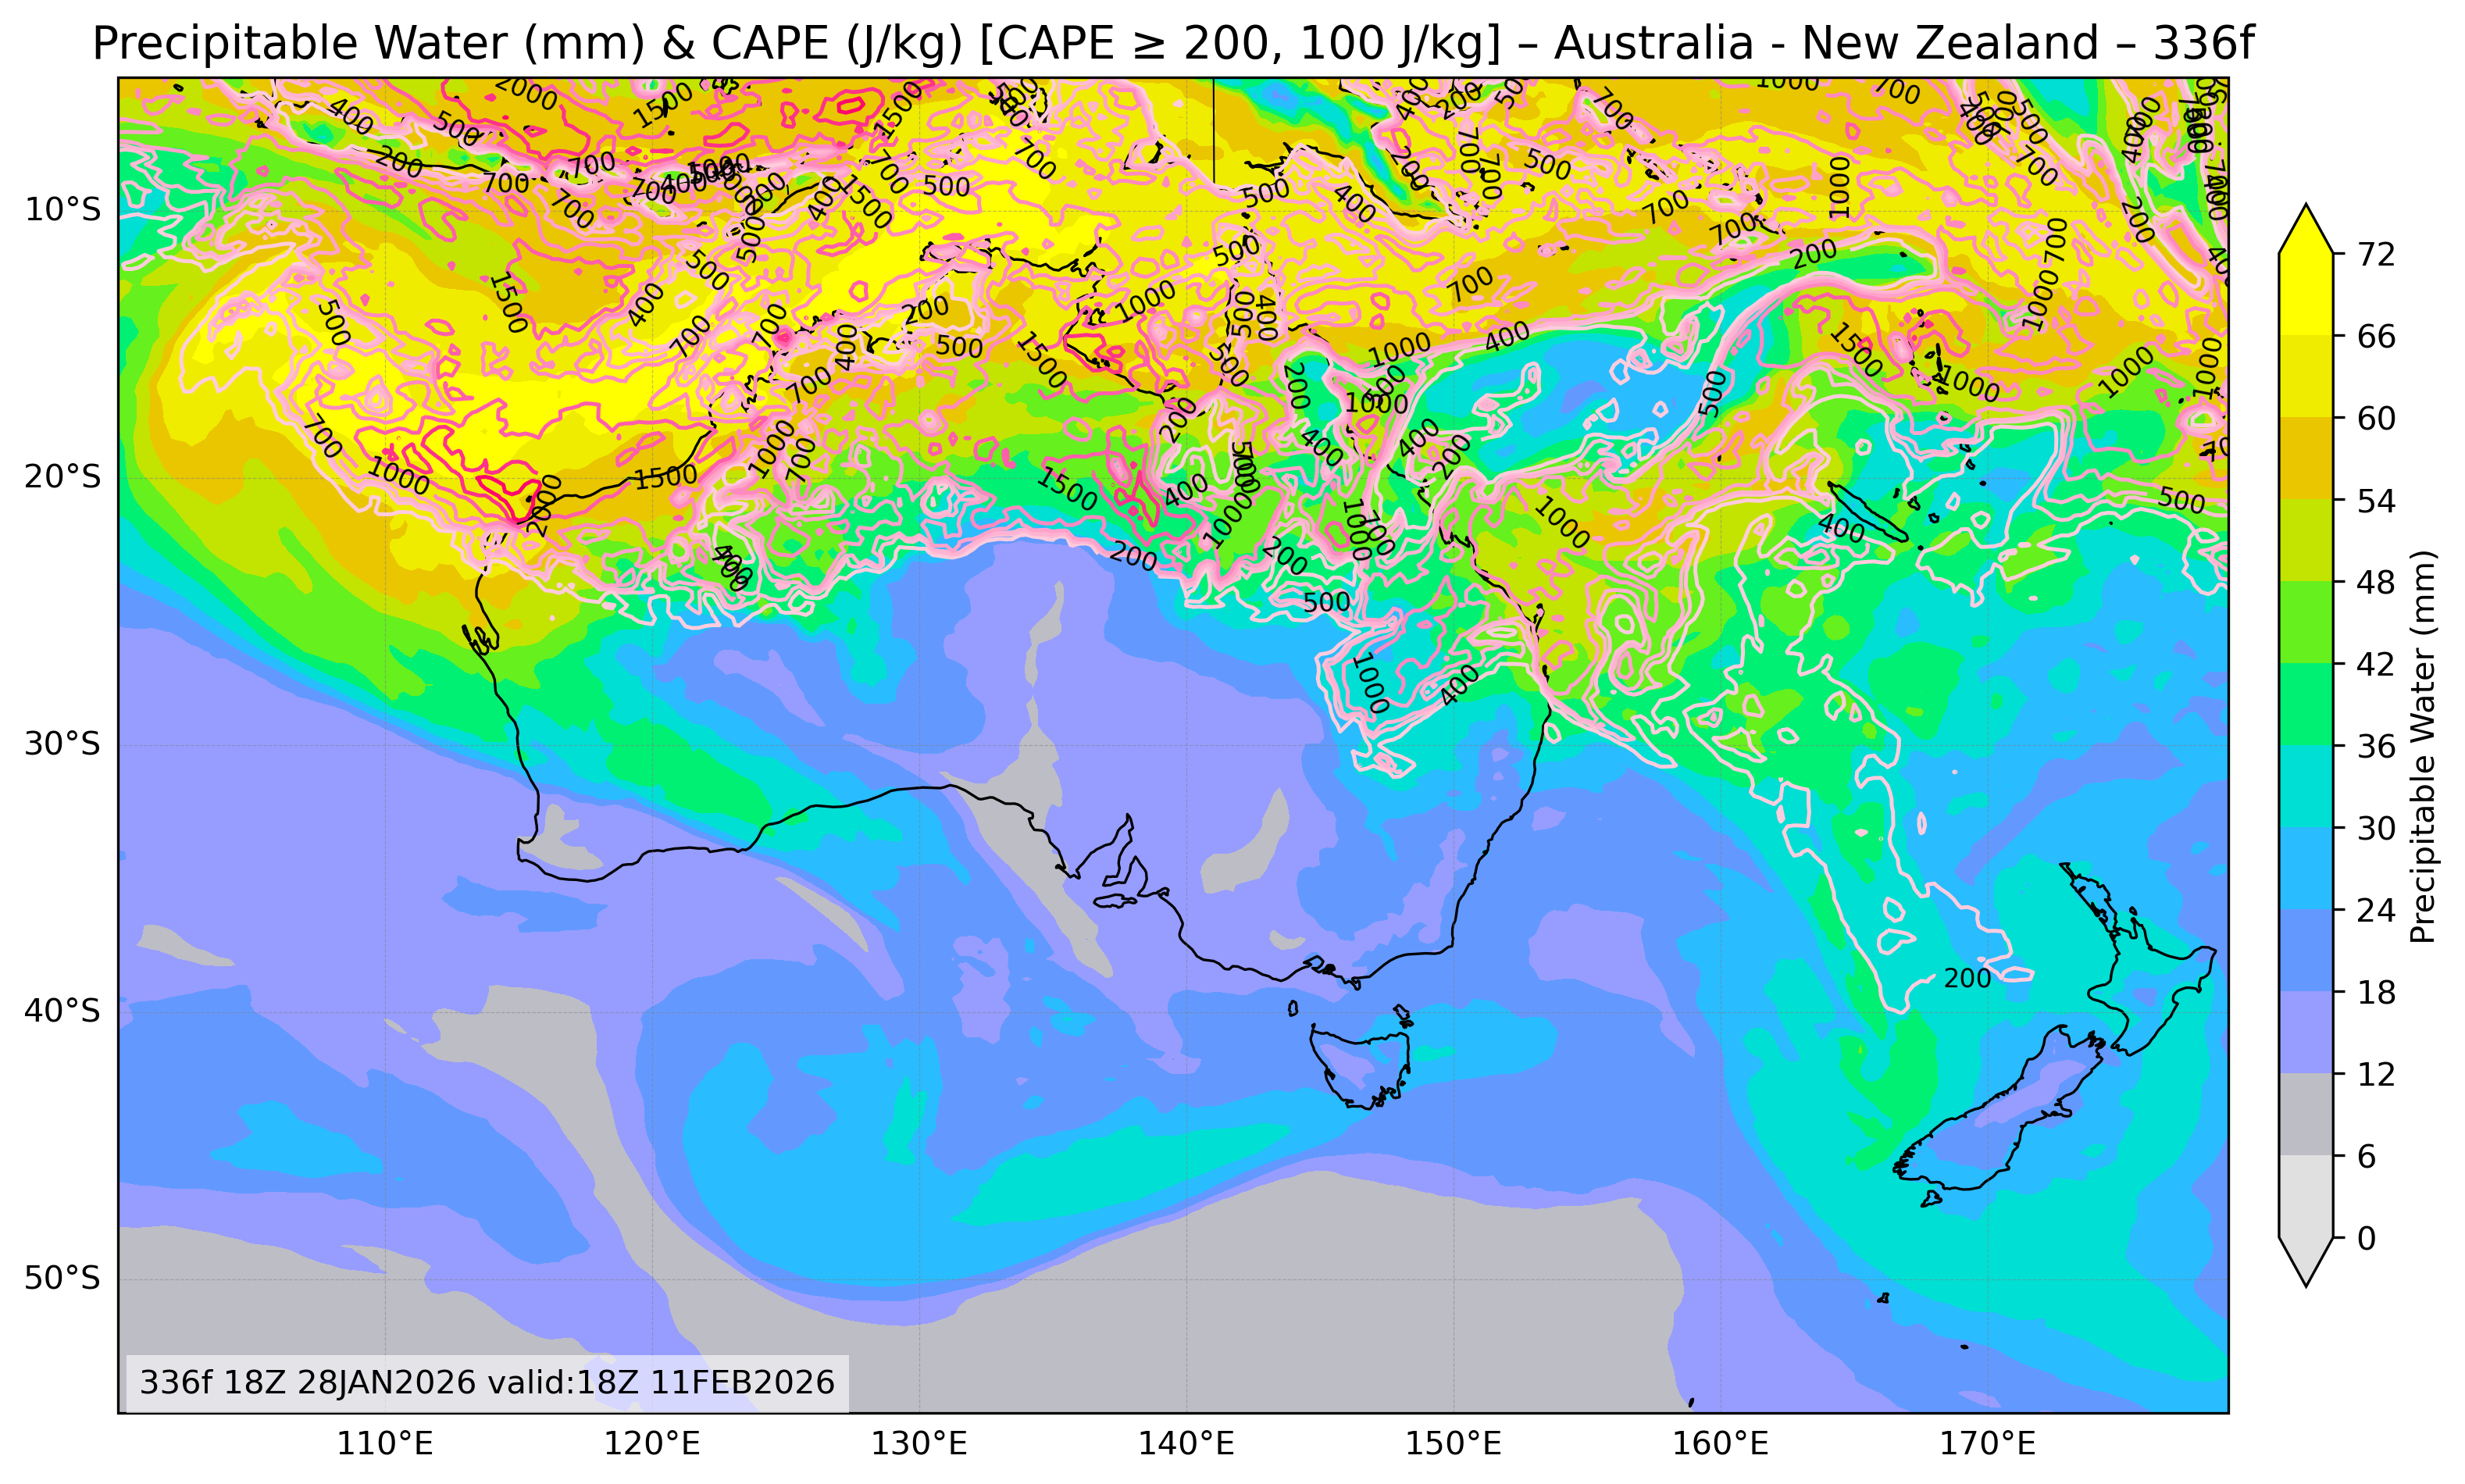
| Precipitable Water & Convective Available Potential Energy |
All Times |
🔍 | 🔍 | 🔍 | 🔍 | 🔍 |
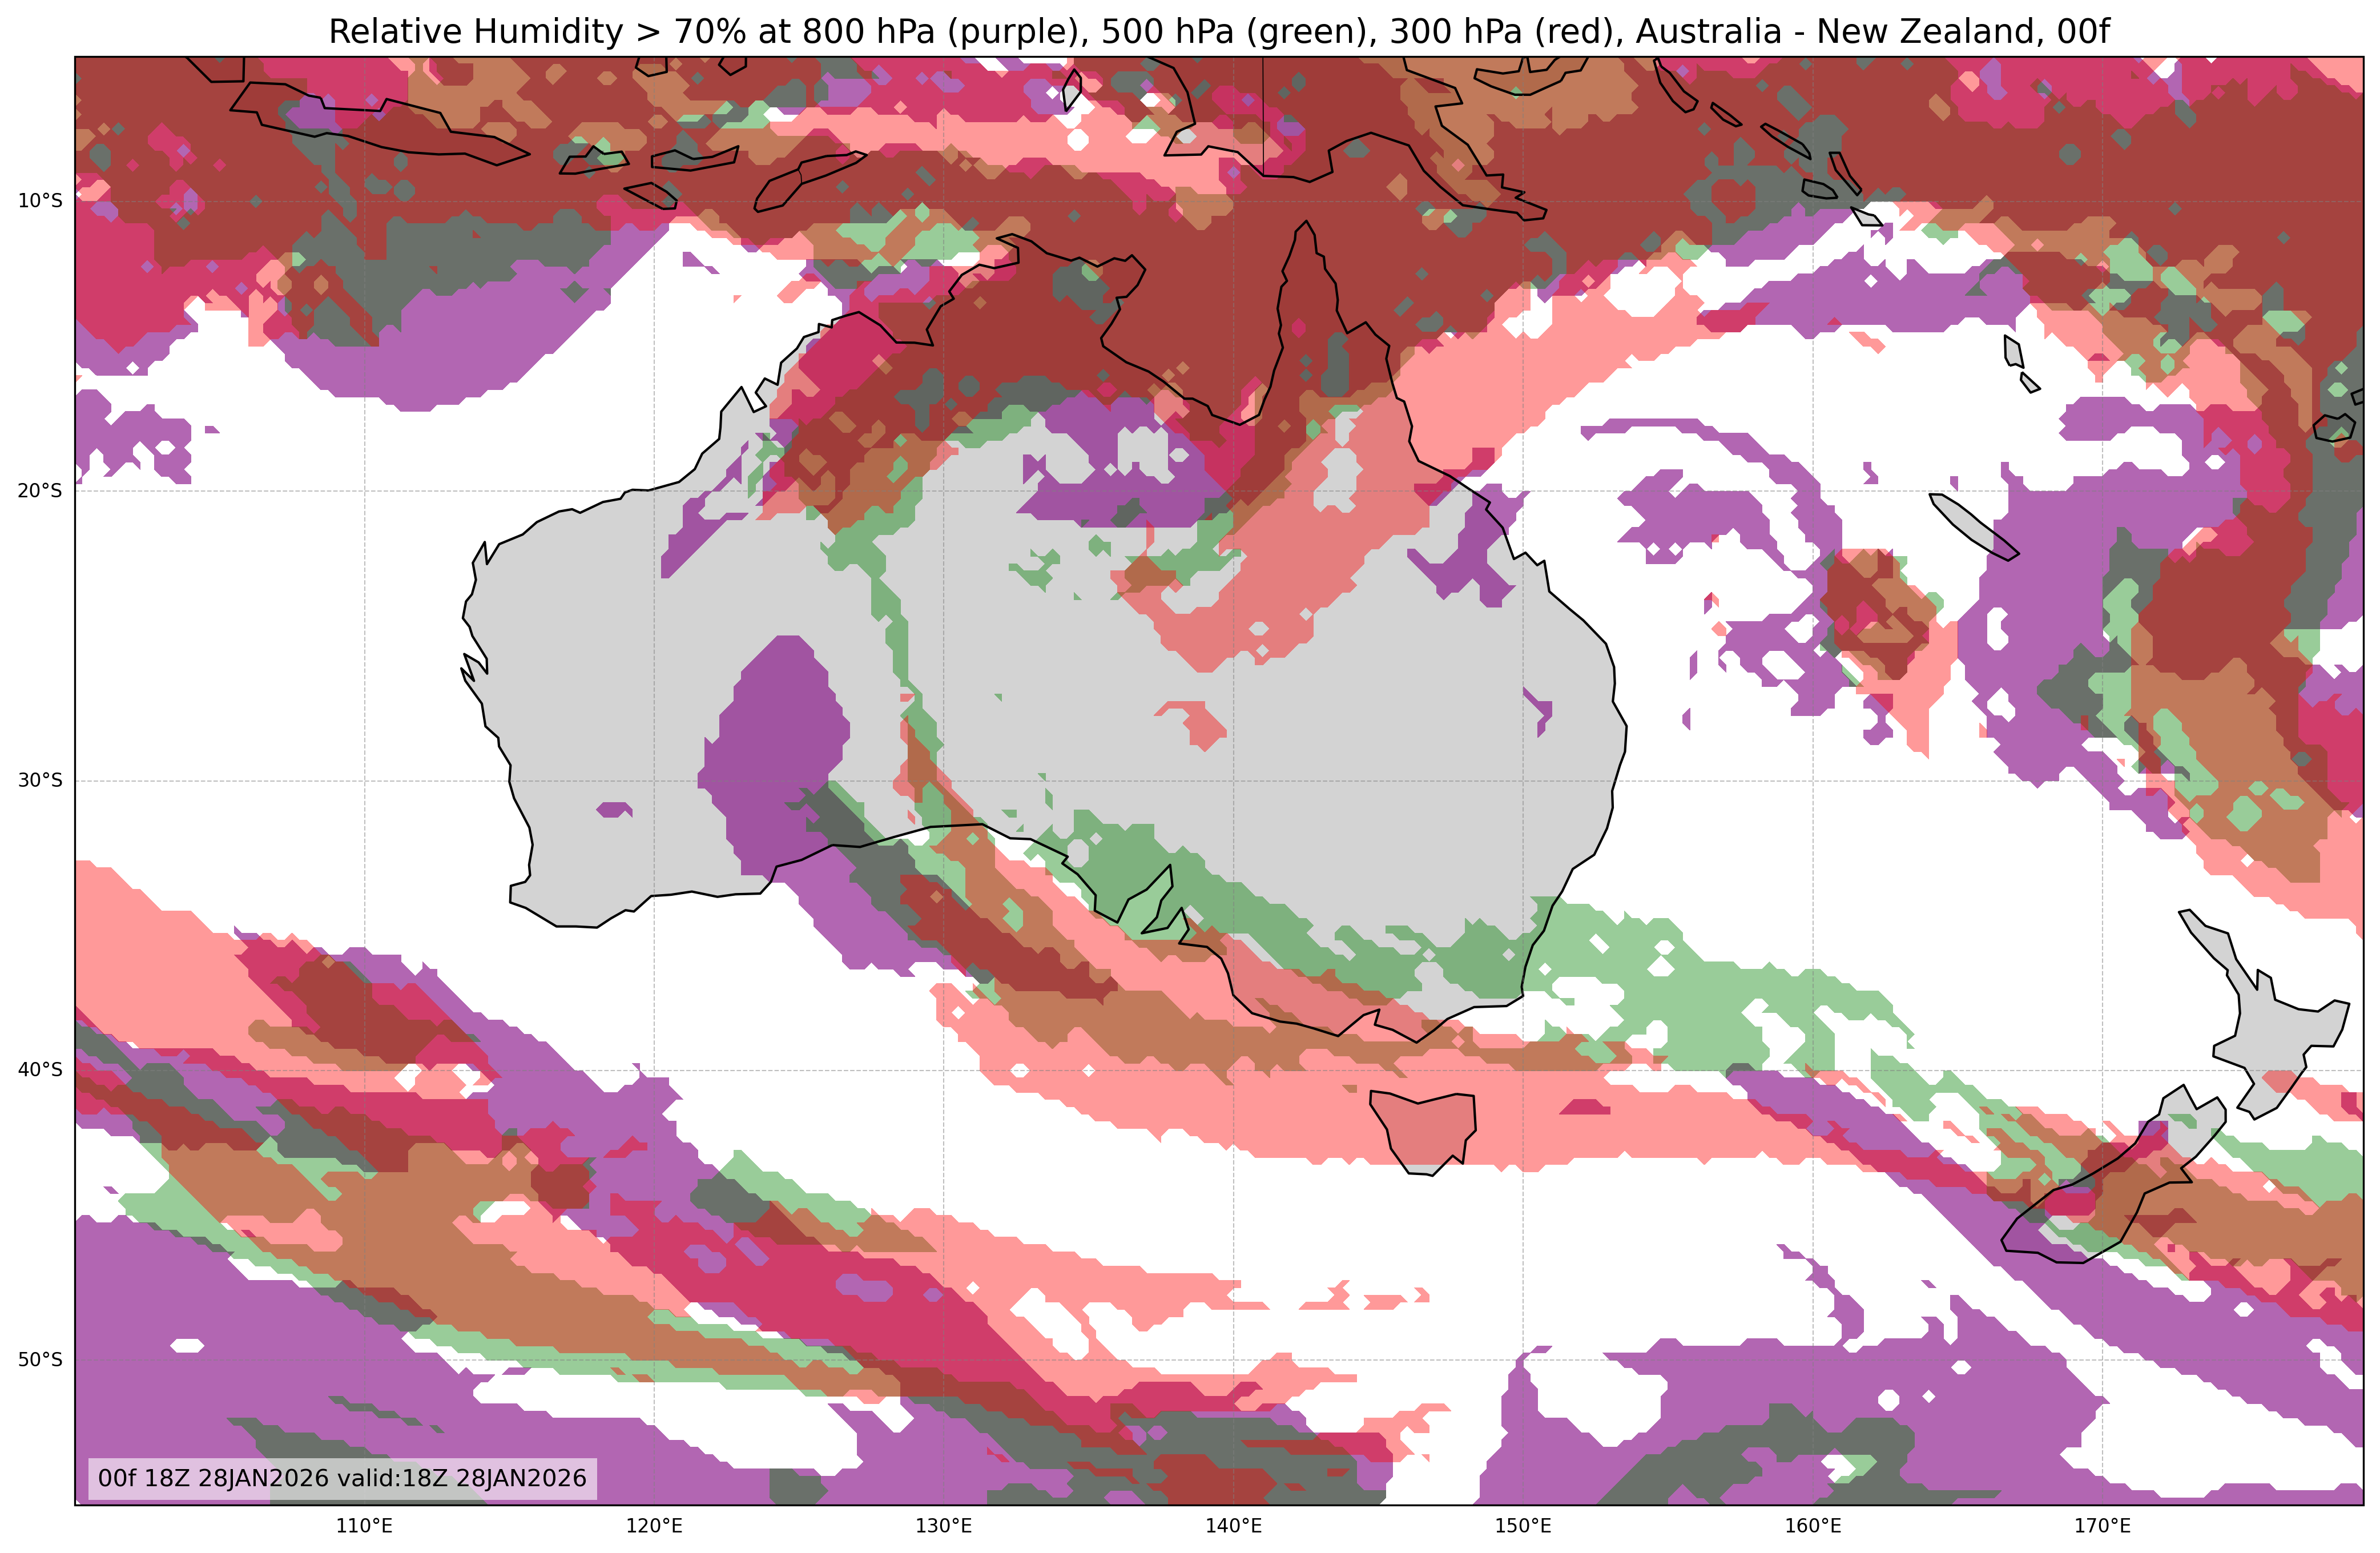
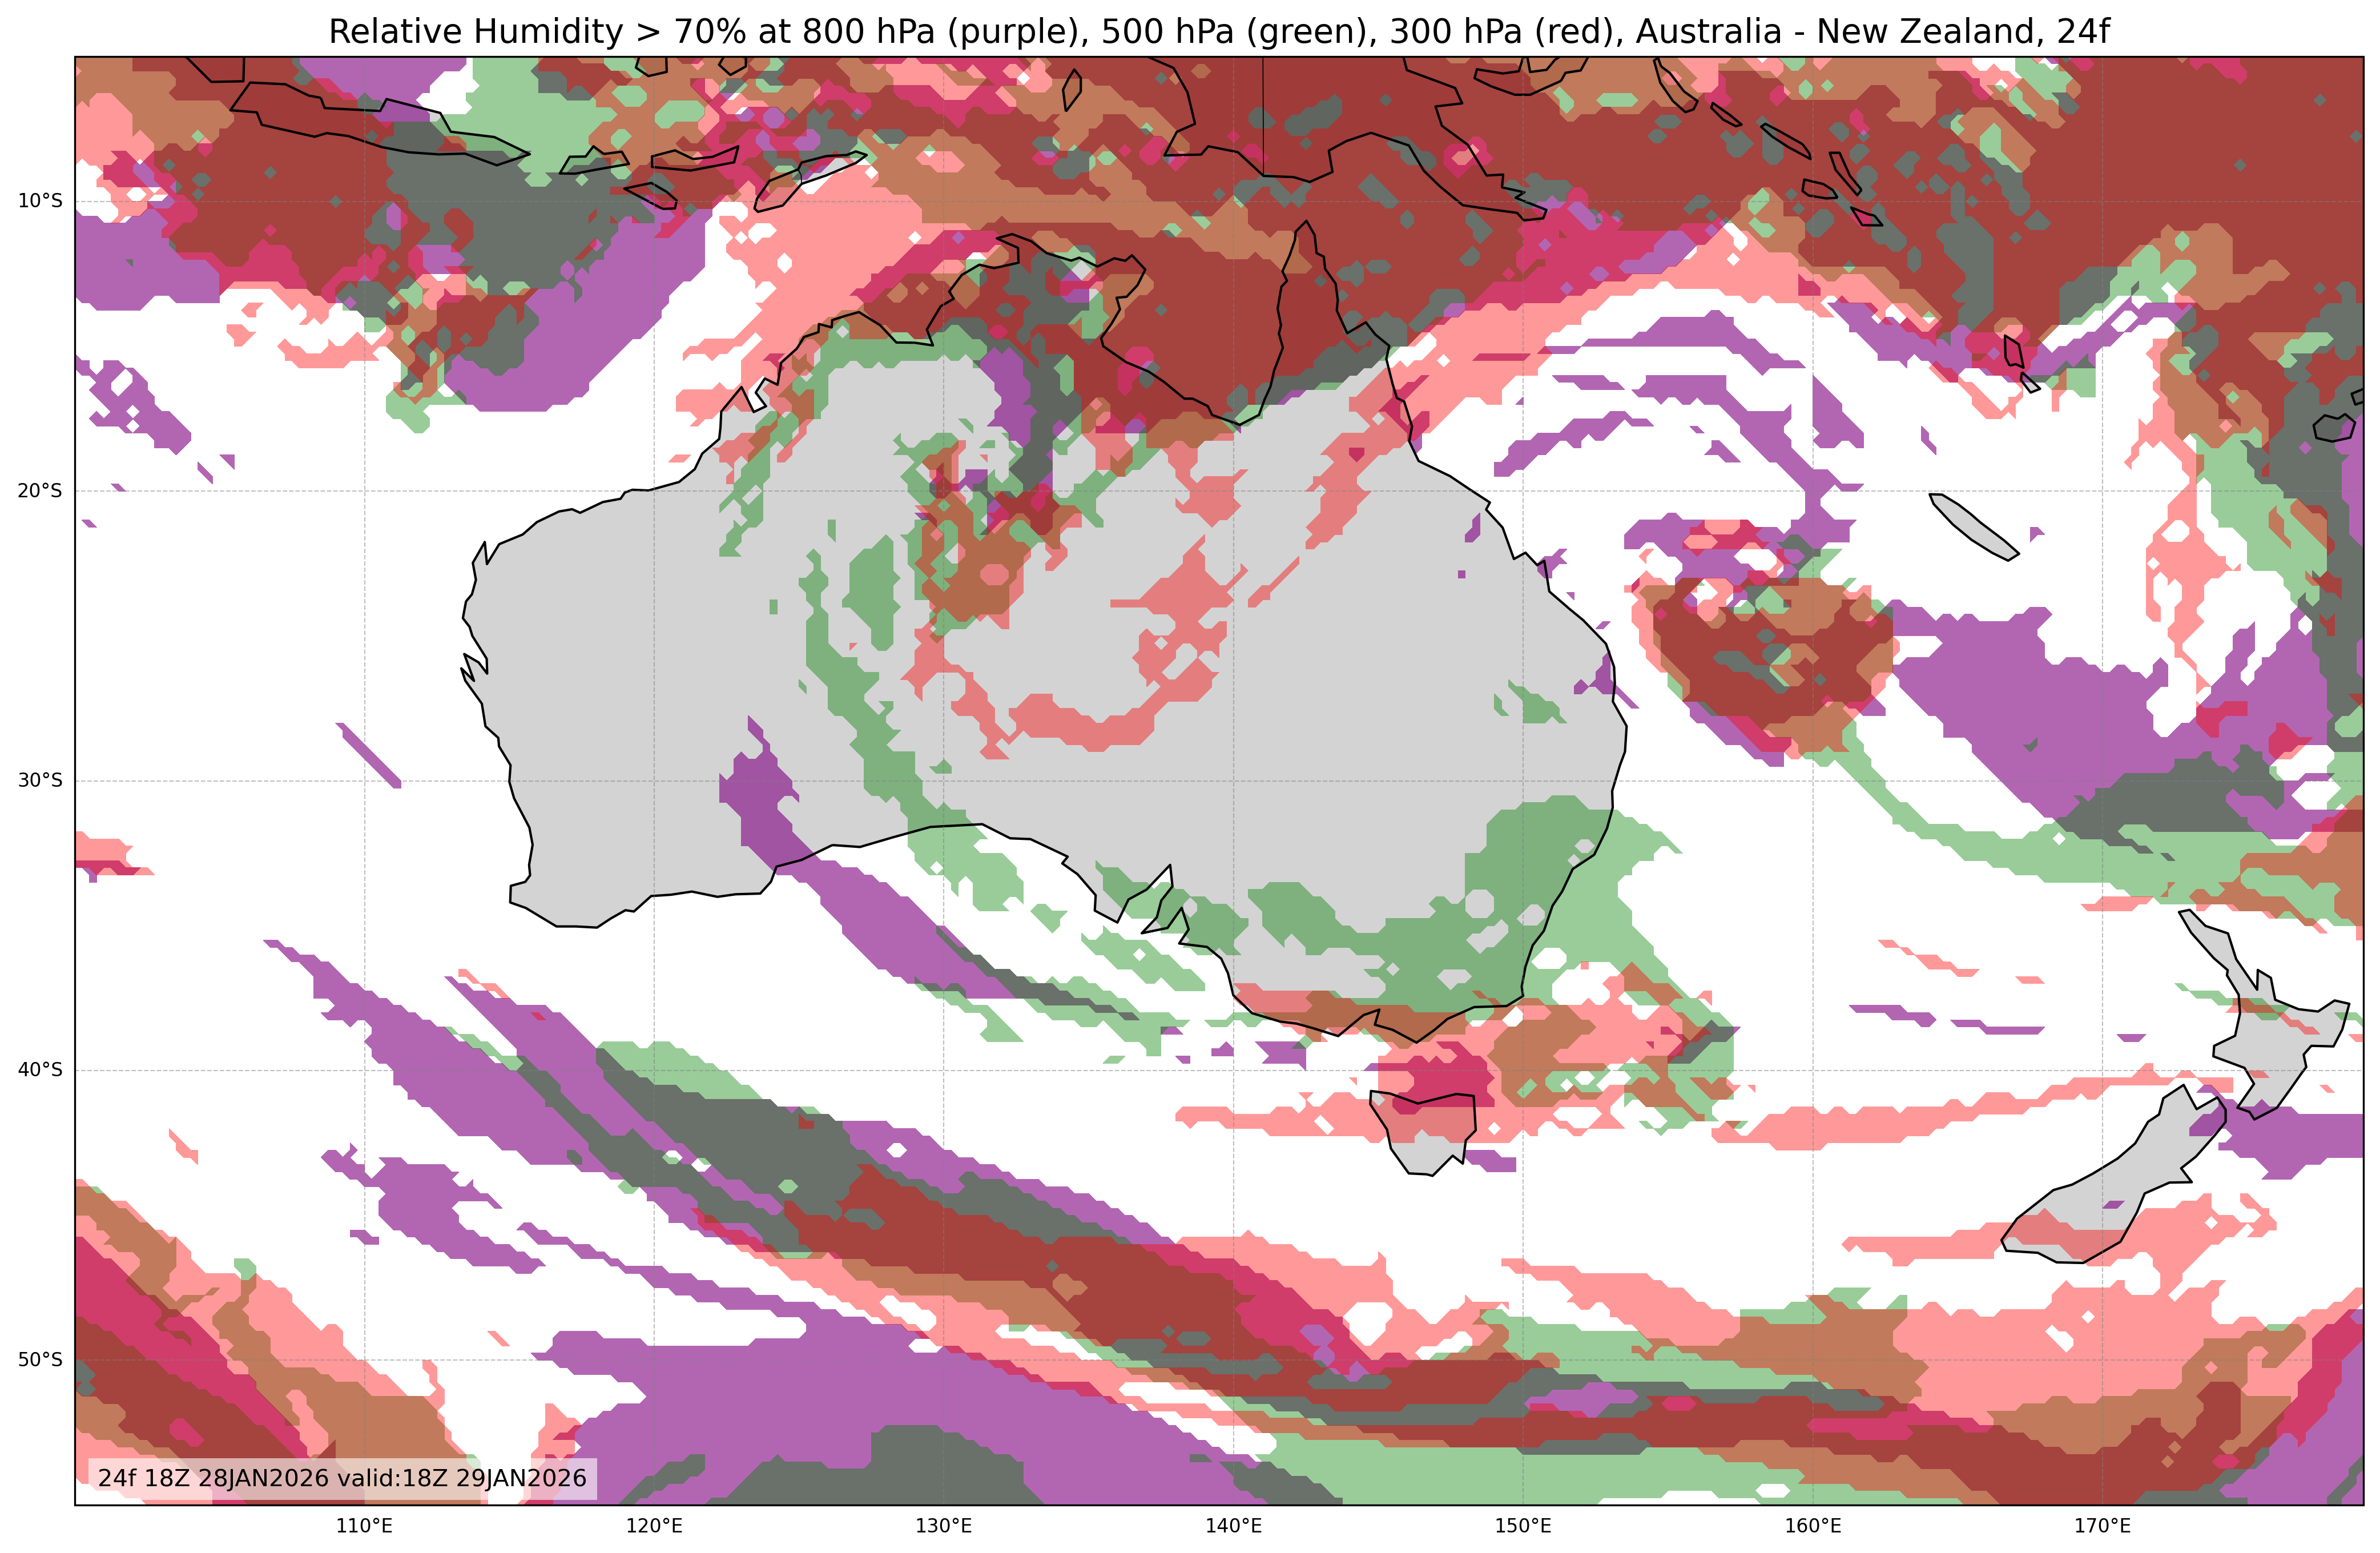
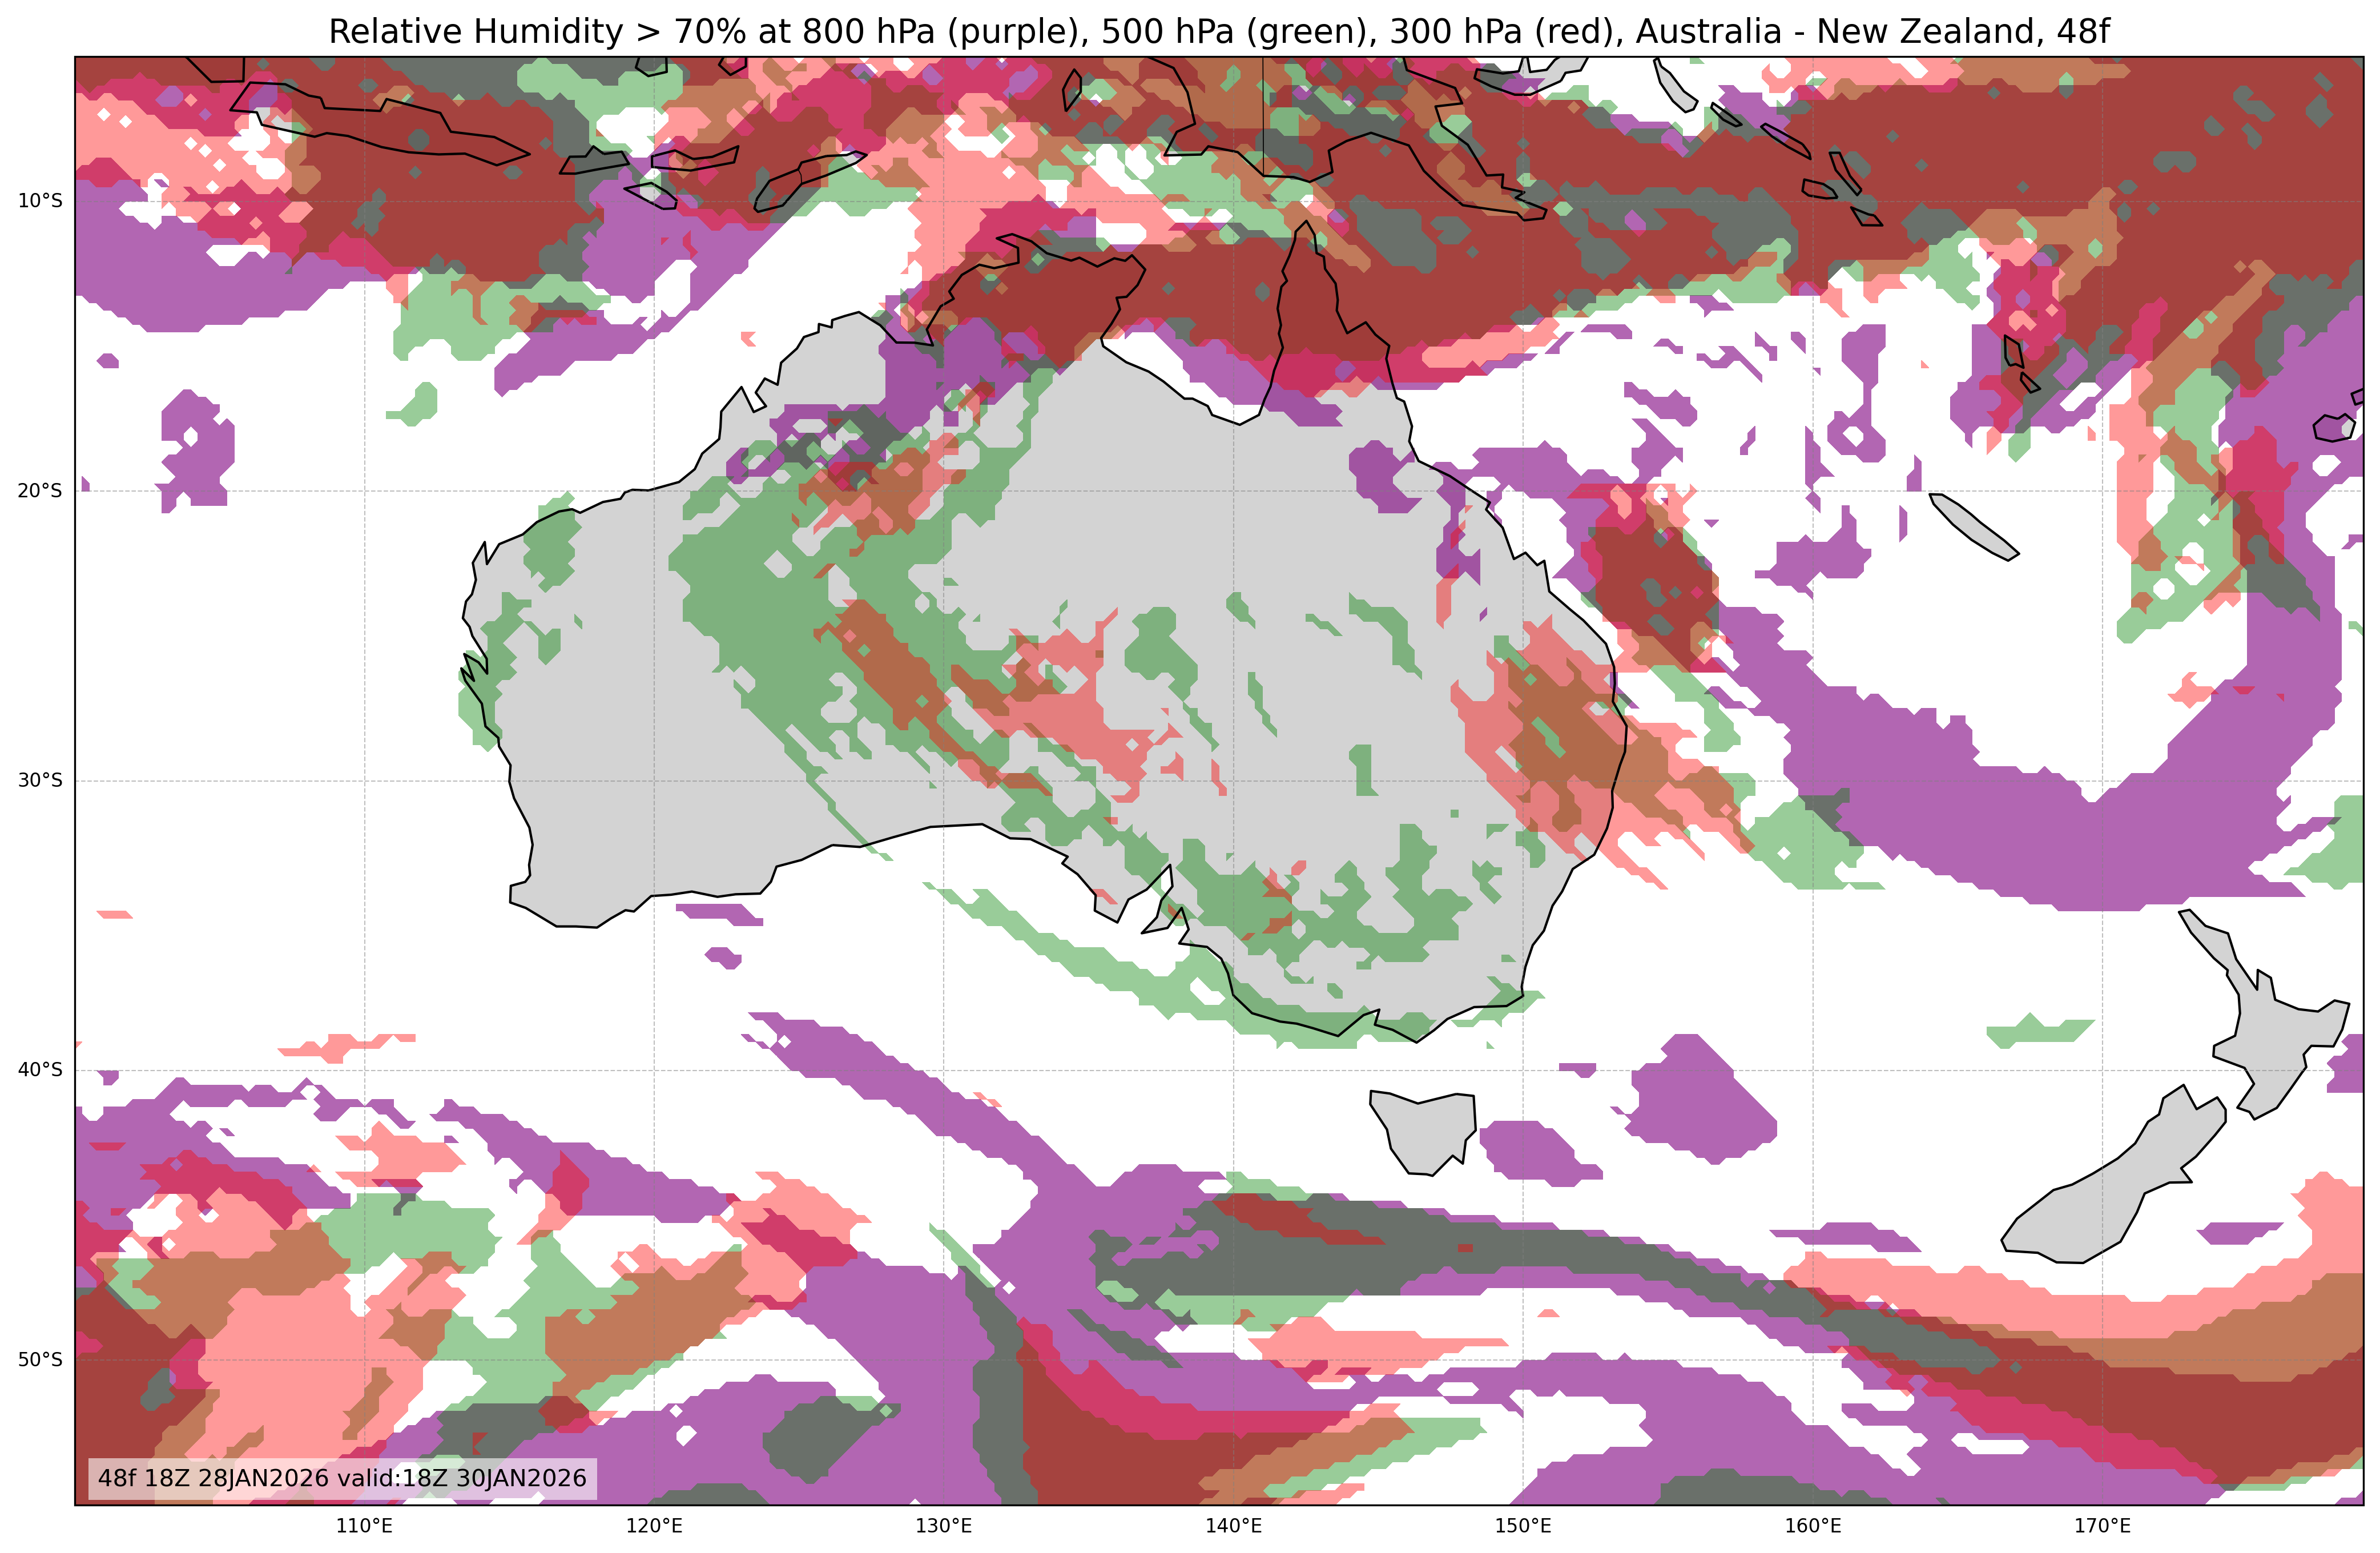
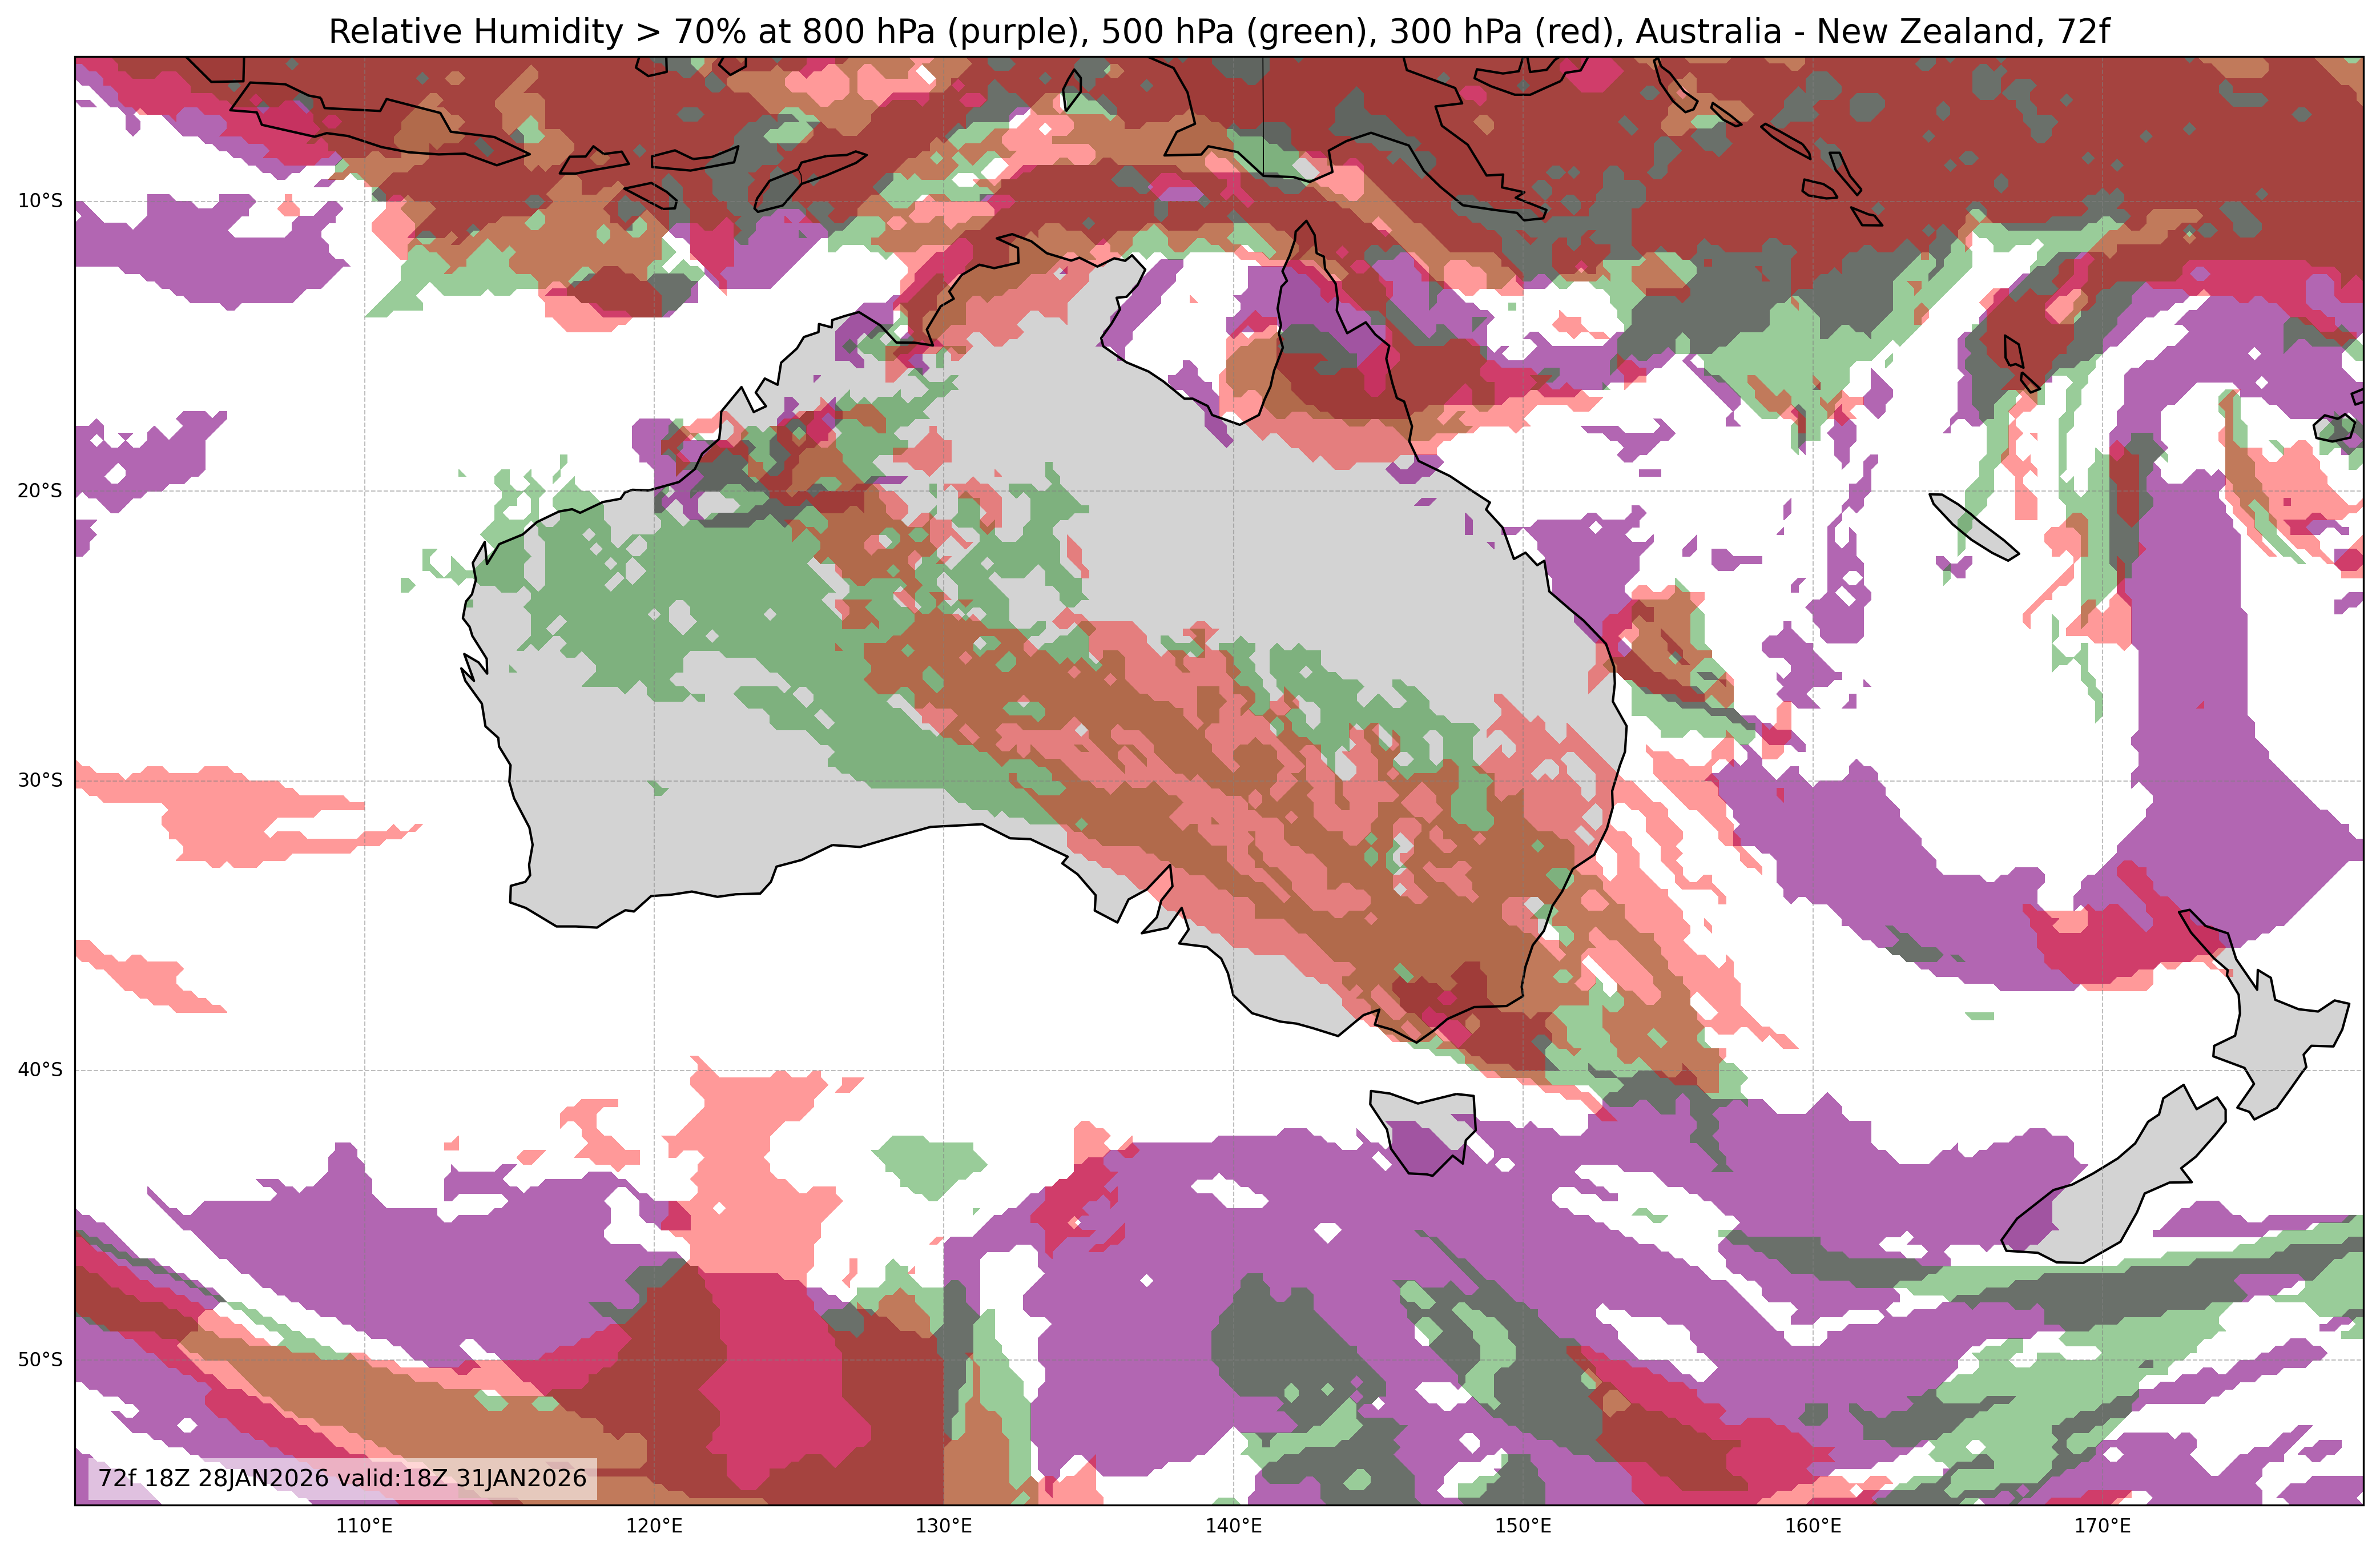
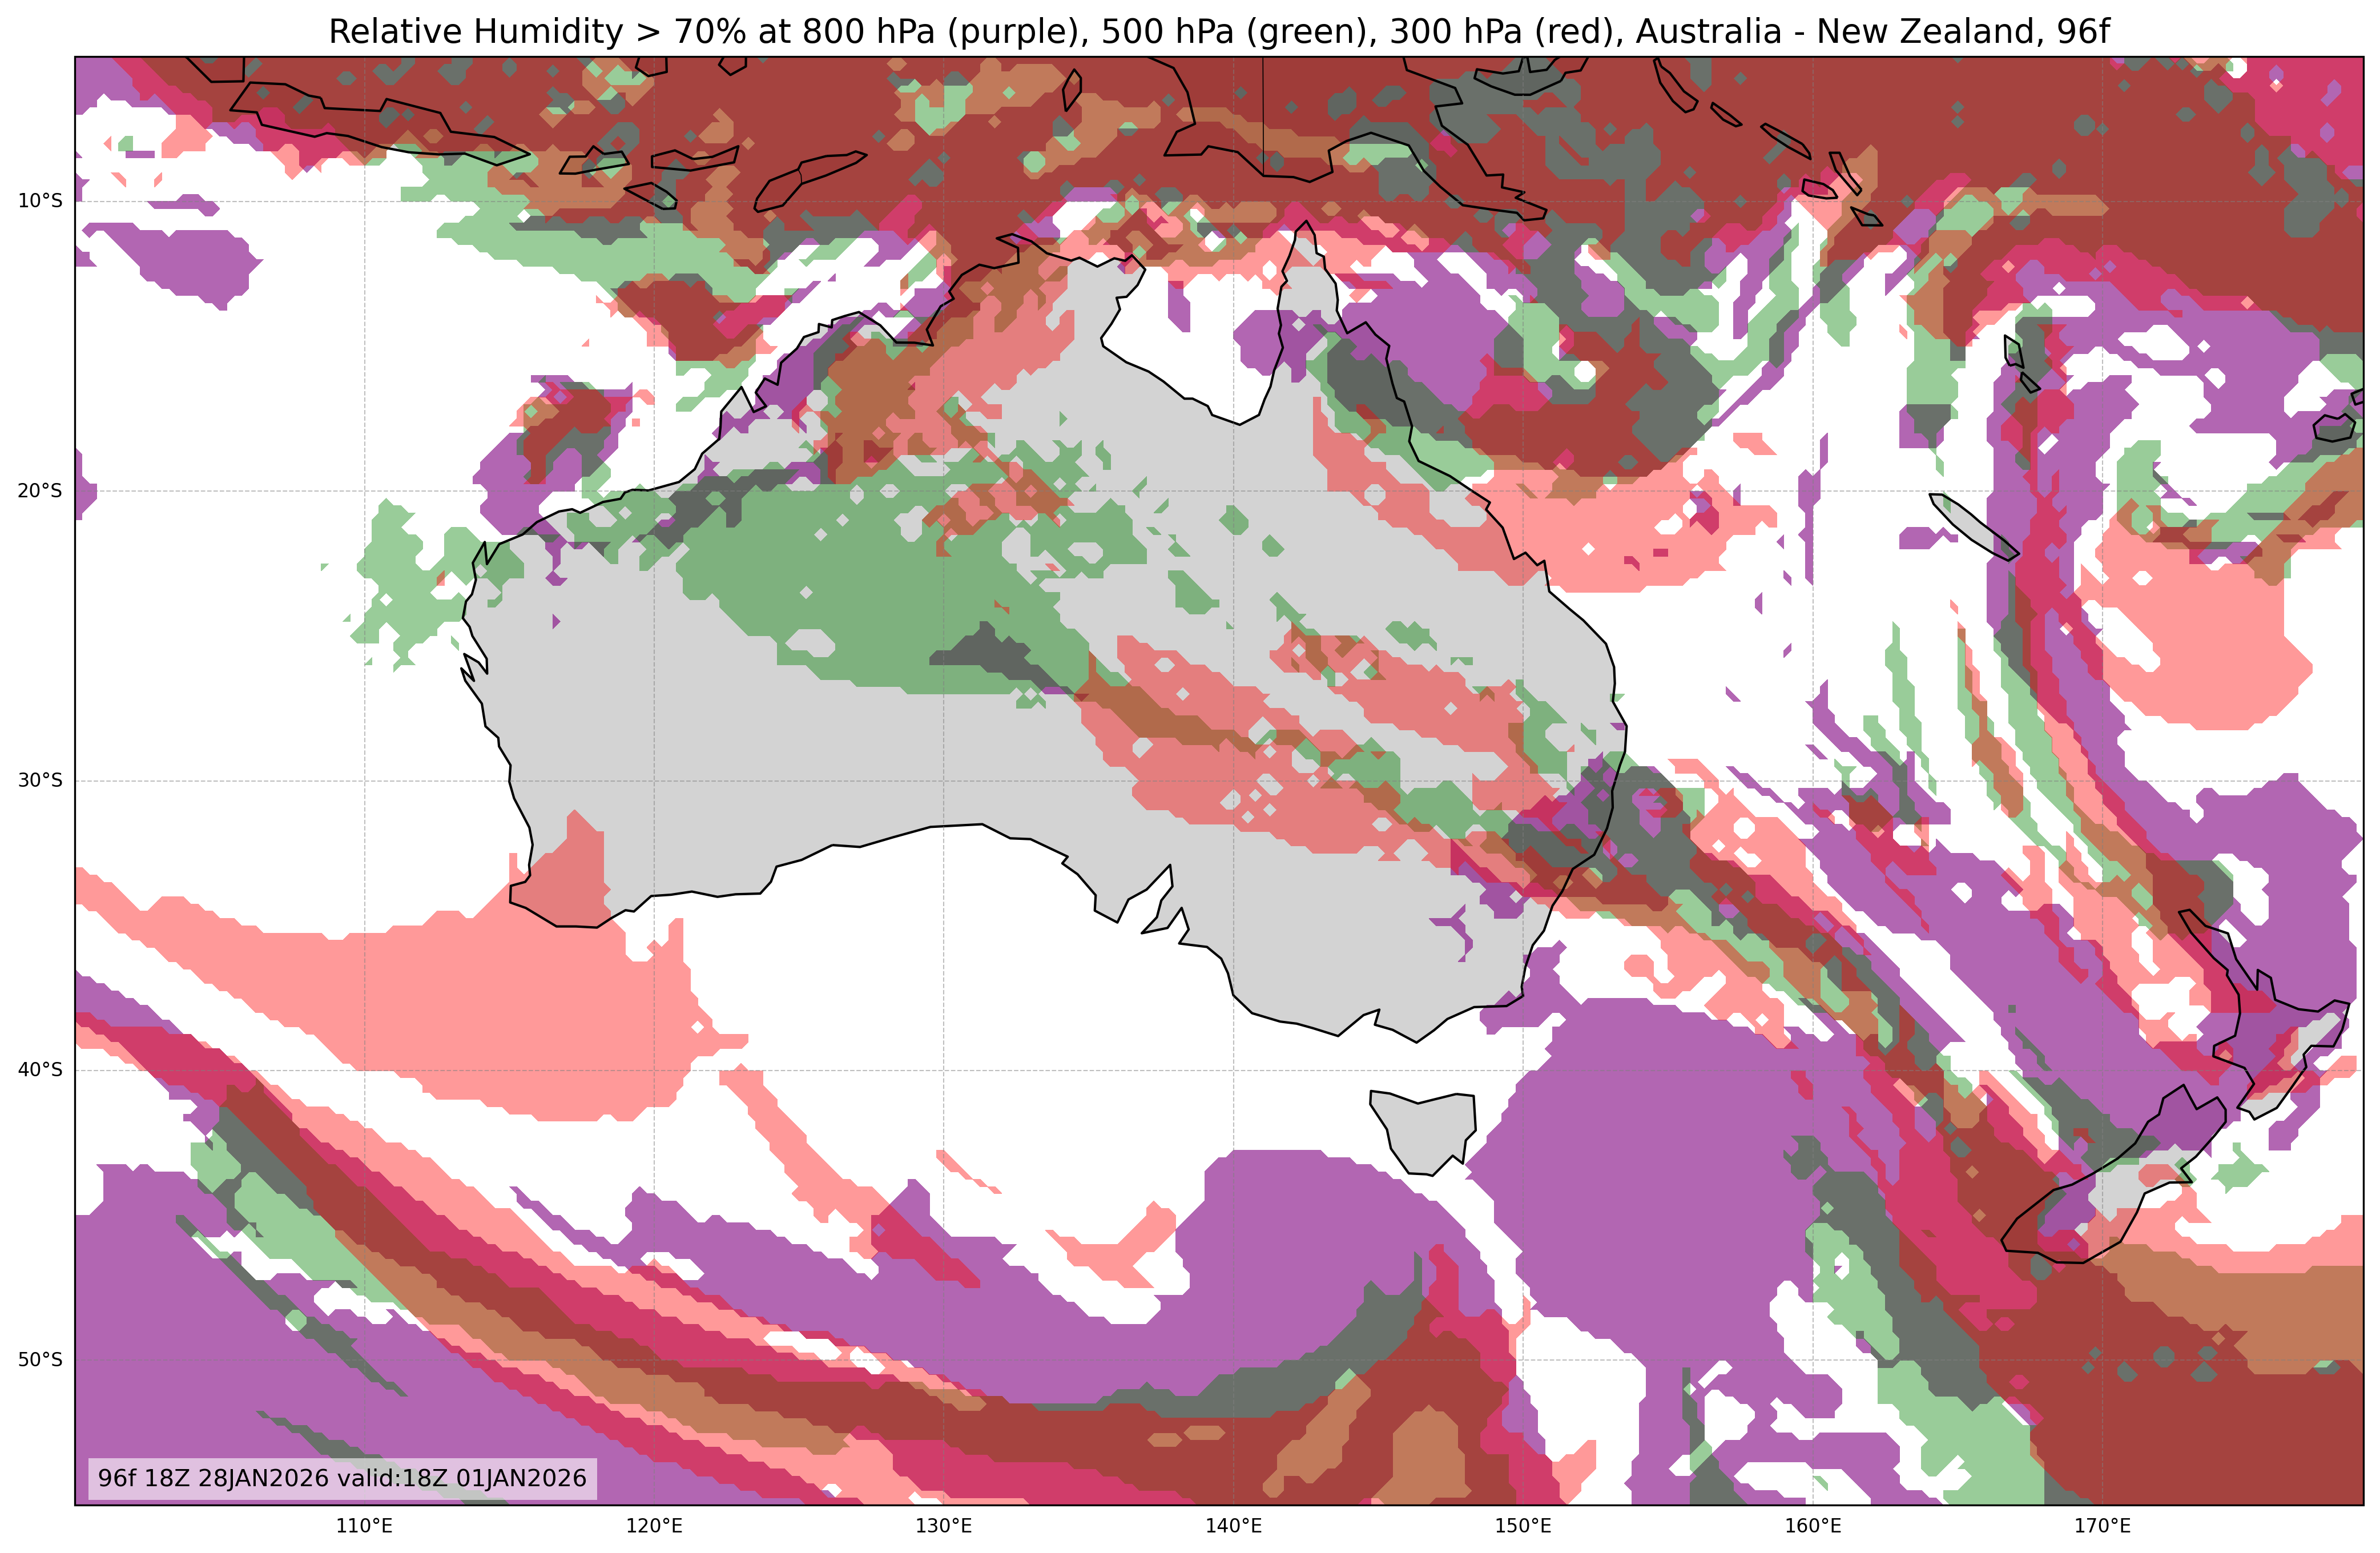
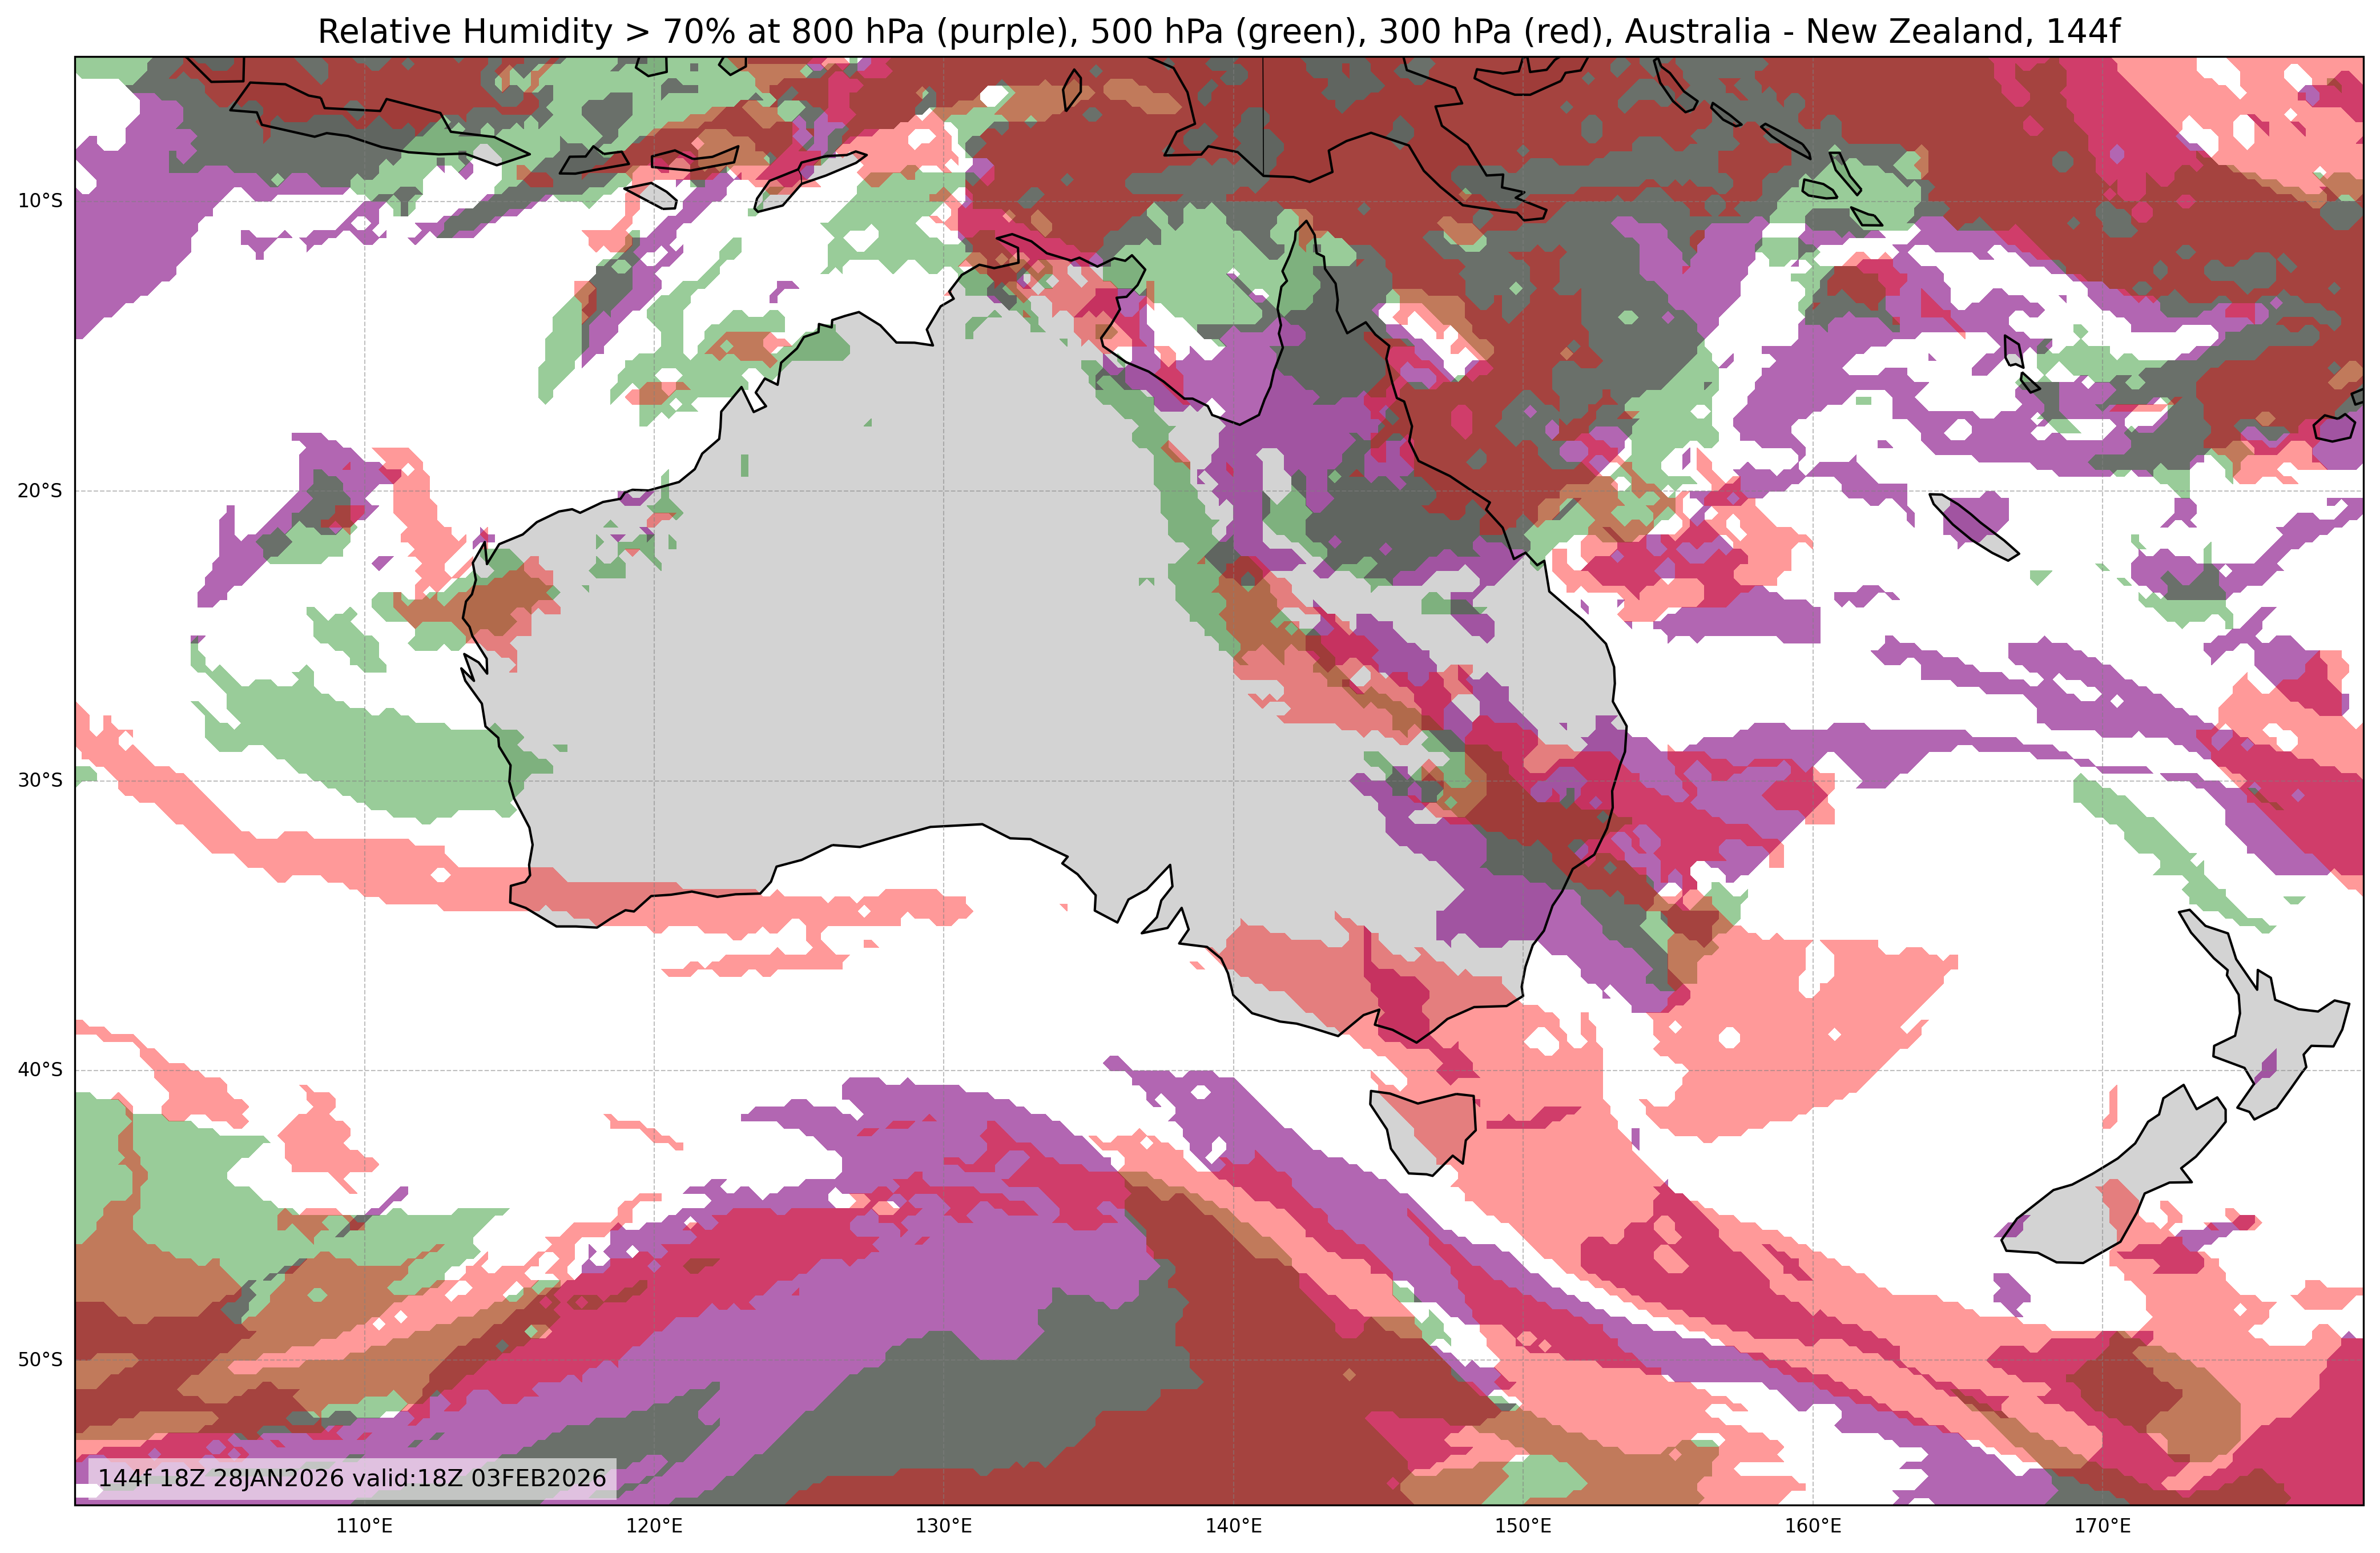
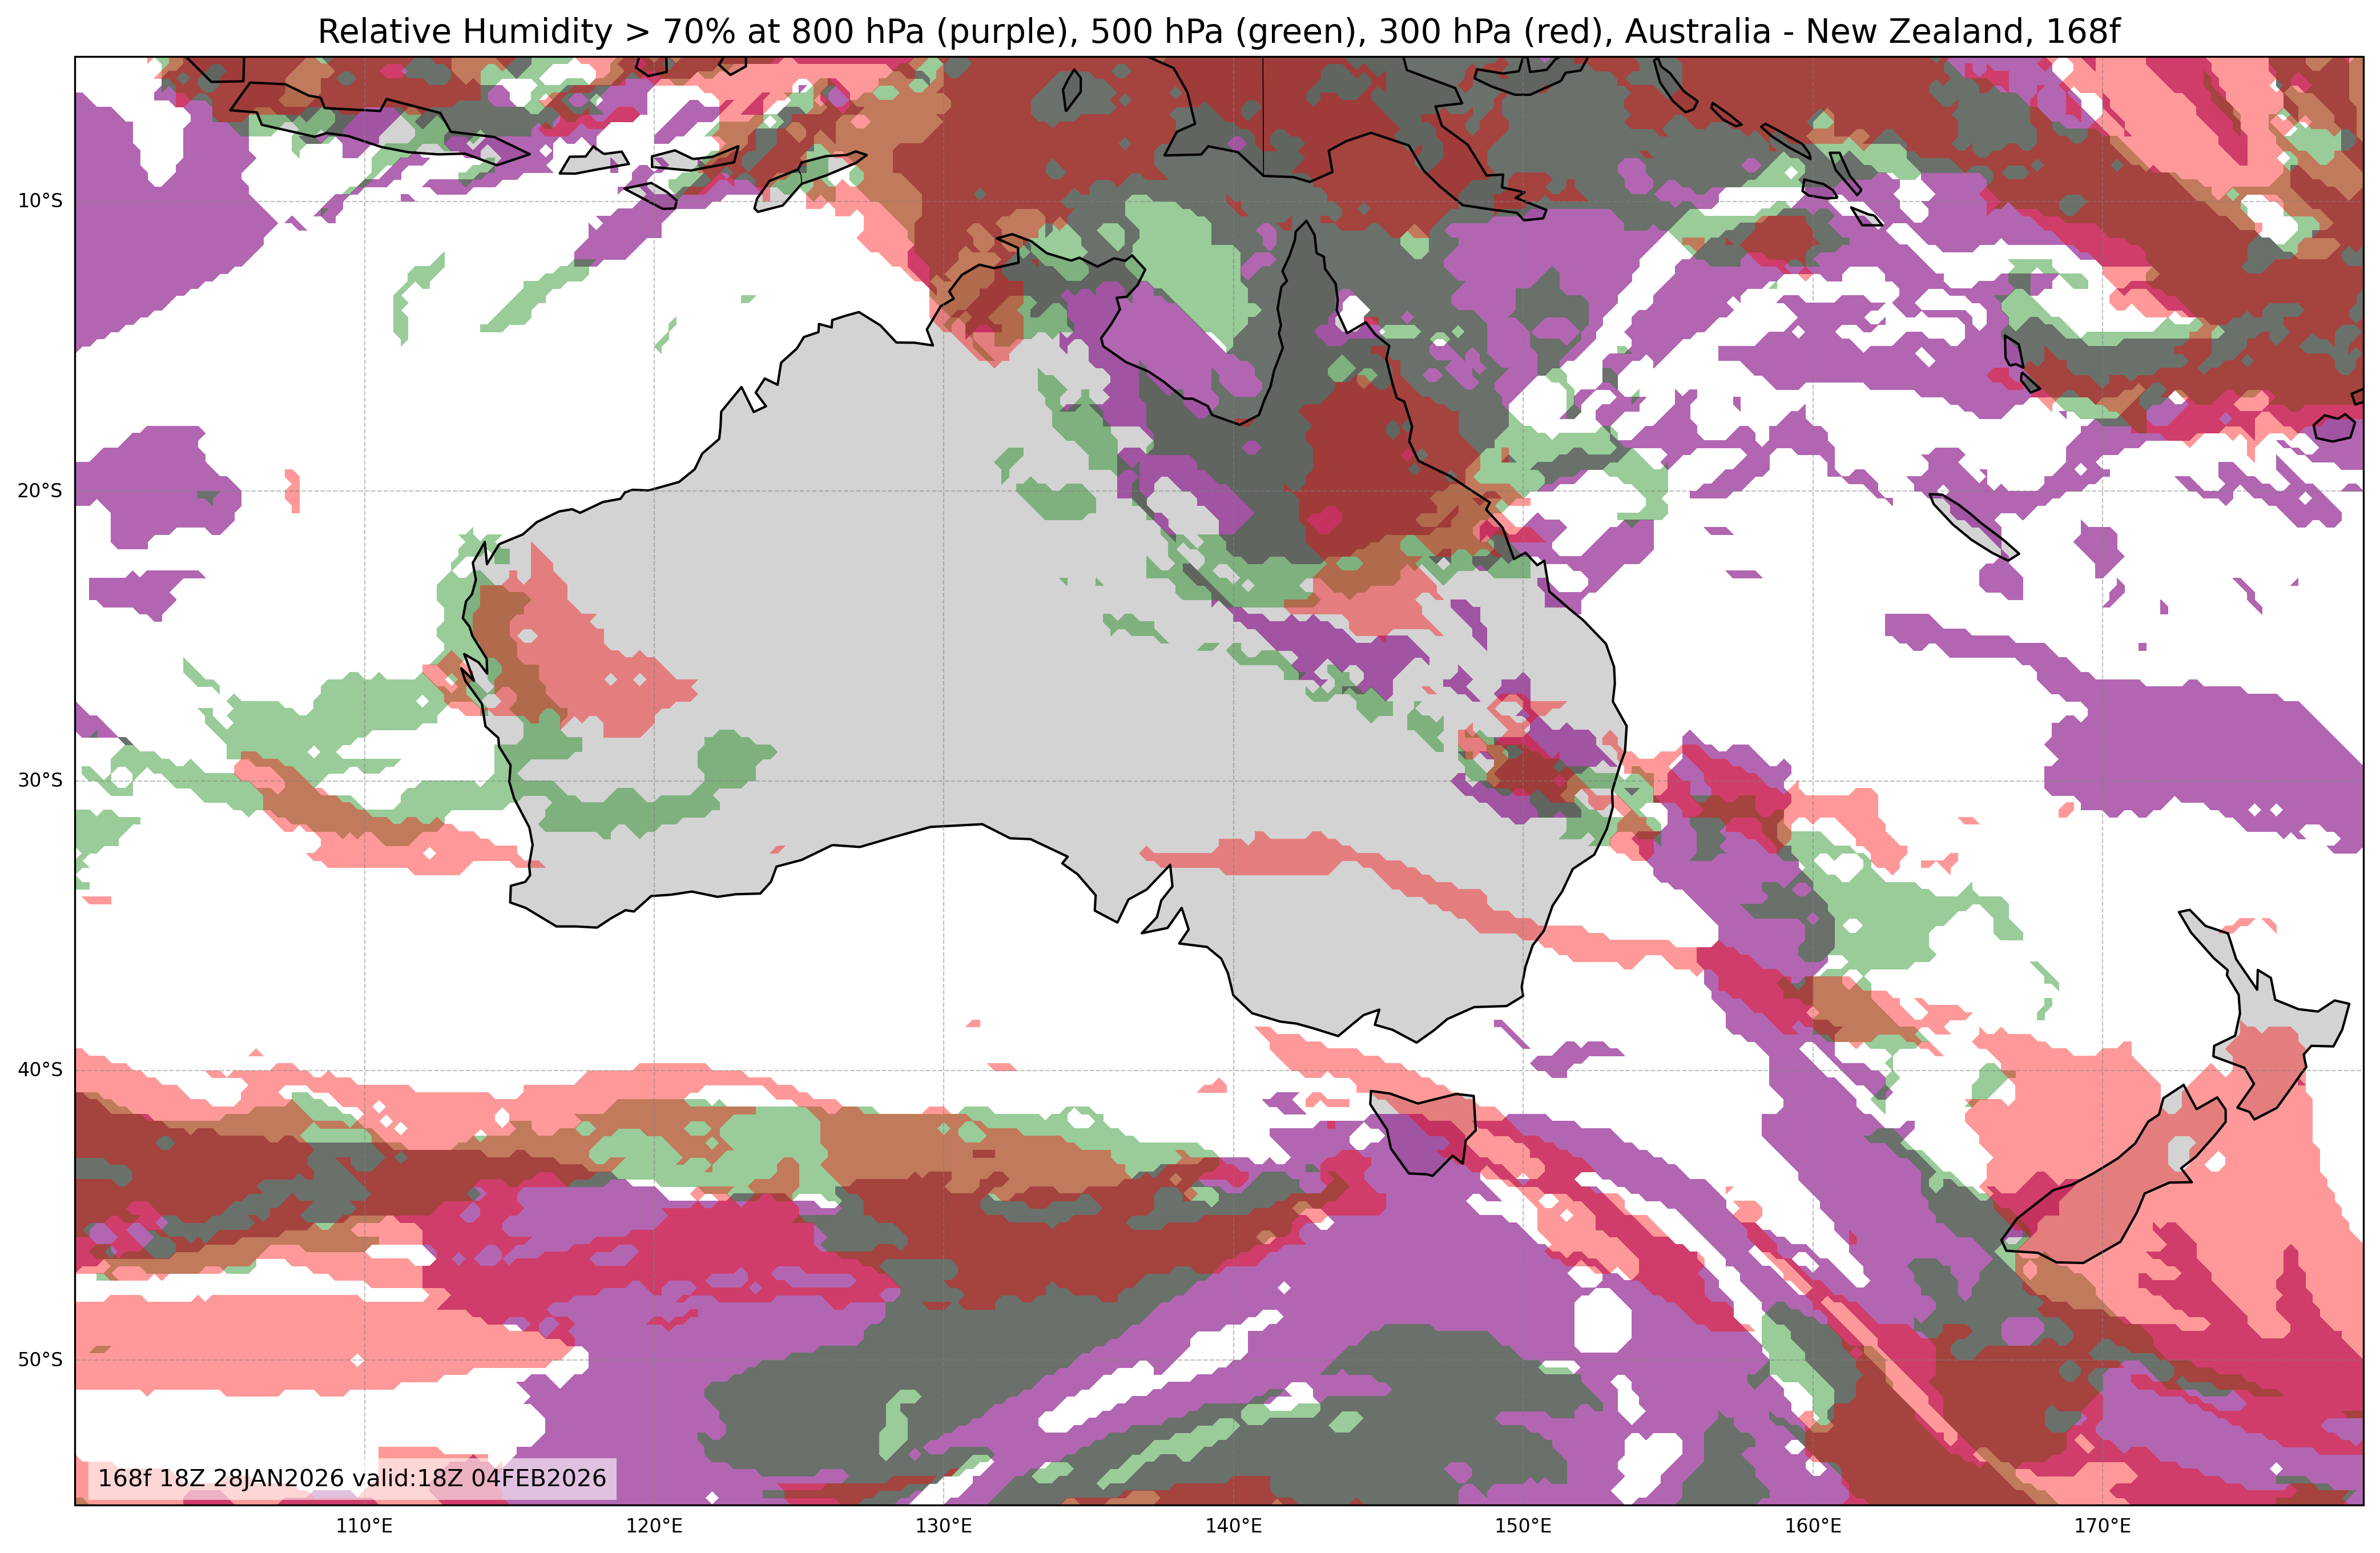
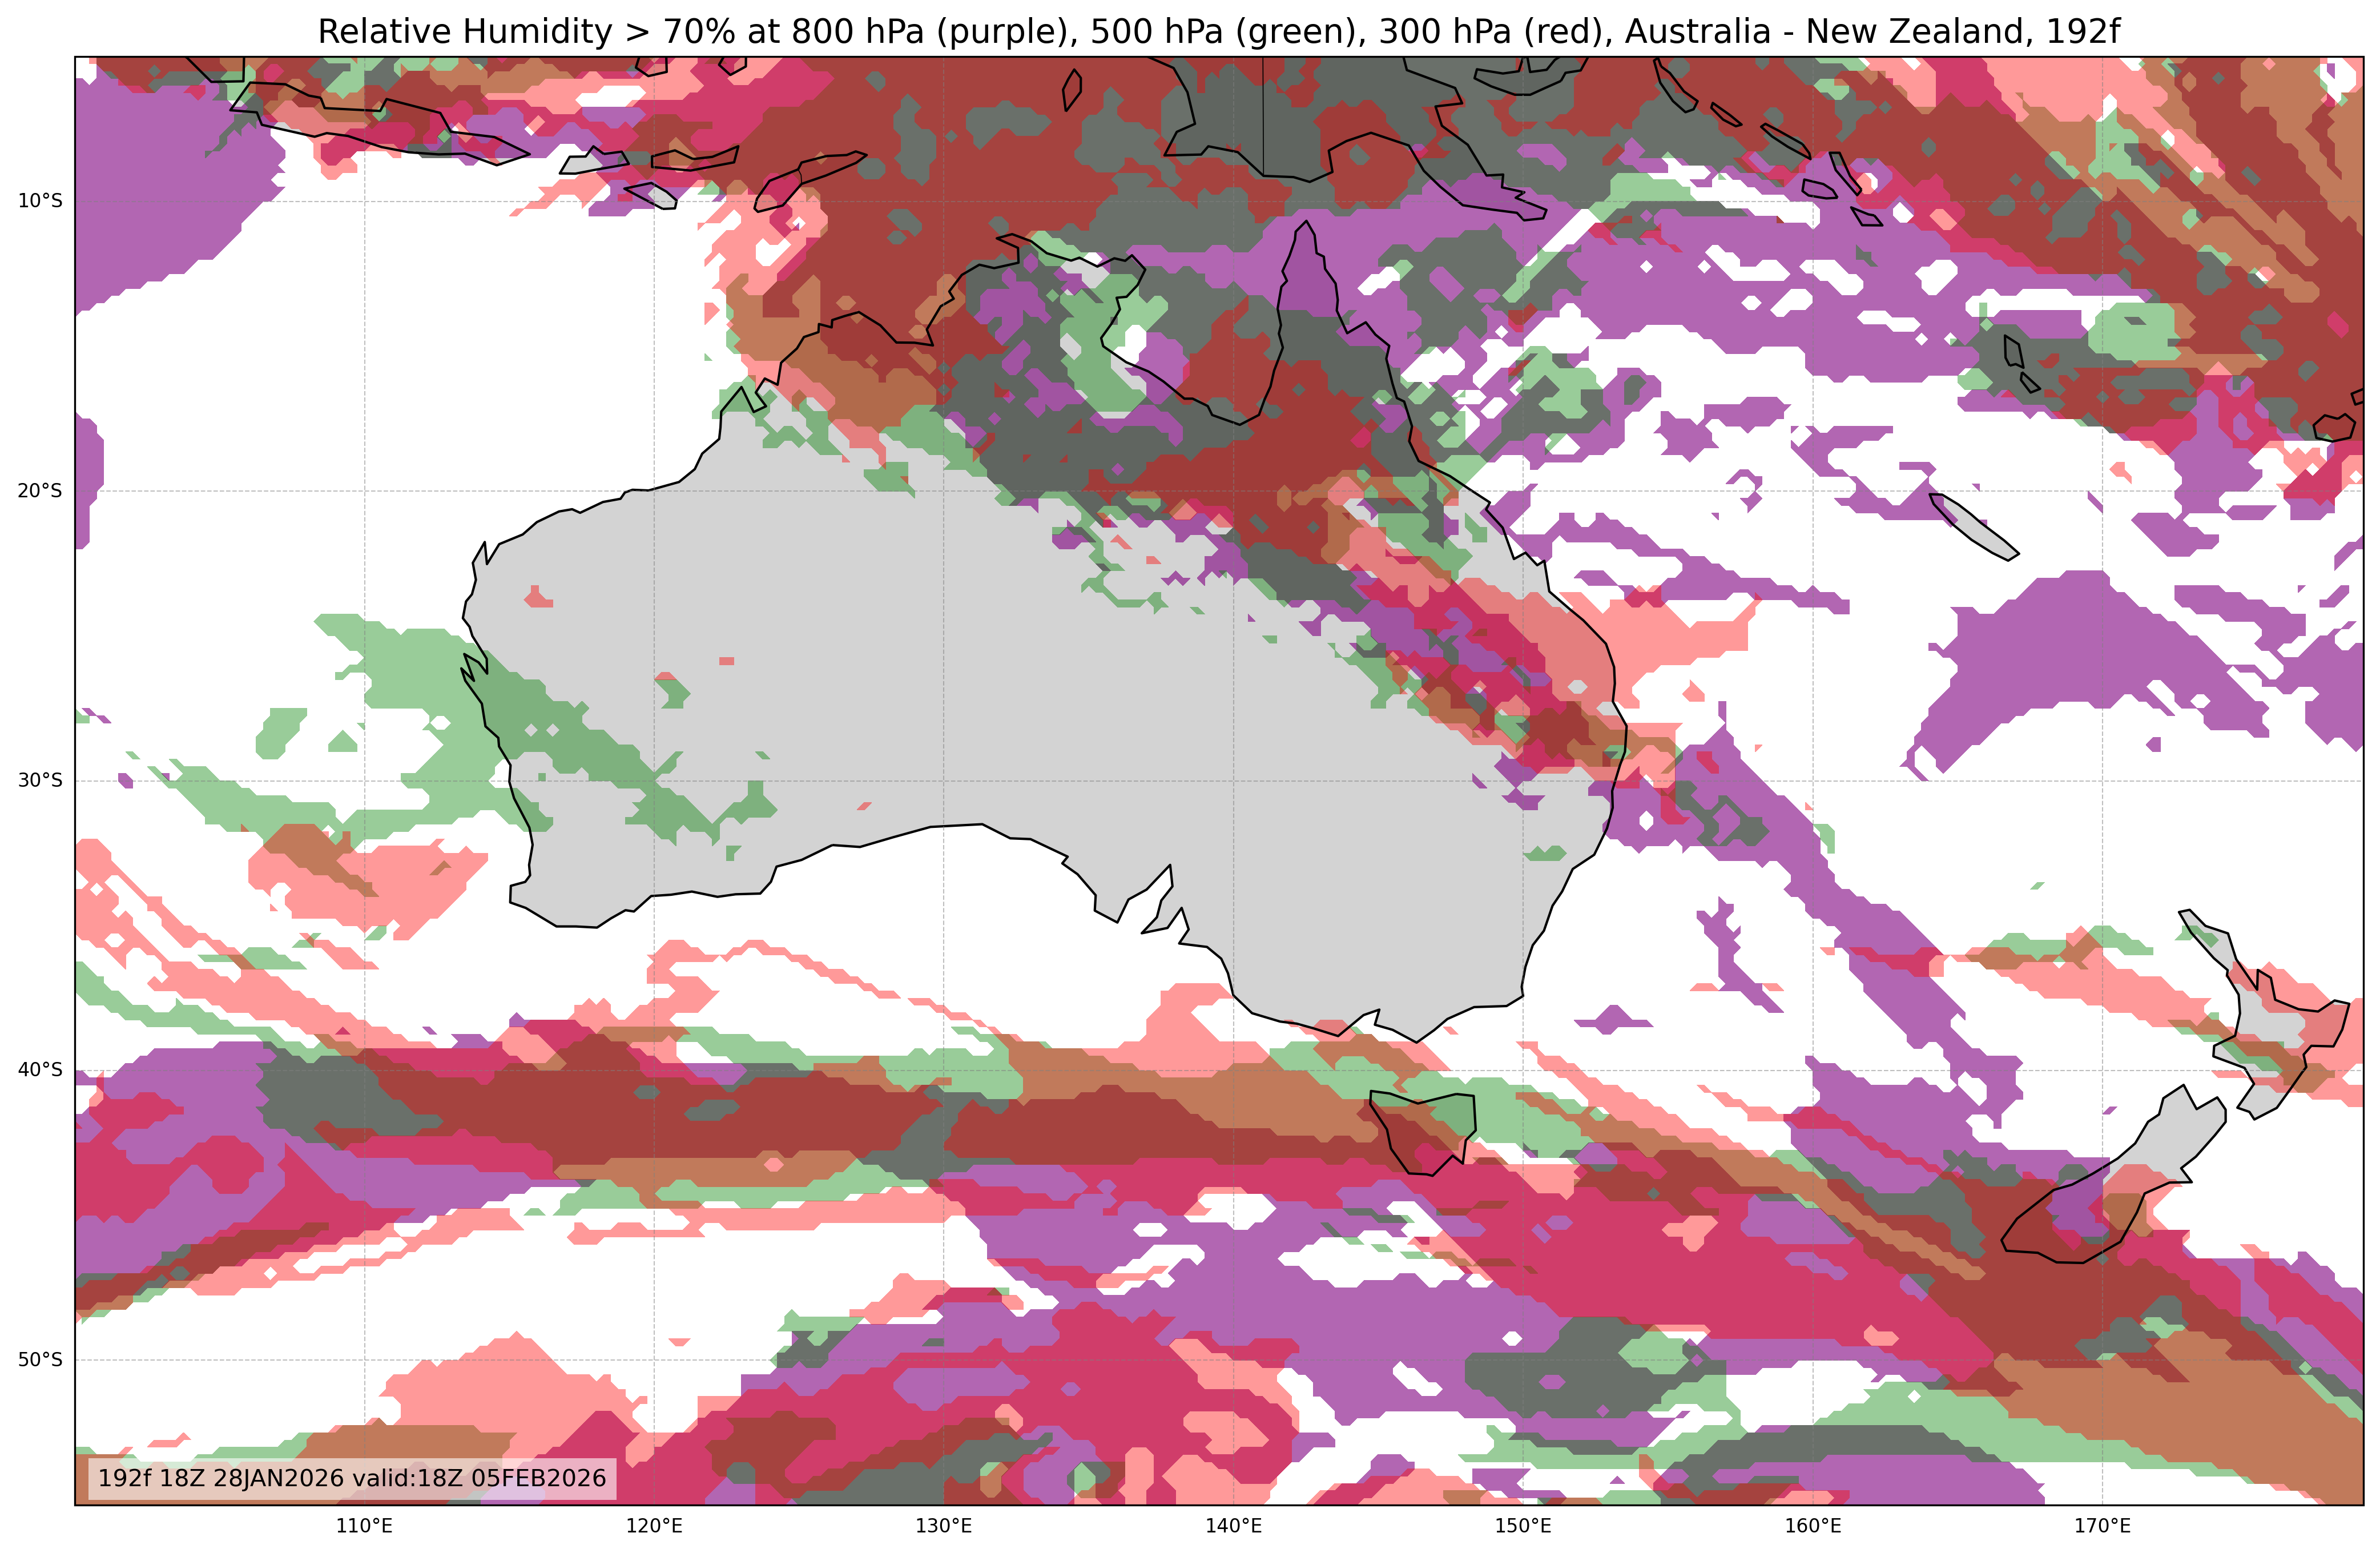
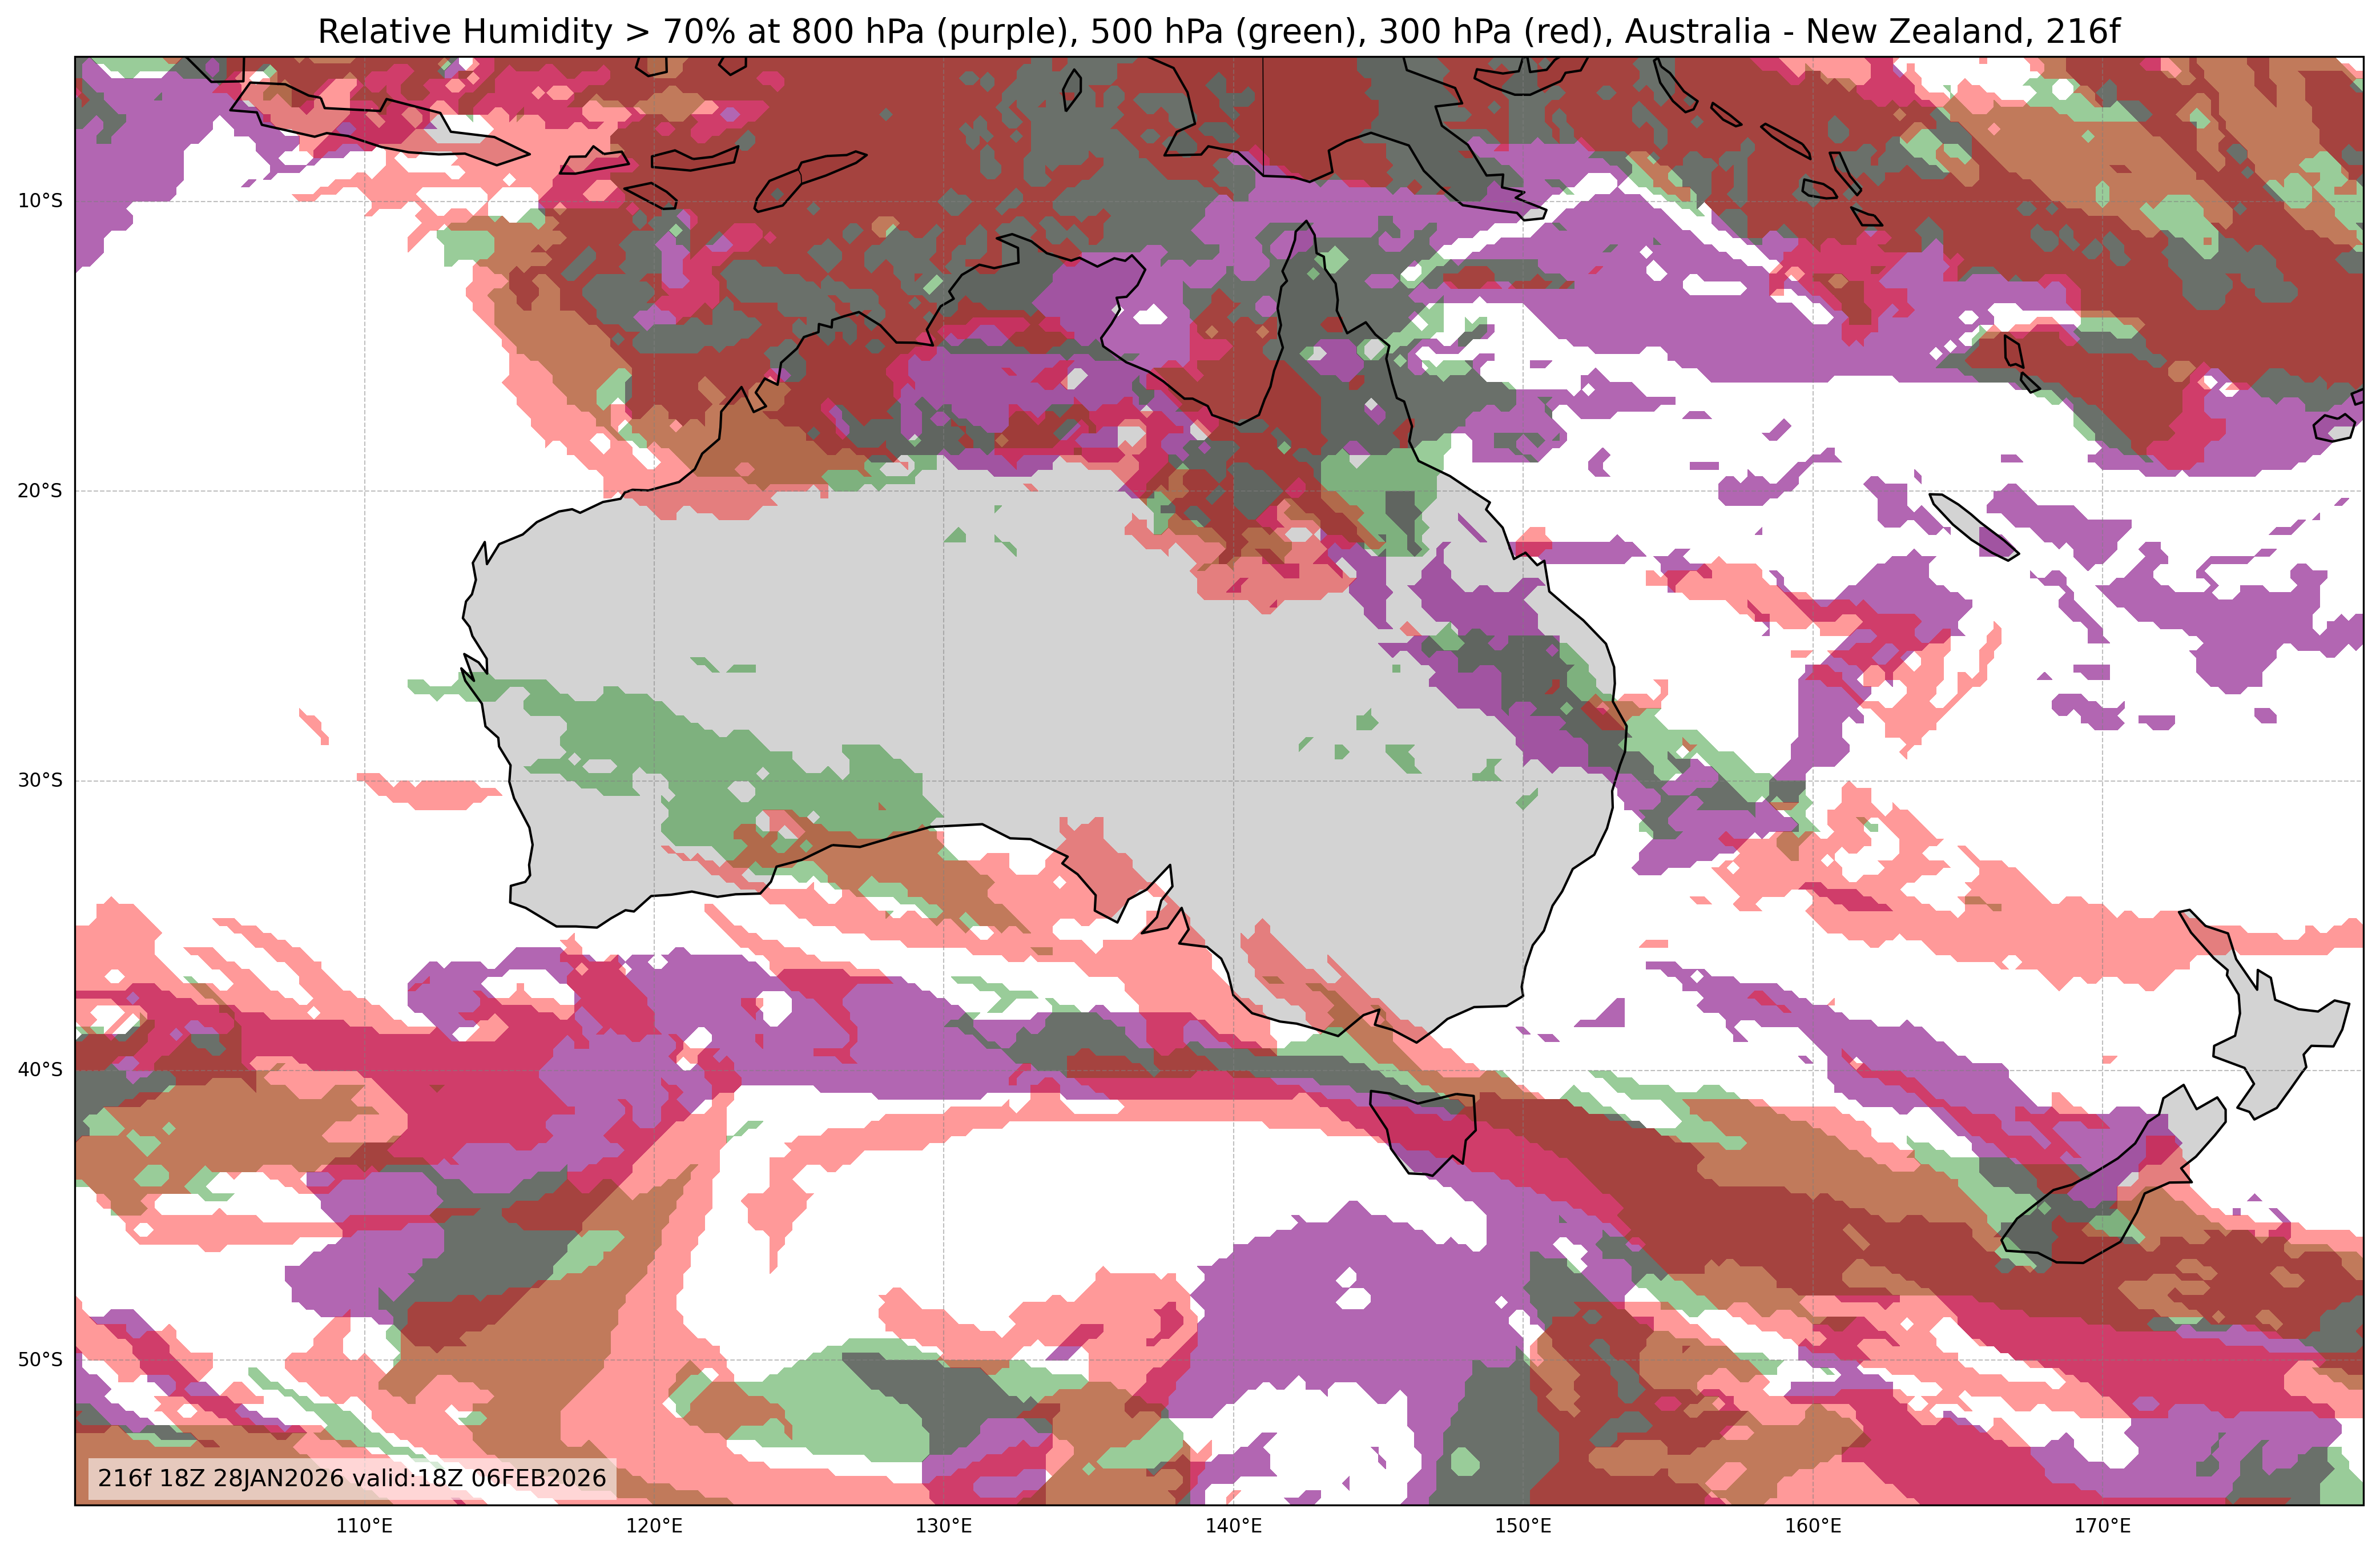
| Relative Humidity at 800, 500, & 300mb or Low, Middle, & High Cloud Cover |
All Times |
🔍 | 🔍 | 🔍 | 🔍 | 🔍 |
| Weather Map Images | Time: | Day 5 120 Hours |
Day 6 144 Hours |
Day 7 168 Hours |
Day 8 192 Hours |
Day 9 216 Hours |
| Field: | All Fields |
All Fields |
All Fields |
All Fields |
All Fields |
|
| 500mb Geopotential Height & Vorticity |
All Times |
🔍 | 🔍 | 🔍 | 🔍 | 🔍 |
| Sea Level Pressure & 1000-500mb Thickness |
All Times |
🔍 | 🔍 | 🔍 | 🔍 | 🔍 |
| 700 mb Vertical Velocity (mb/hr) | All Times |
🔍 | 🔍 | 🔍 | 🔍 | 🔍 |
| 850mb Temperature Relative Humidity & Winds |
All Times |
🔍 | 🔍 | 🔍 | 🔍 | 🔍 |
| 200mb Streamlines & Isotachs |
All Times |
🔍 | 🔍 | 🔍 | 🔍 | 🔍 |
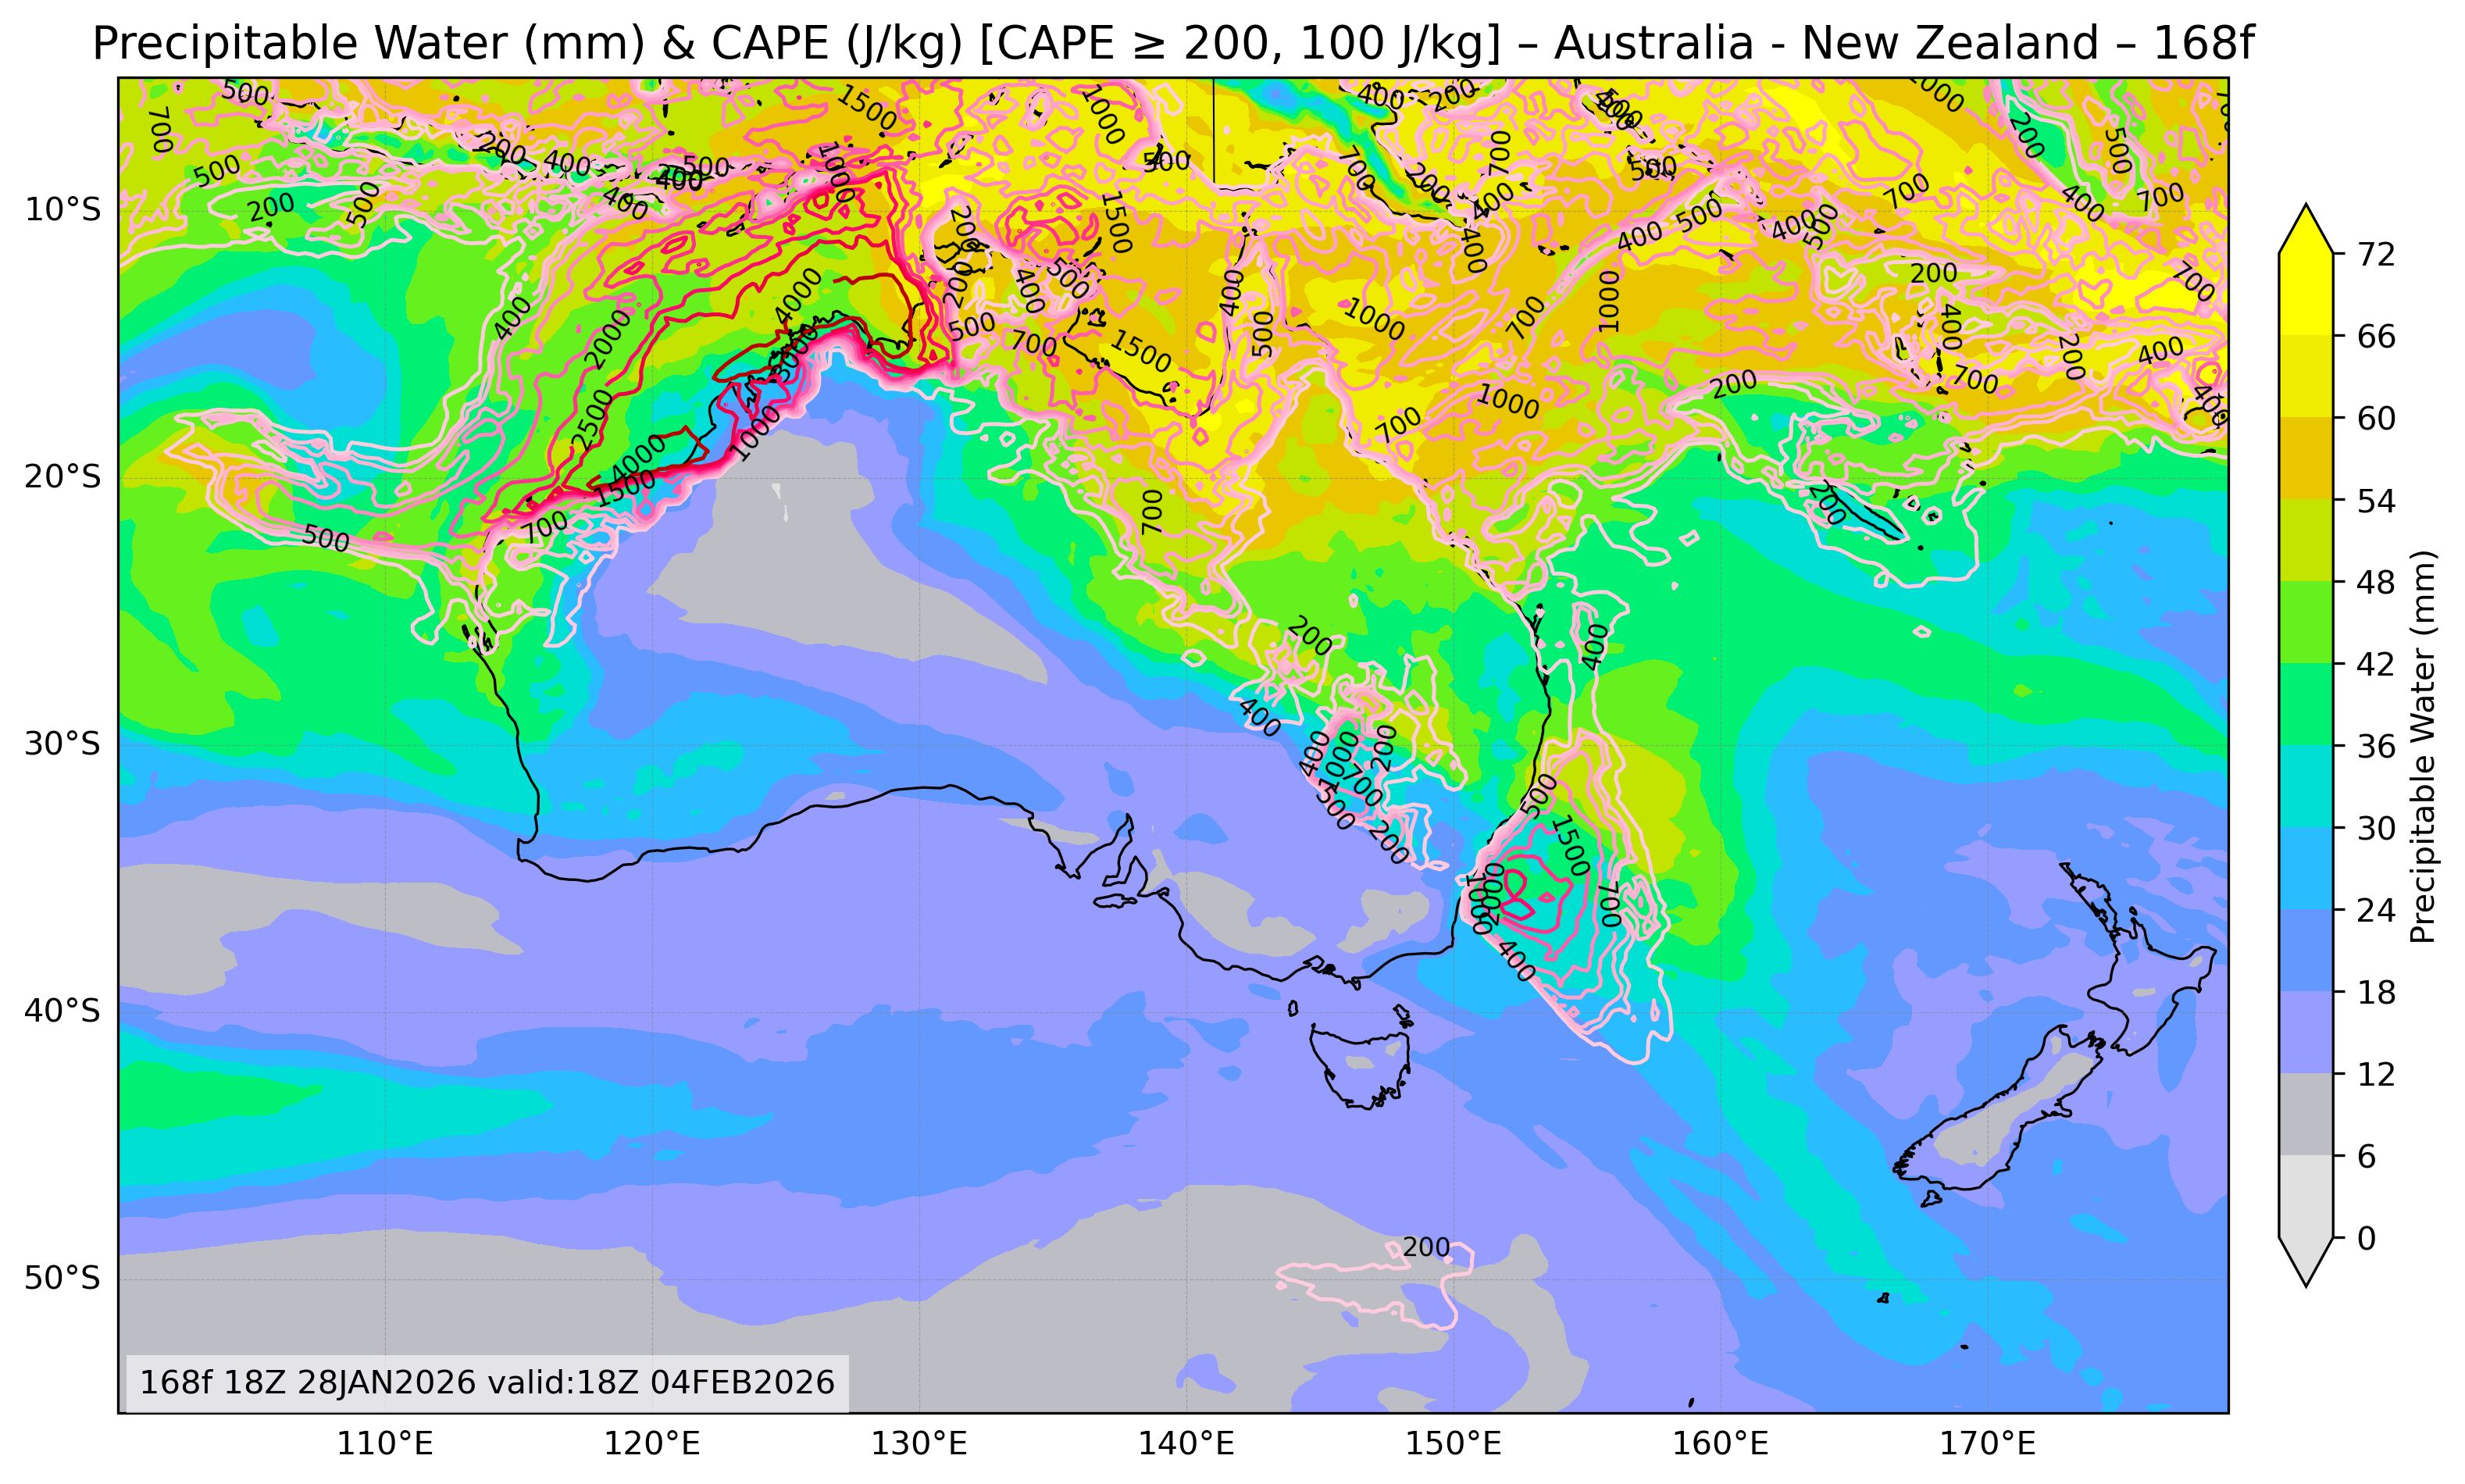
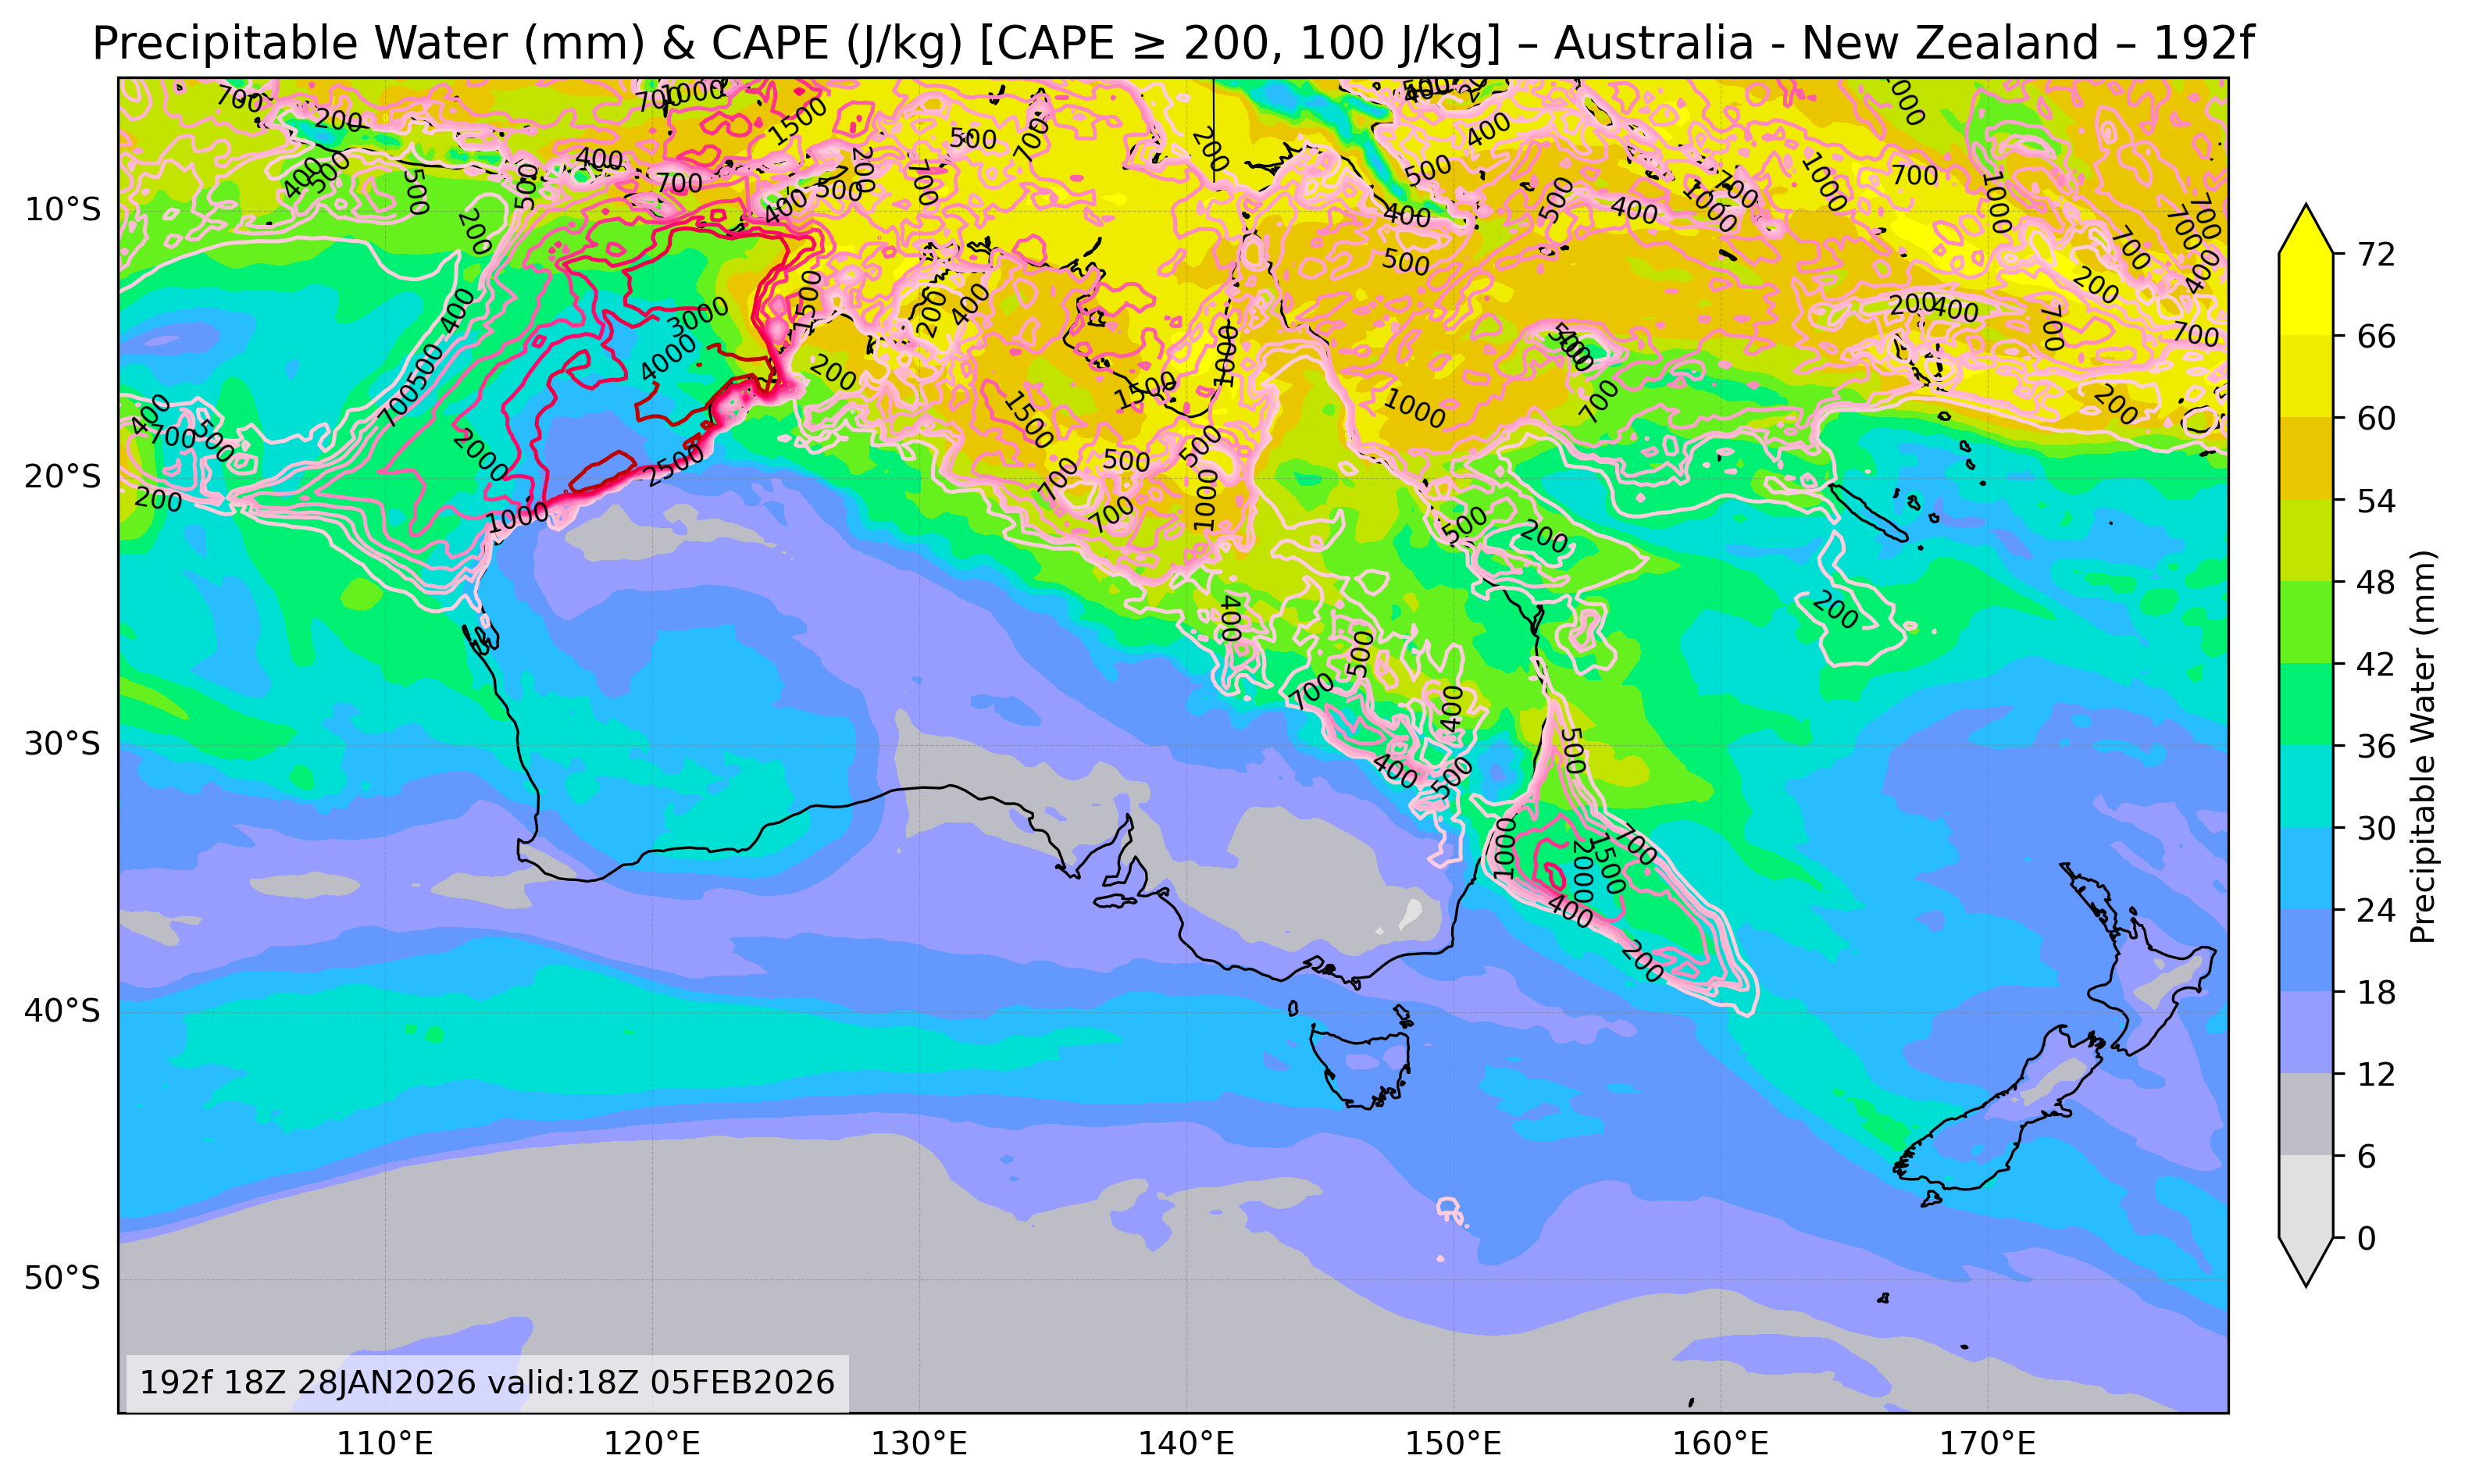
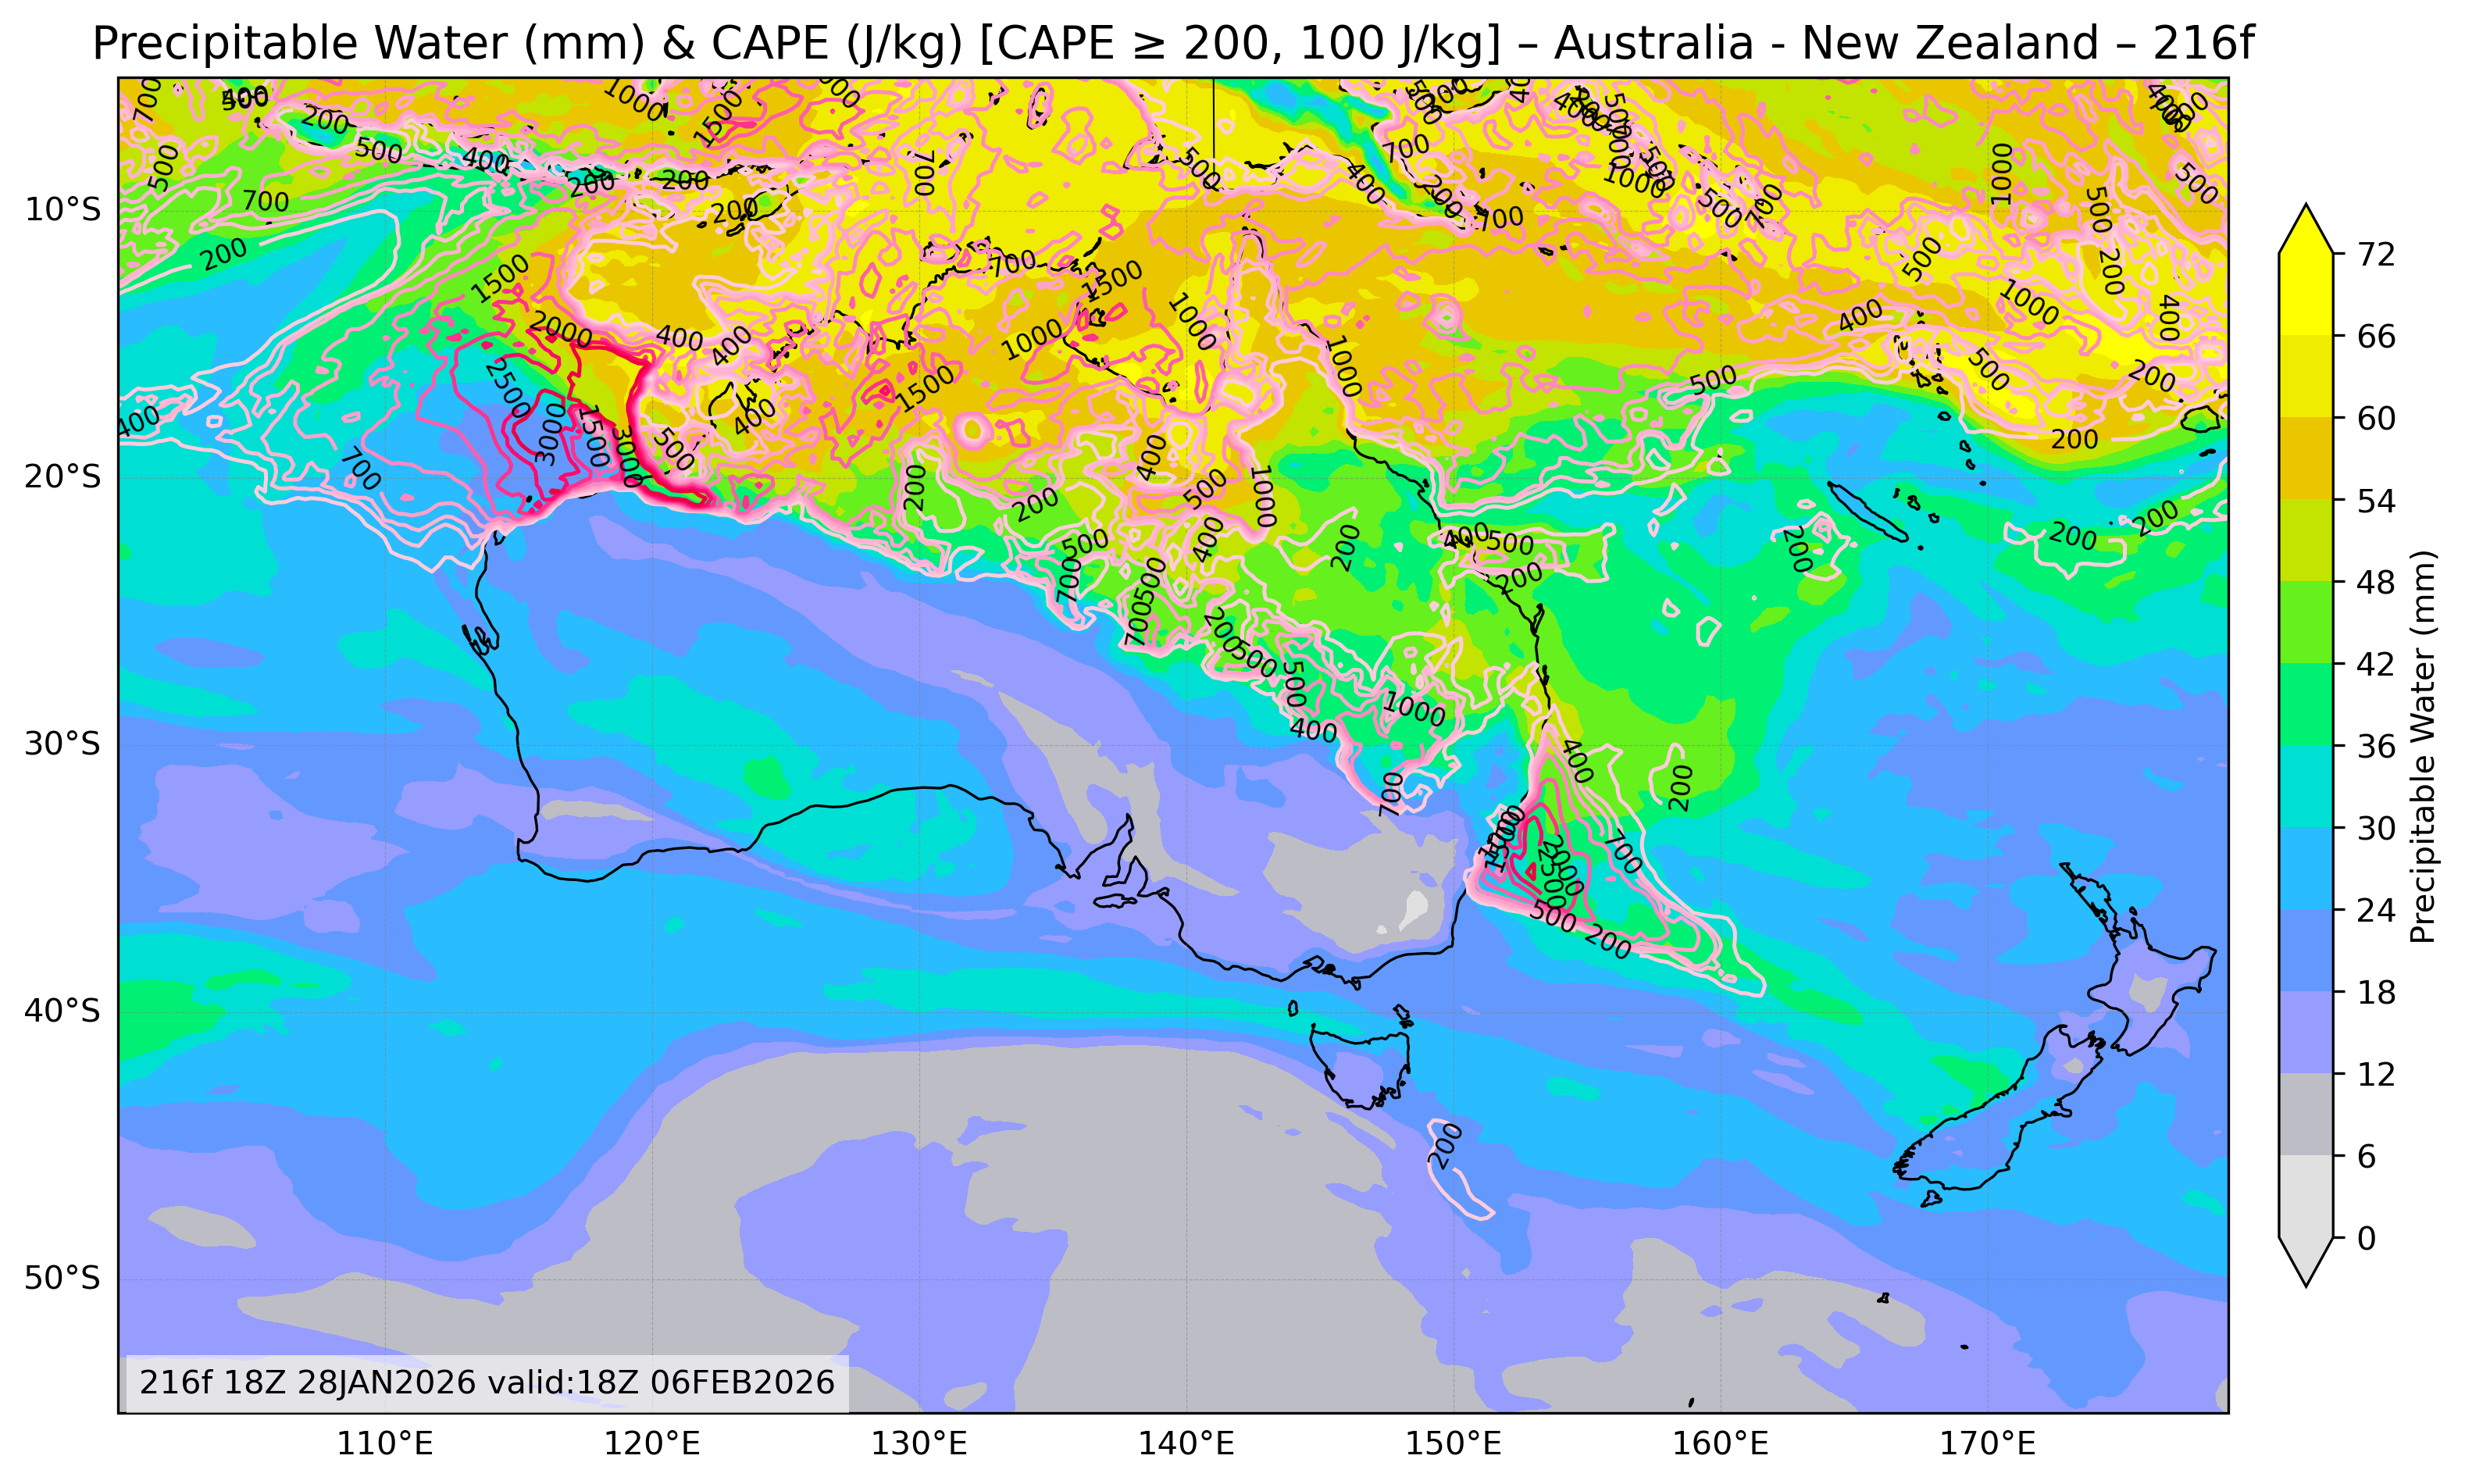
| Precipitable Water & Convective Available Potential Energy |
All Times |
🔍 | 🔍 | 🔍 | 🔍 | 🔍 |
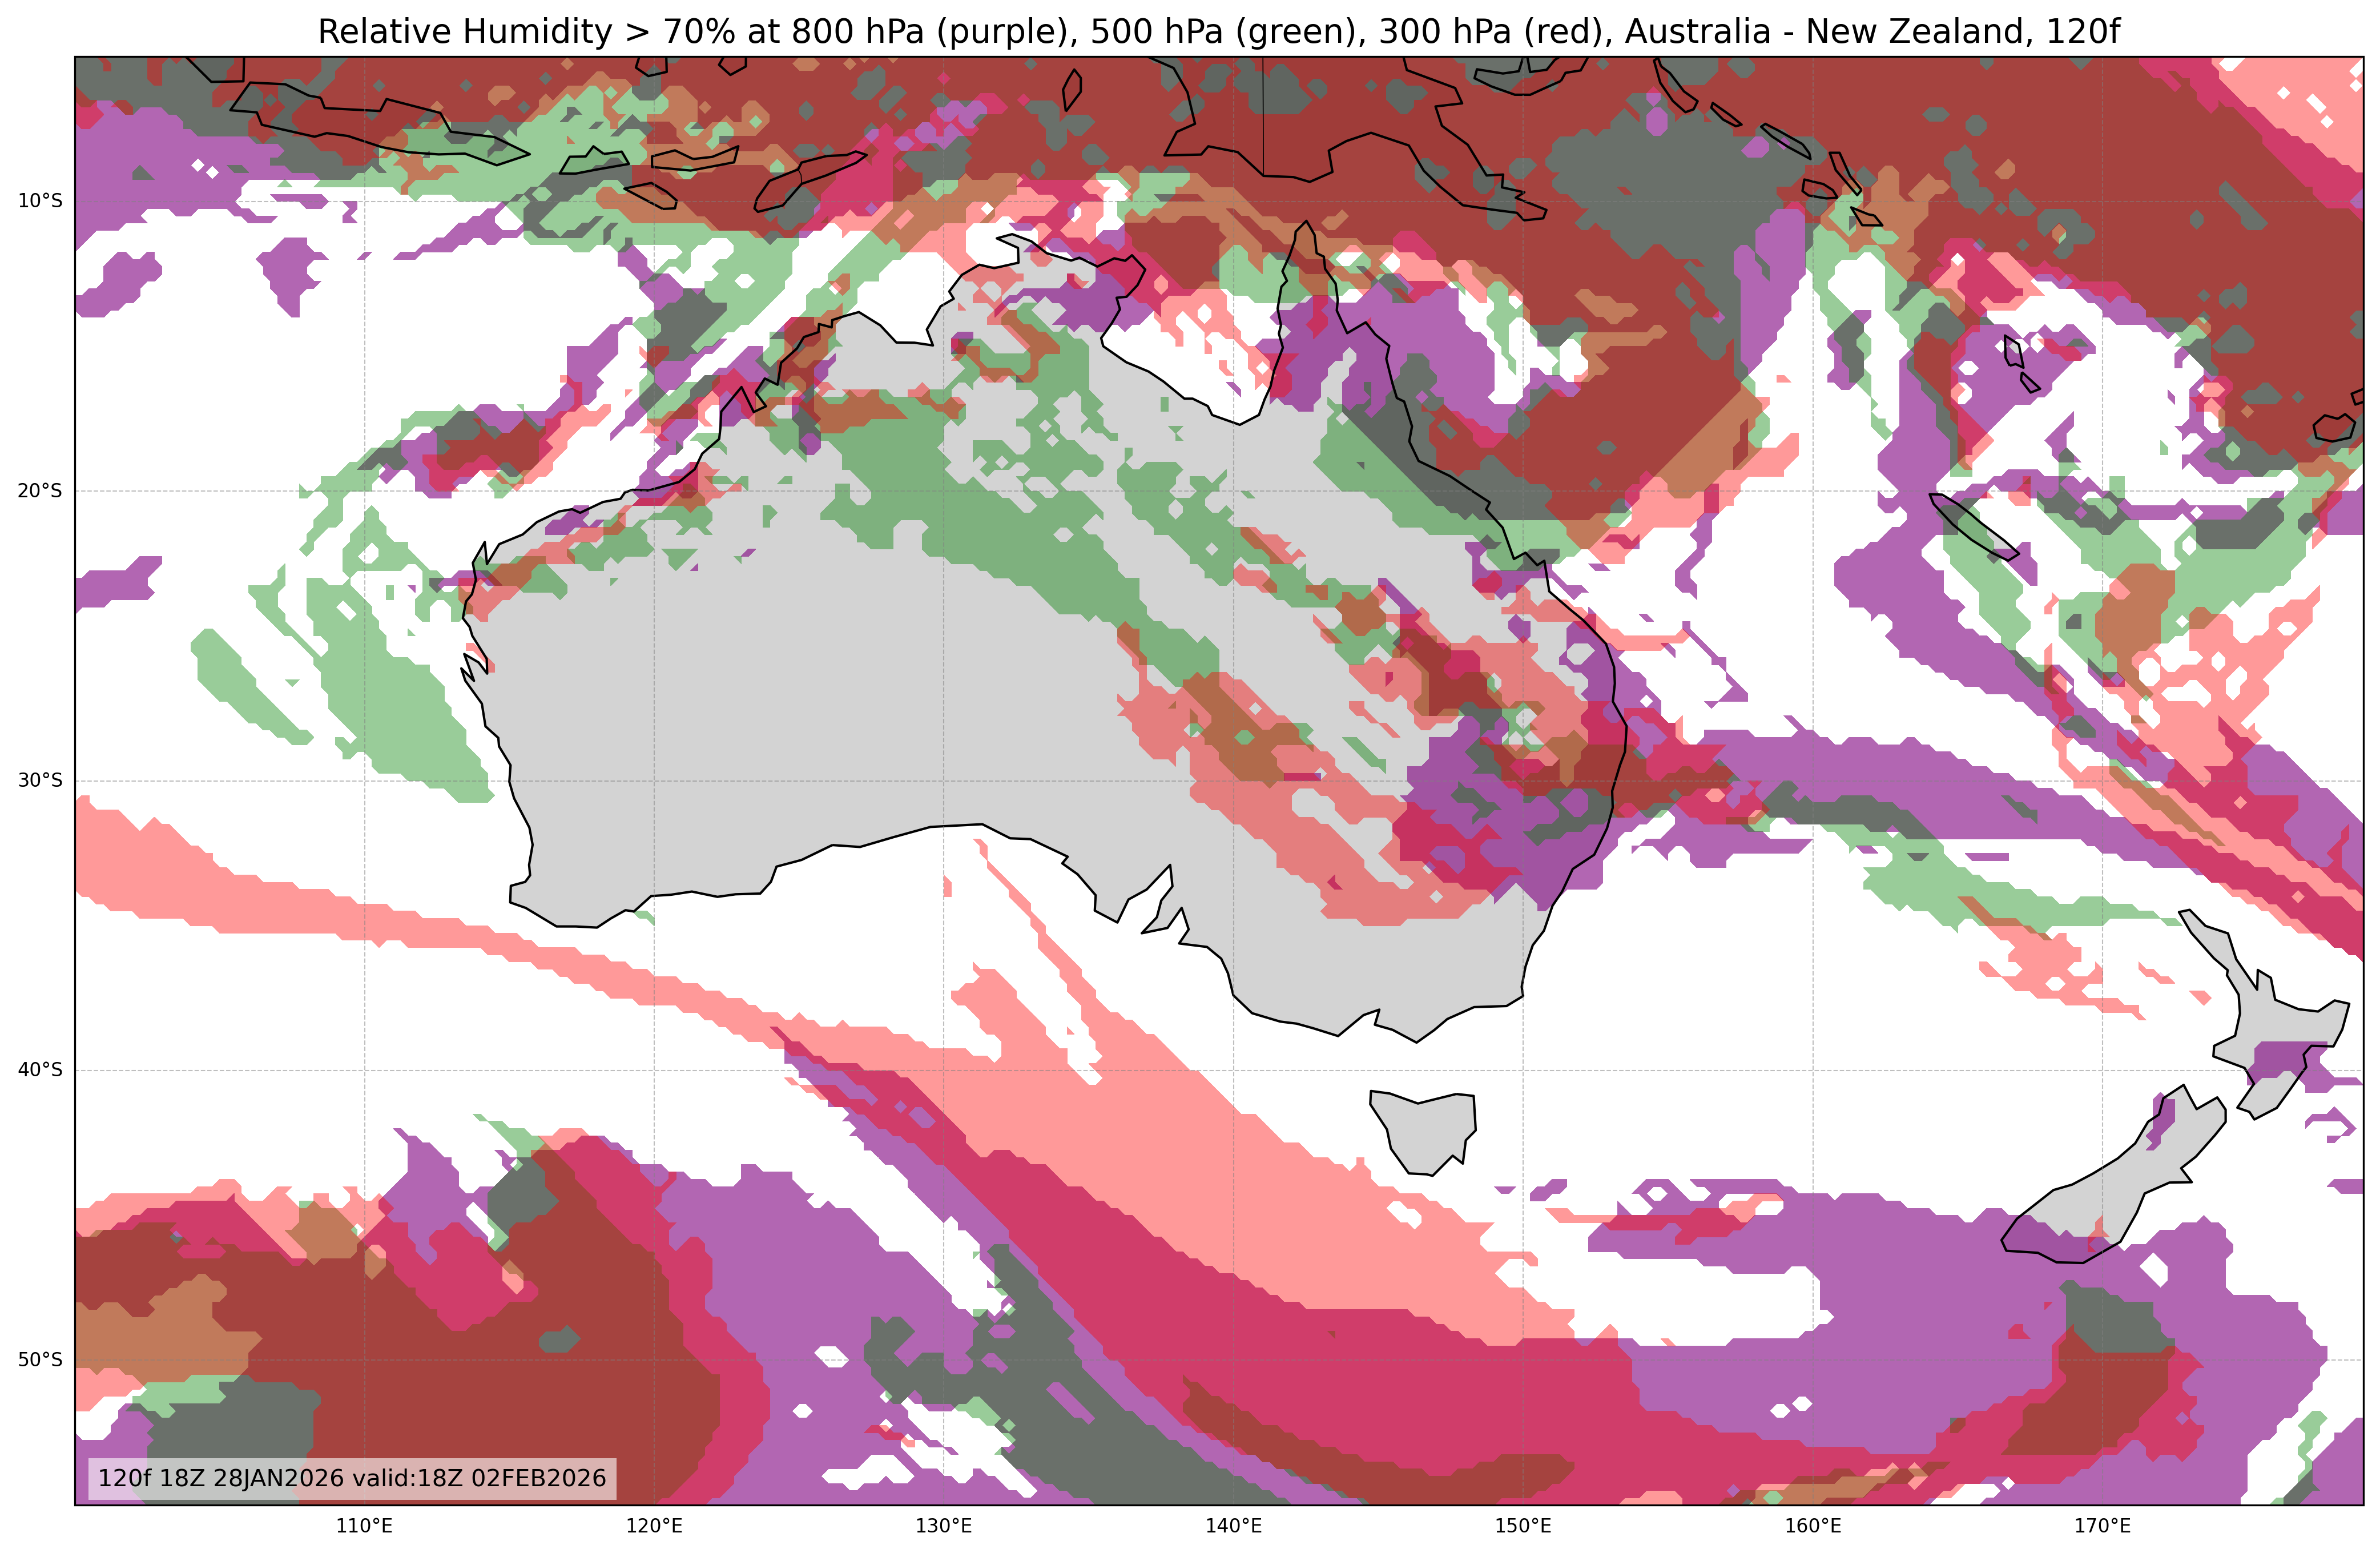
| Relative Humidity at 800, 500, & 300mb or Low, Middle, & High Cloud Cover |
All Times |
🔍 | 🔍 | 🔍 | 🔍 | 🔍 |
| Weather Map Images | Time: | Day 10 240 Hours |
Day 11 264 Hours |
Day 12 288 Hours |
Day 13 312 Hours |
Day 14 336 Hours |
| Field: | All Fields |
All Fields |
All Fields |
All Fields |
All Fields |
|
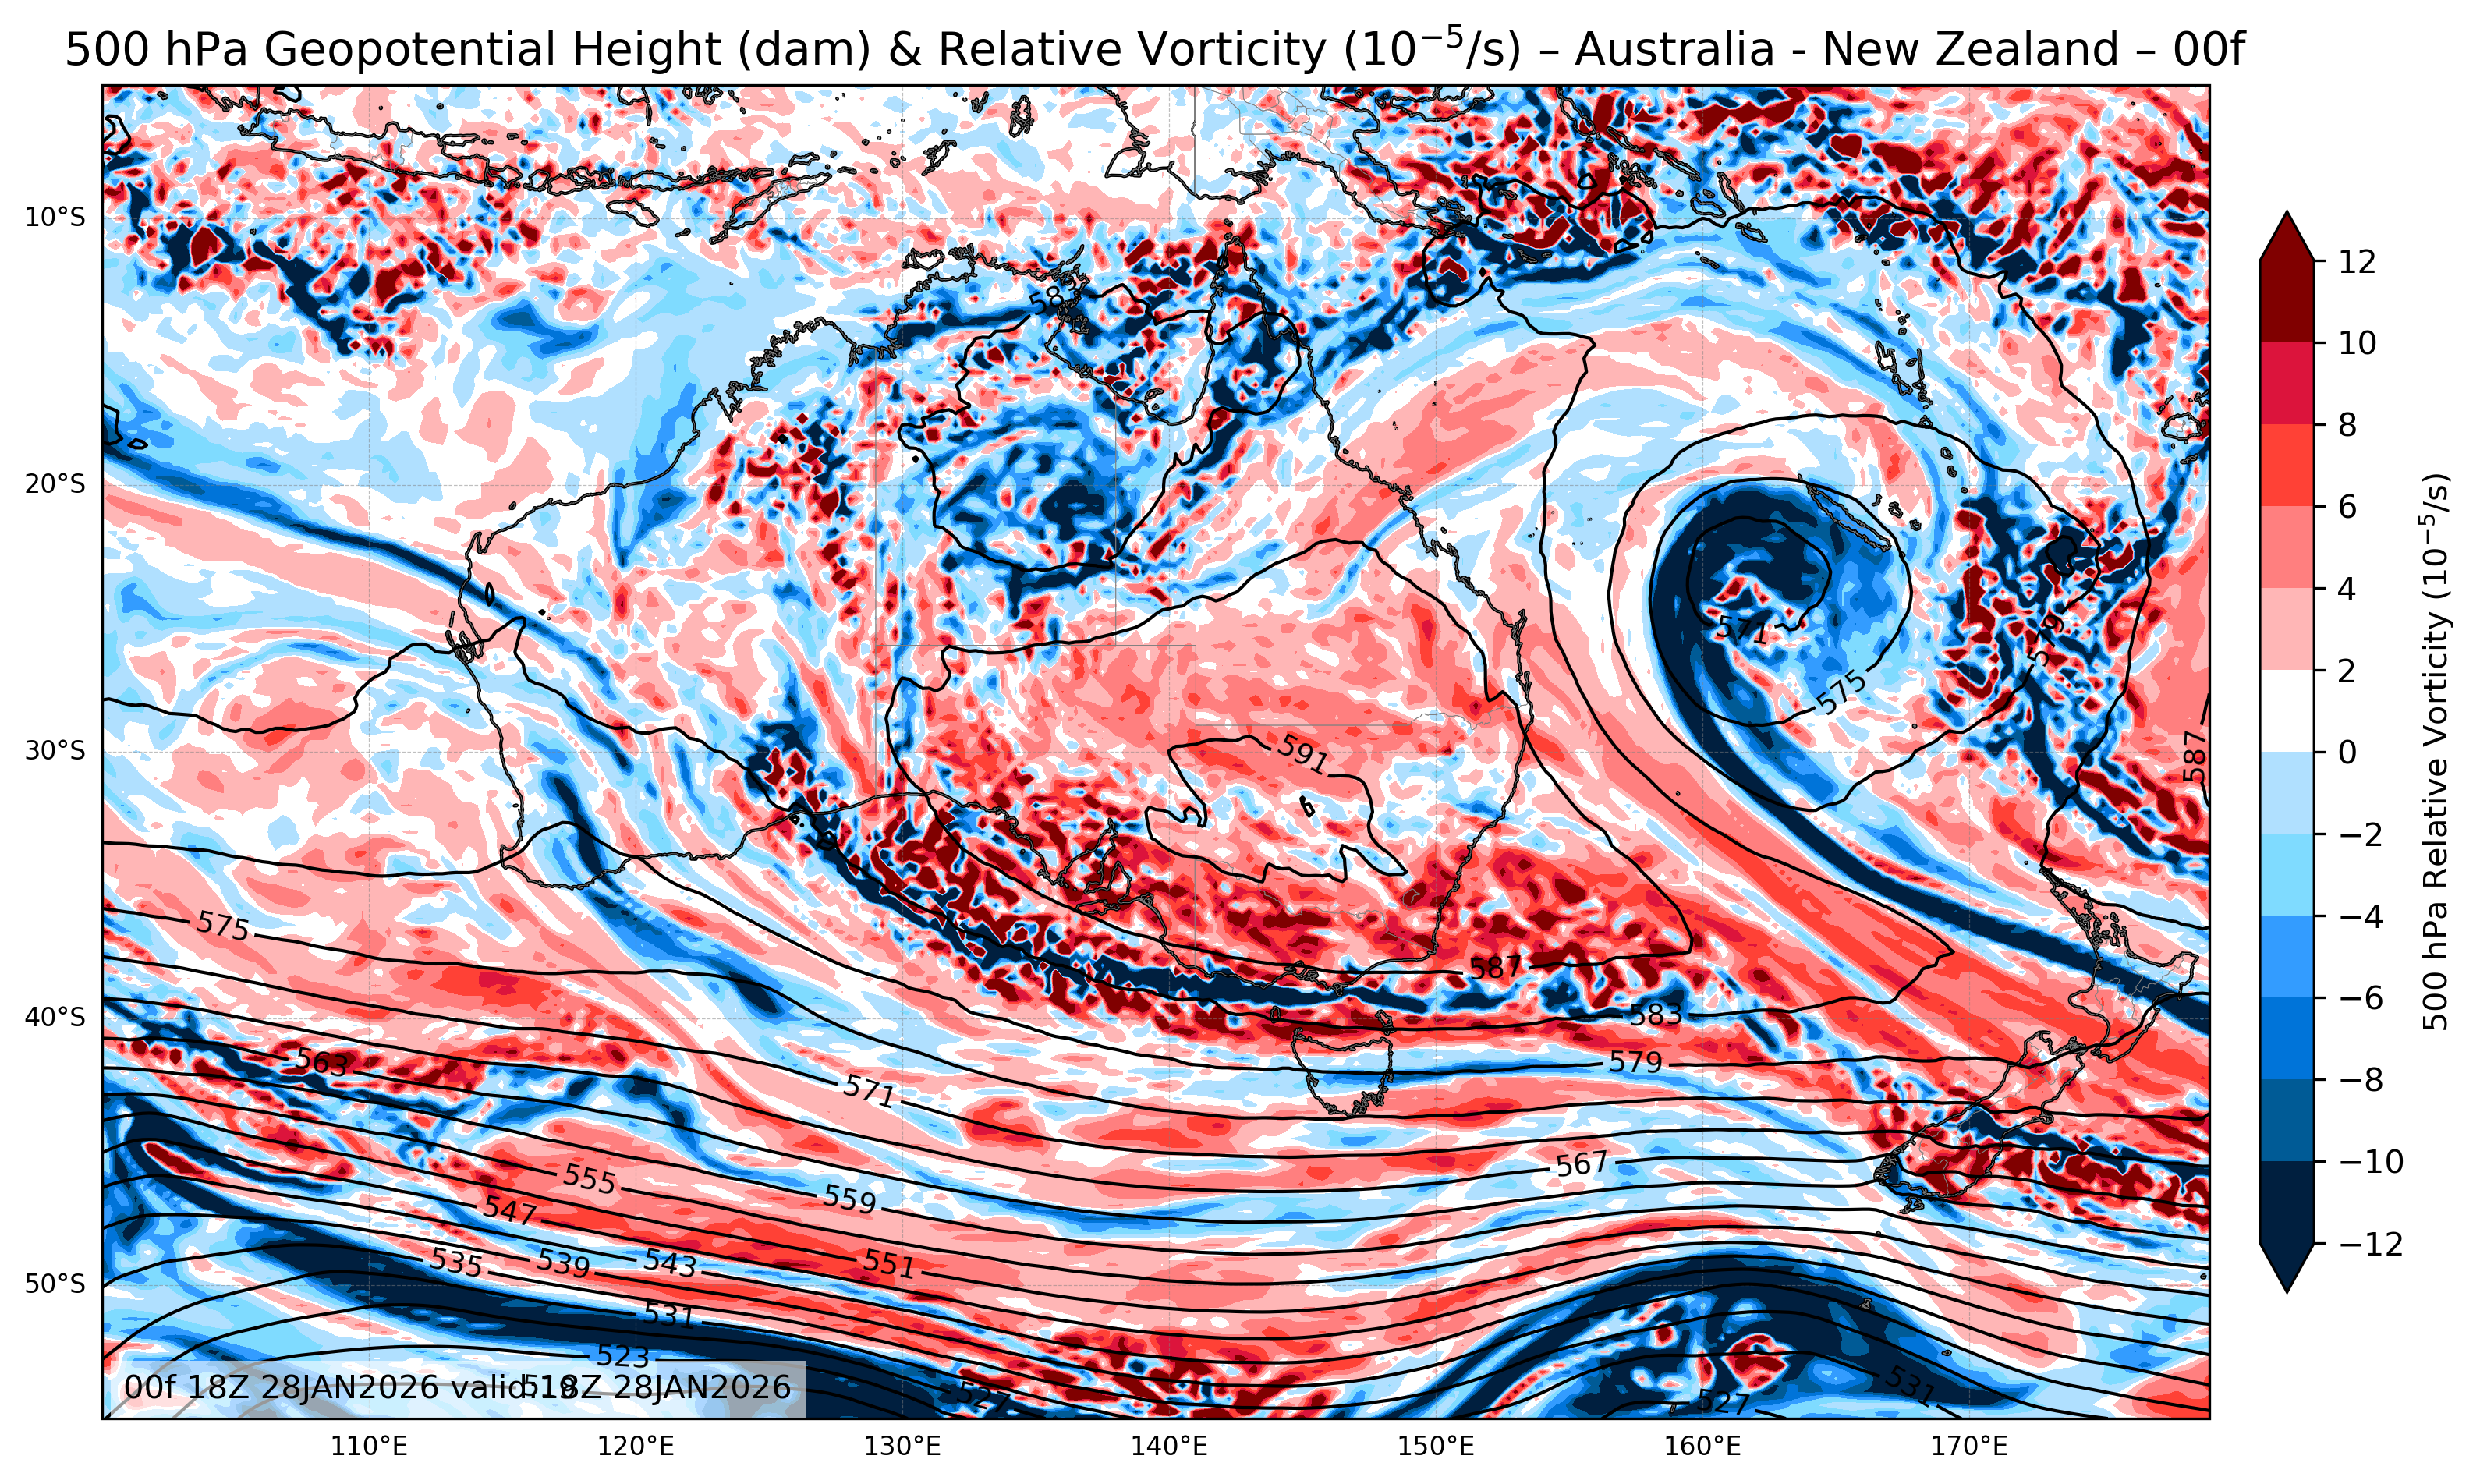
| 500mb Geopotential Height & Vorticity |
All Times |
🔍 | 🔍 | 🔍 | 🔍 | 🔍 |
| Sea Level Pressure & 1000-500mb Thickness |
All Times |
🔍 | 🔍 | 🔍 | 🔍 | 🔍 |
| 700 mb Vertical Velocity (mb/hr) | All Times |
🔍 | 🔍 | 🔍 | 🔍 | 🔍 |
| 850mb Temperature Relative Humidity & Winds |
All Times |
🔍 | 🔍 | 🔍 | 🔍 | 🔍 |
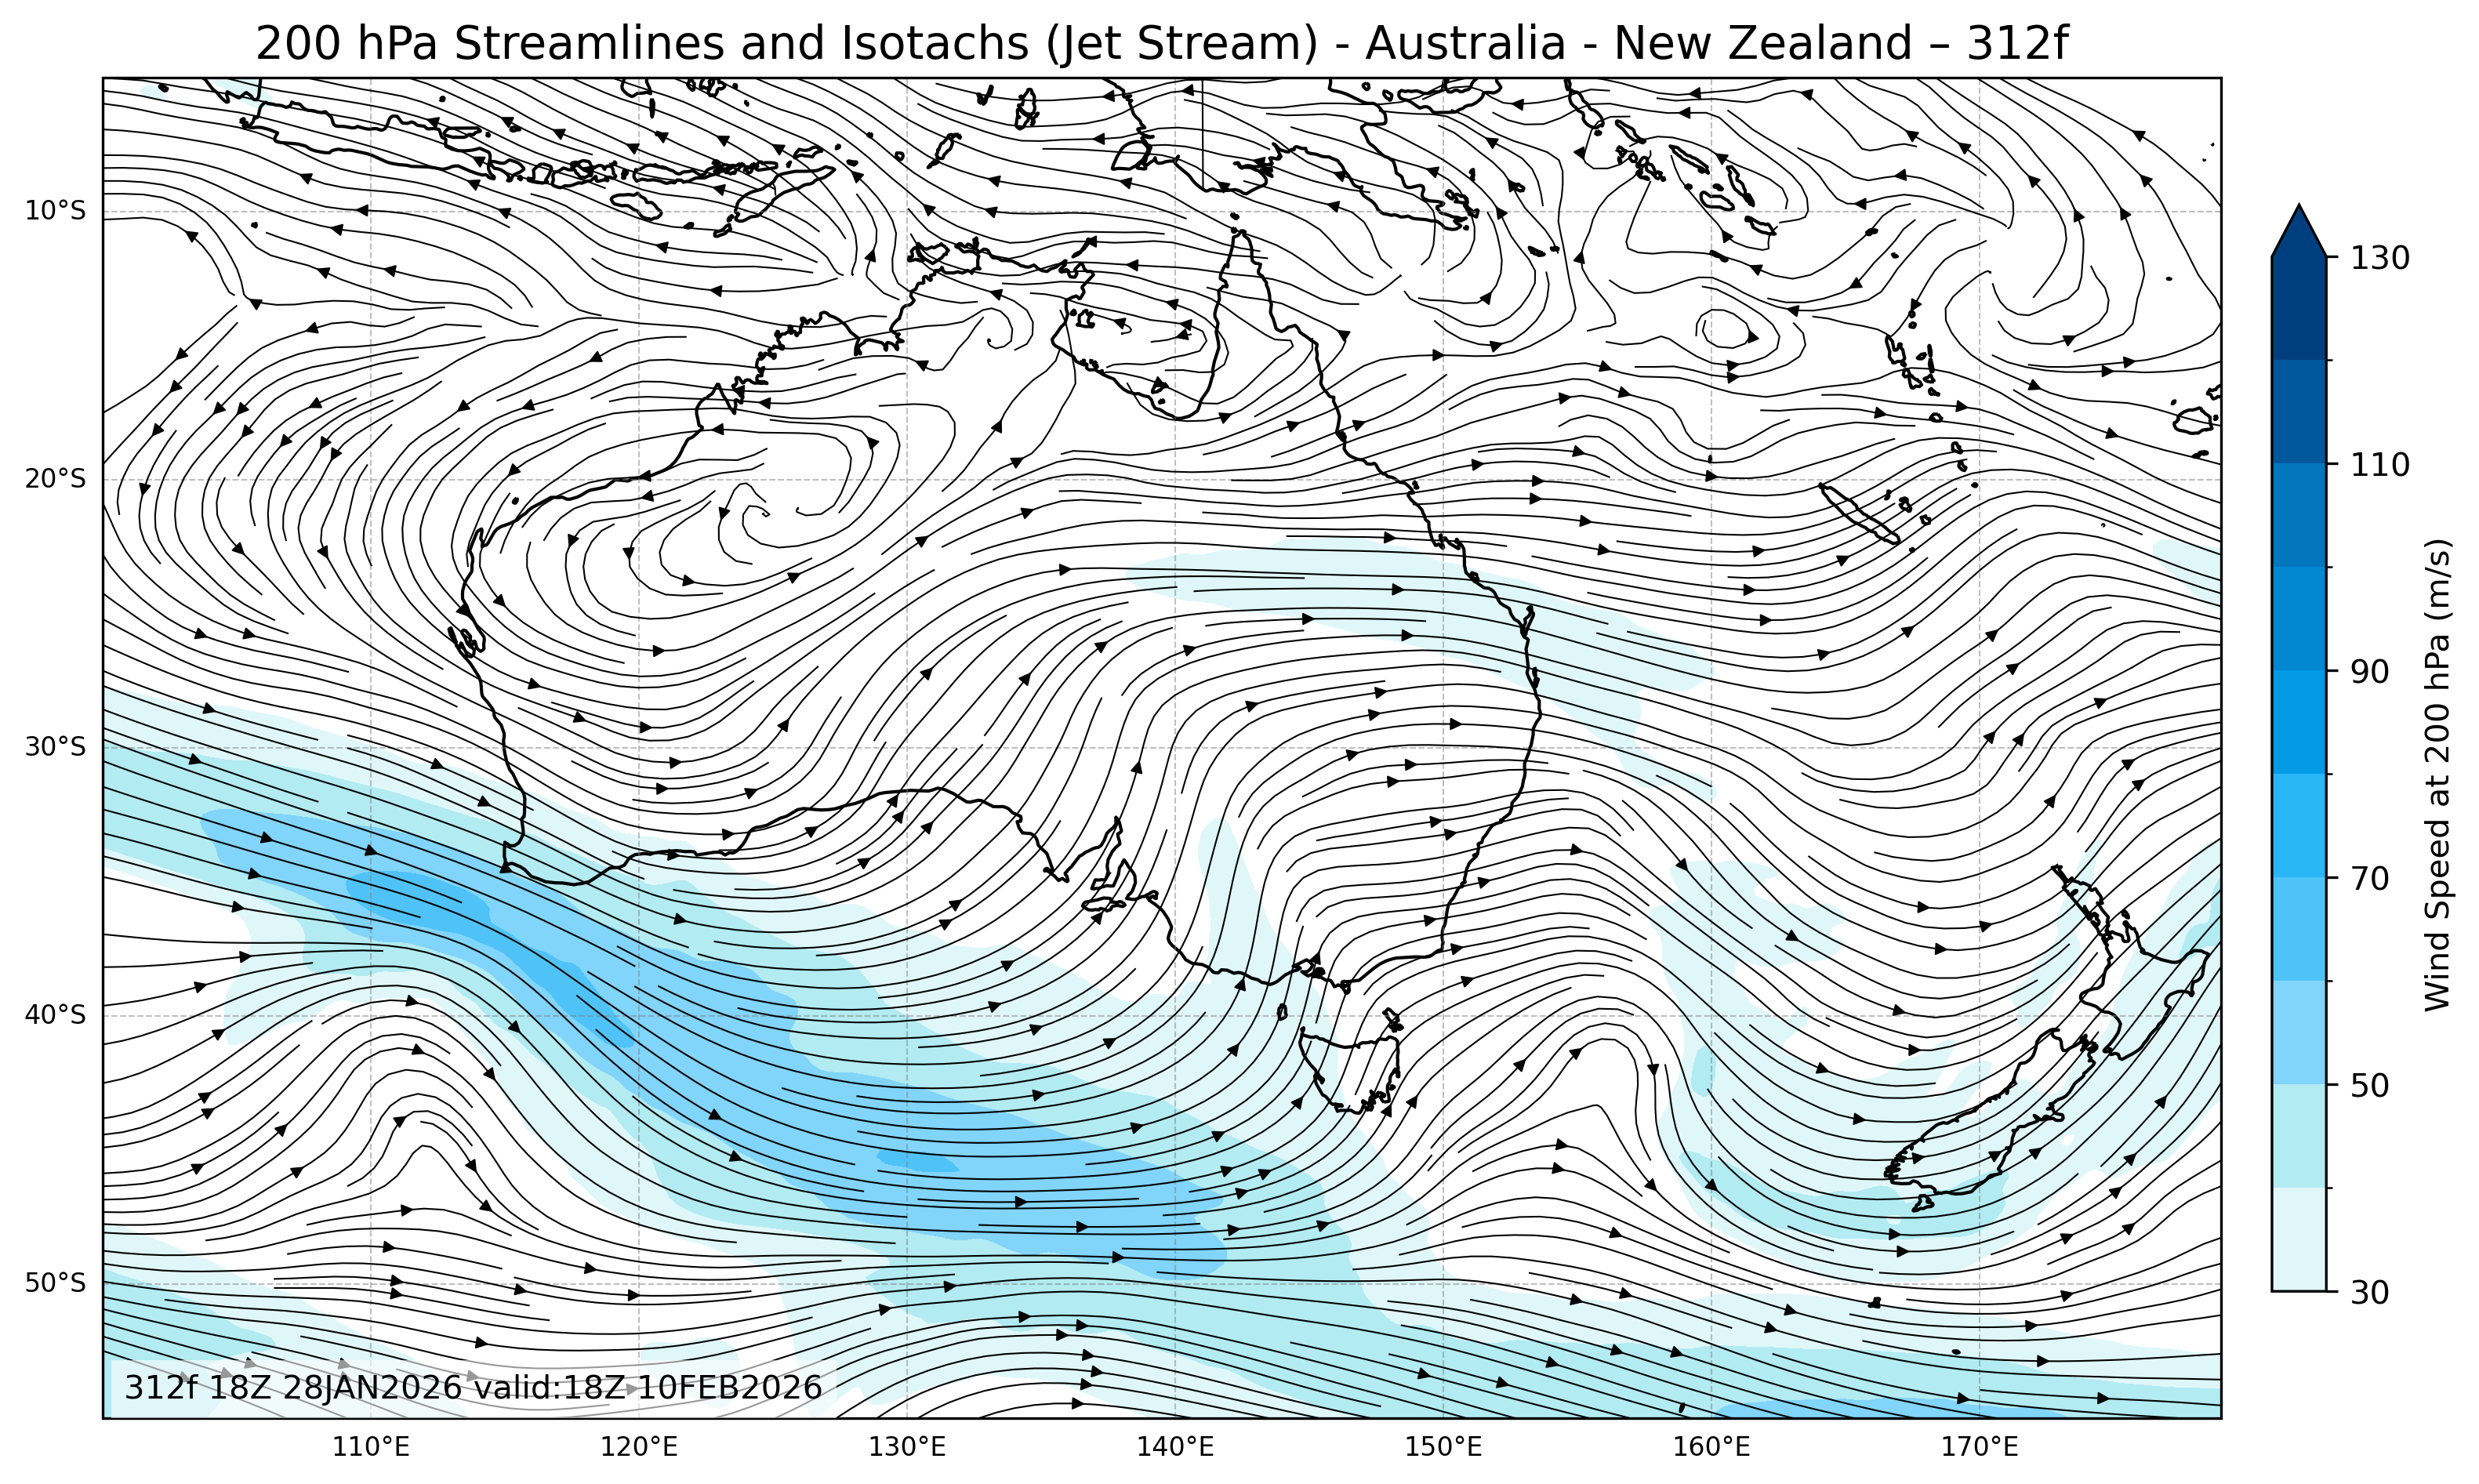
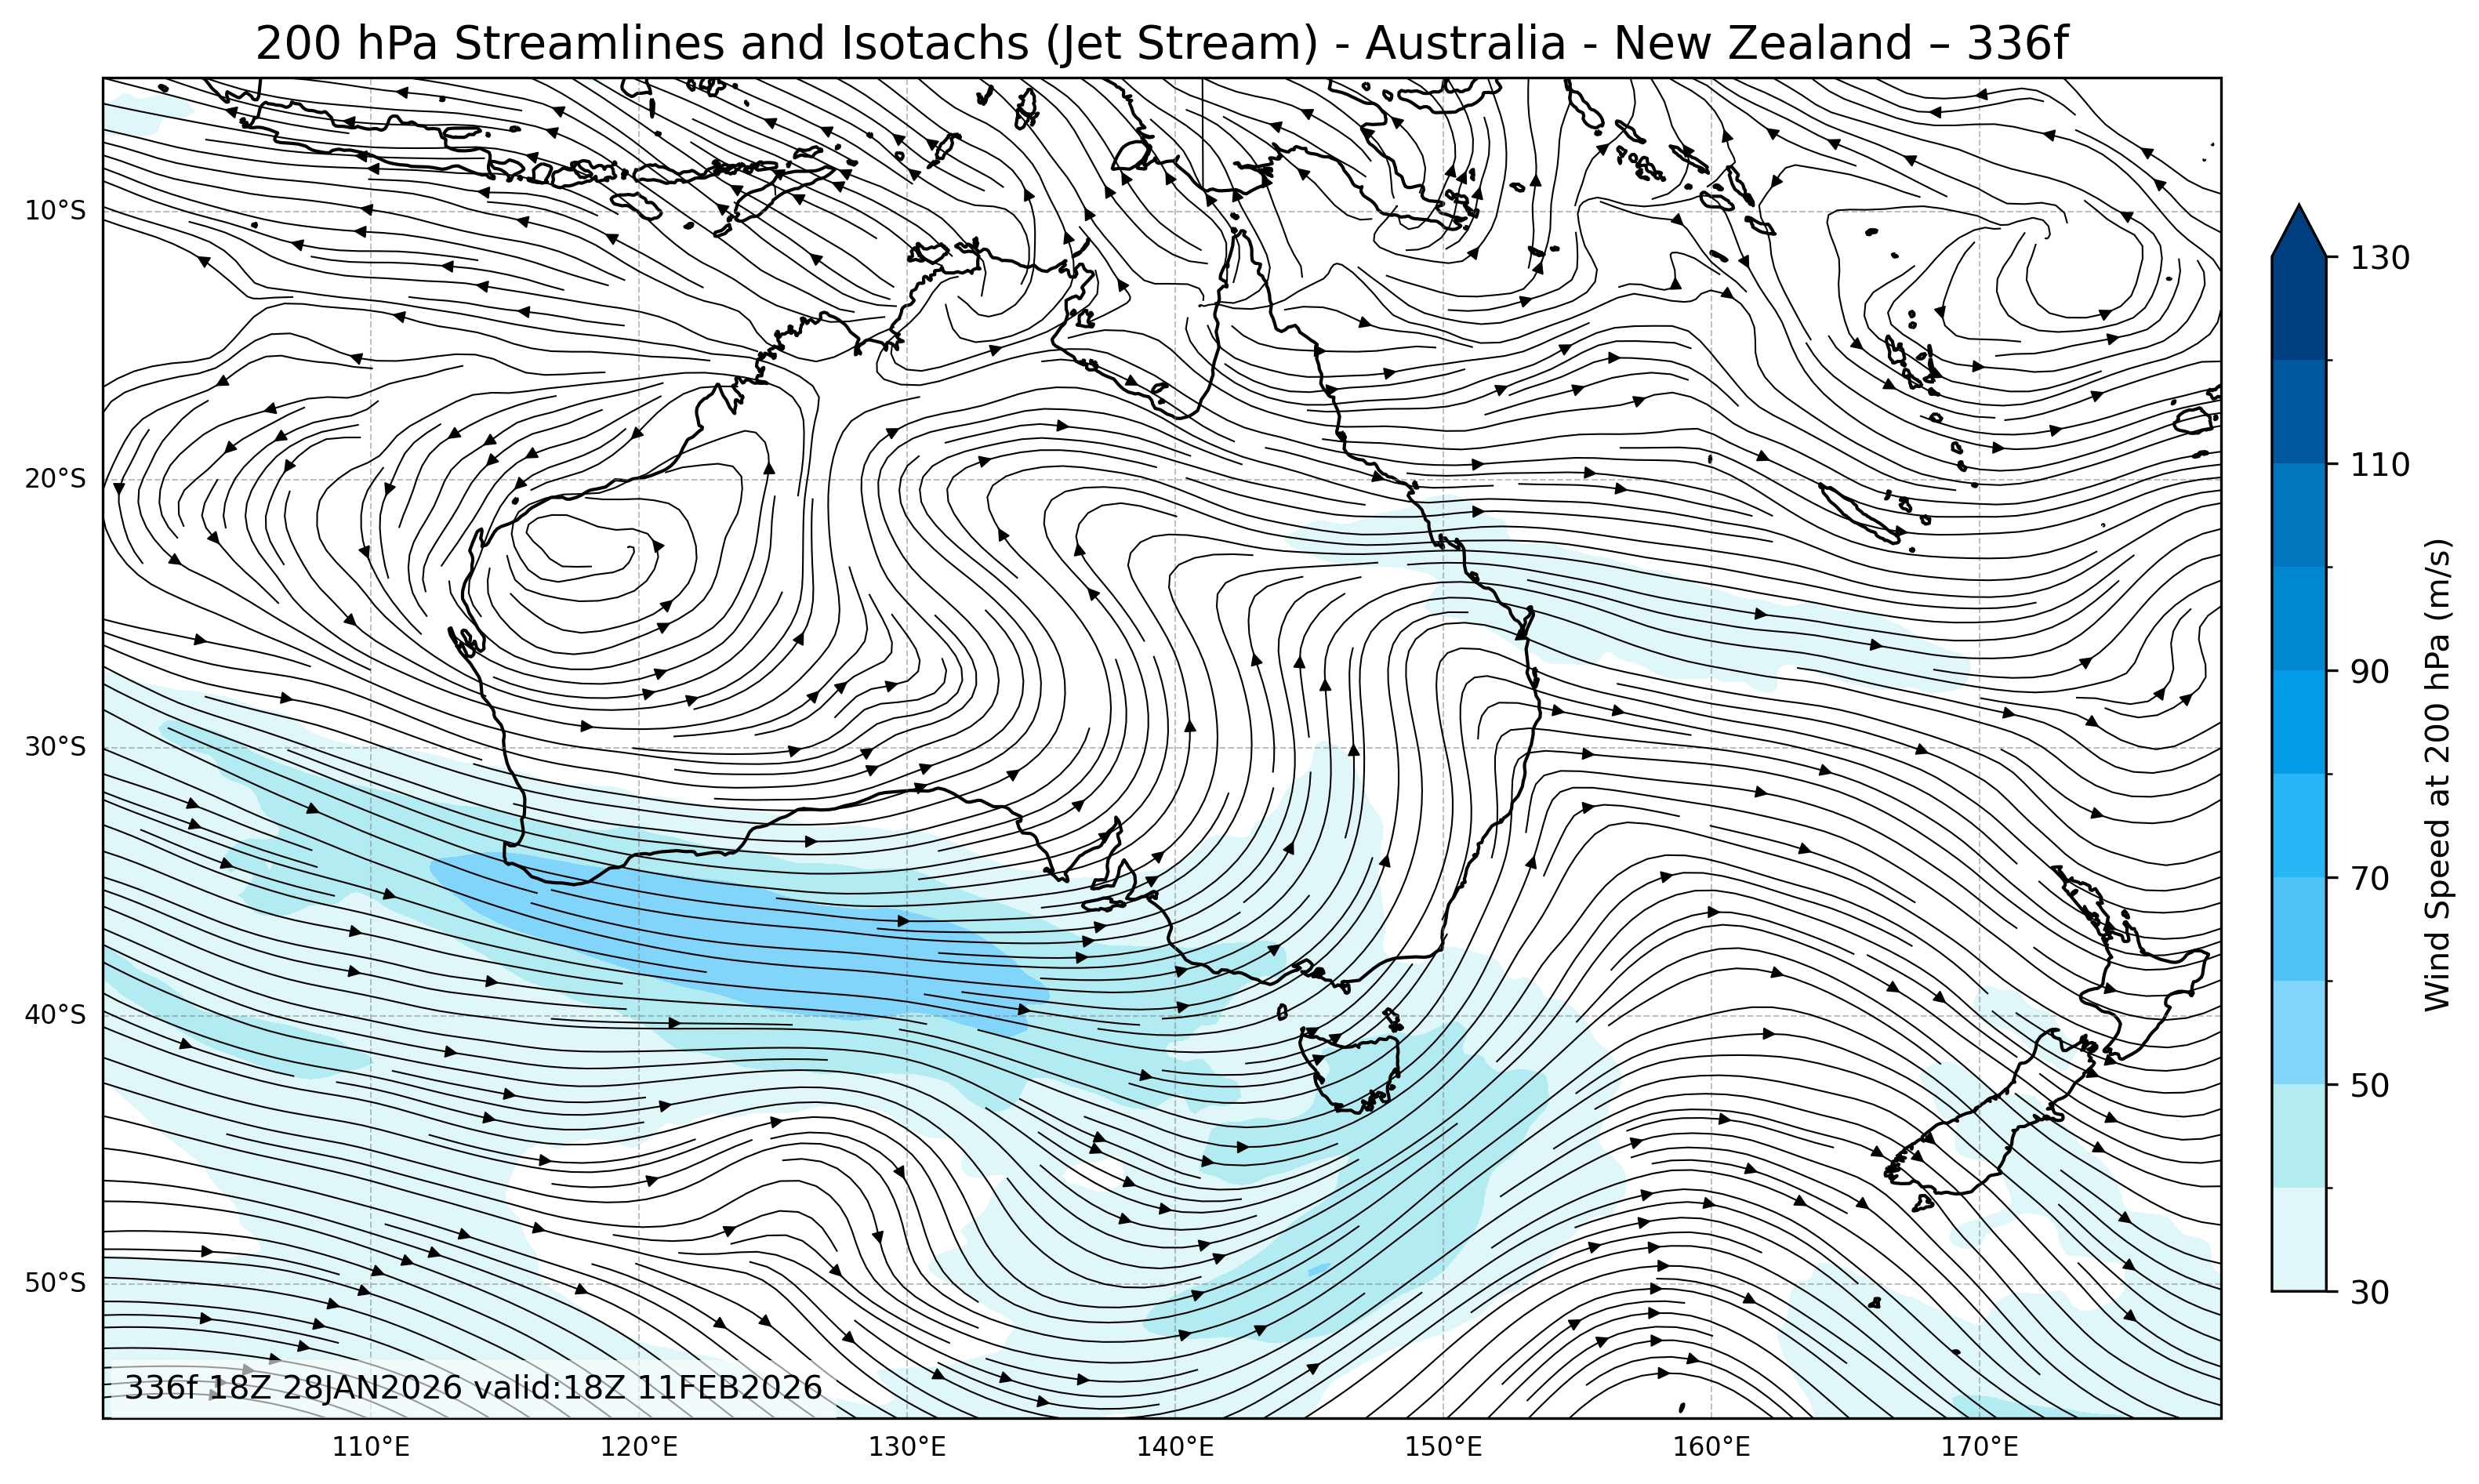
| 200mb Streamlines & Isotachs |
All Times |
🔍 | 🔍 | 🔍 | 🔍 | 🔍 |
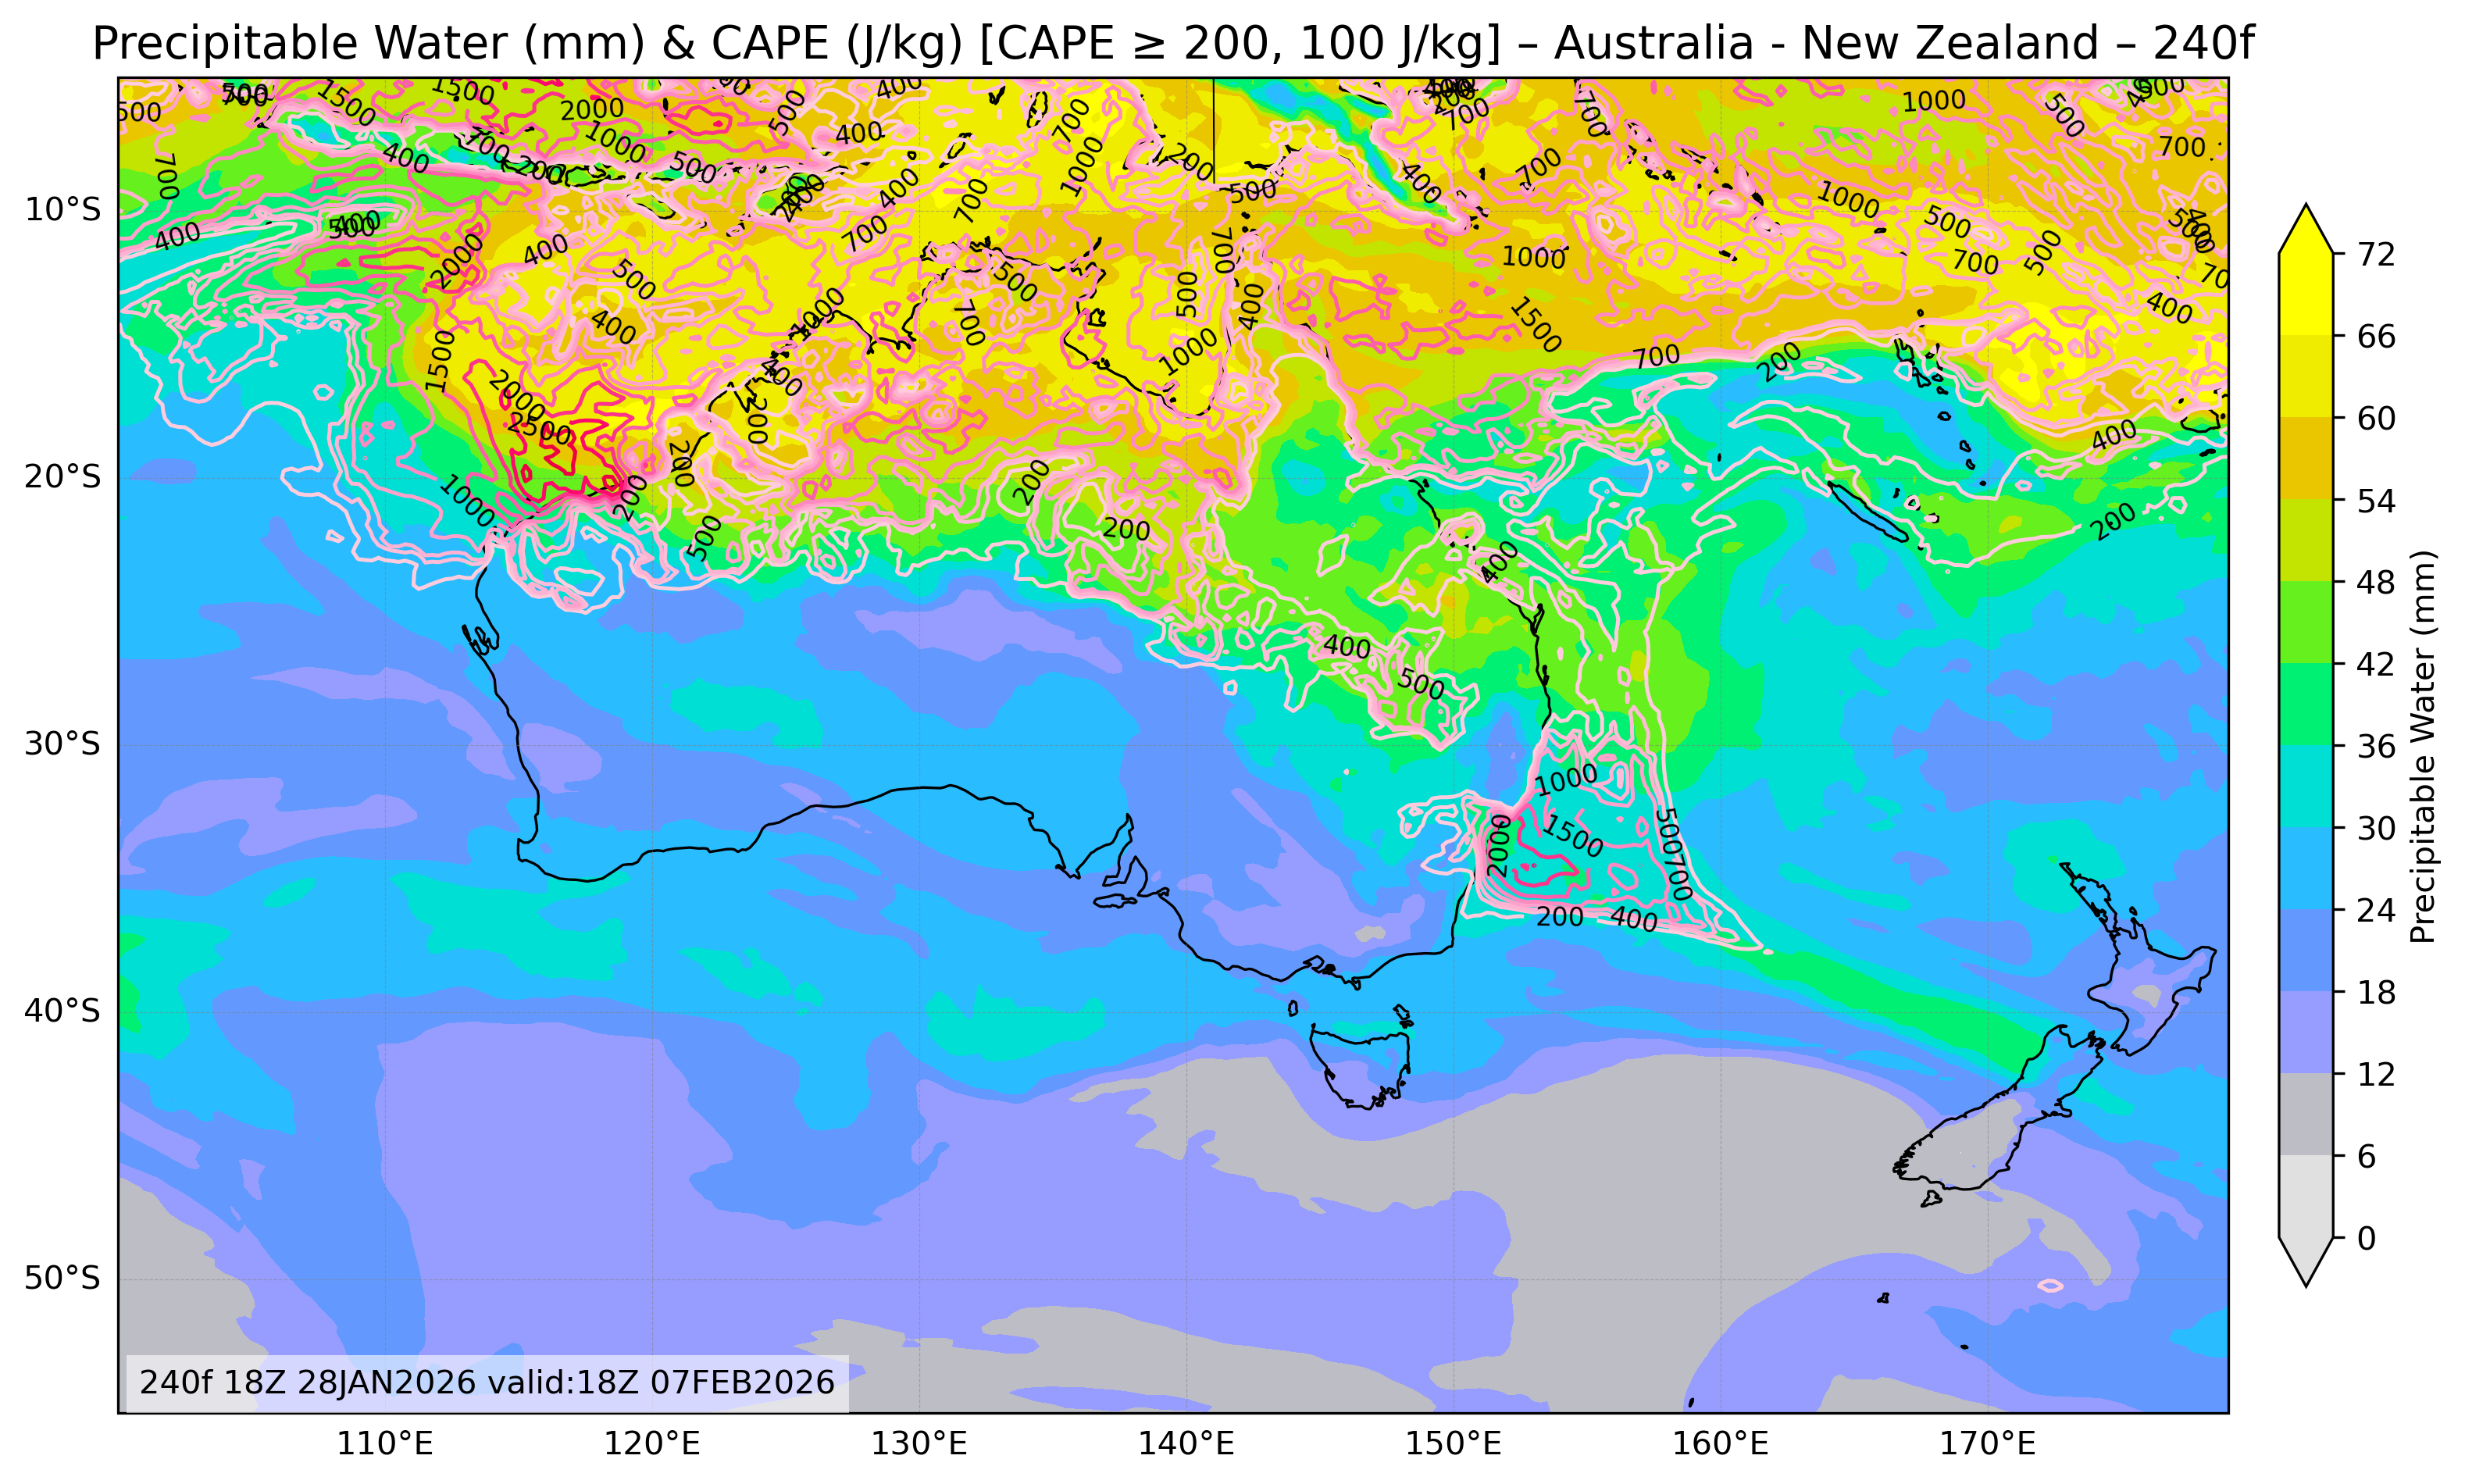
| Precipitable Water & Convective Available Potential Energy |
All Times |
🔍 | 🔍 | 🔍 | 🔍 | 🔍 |
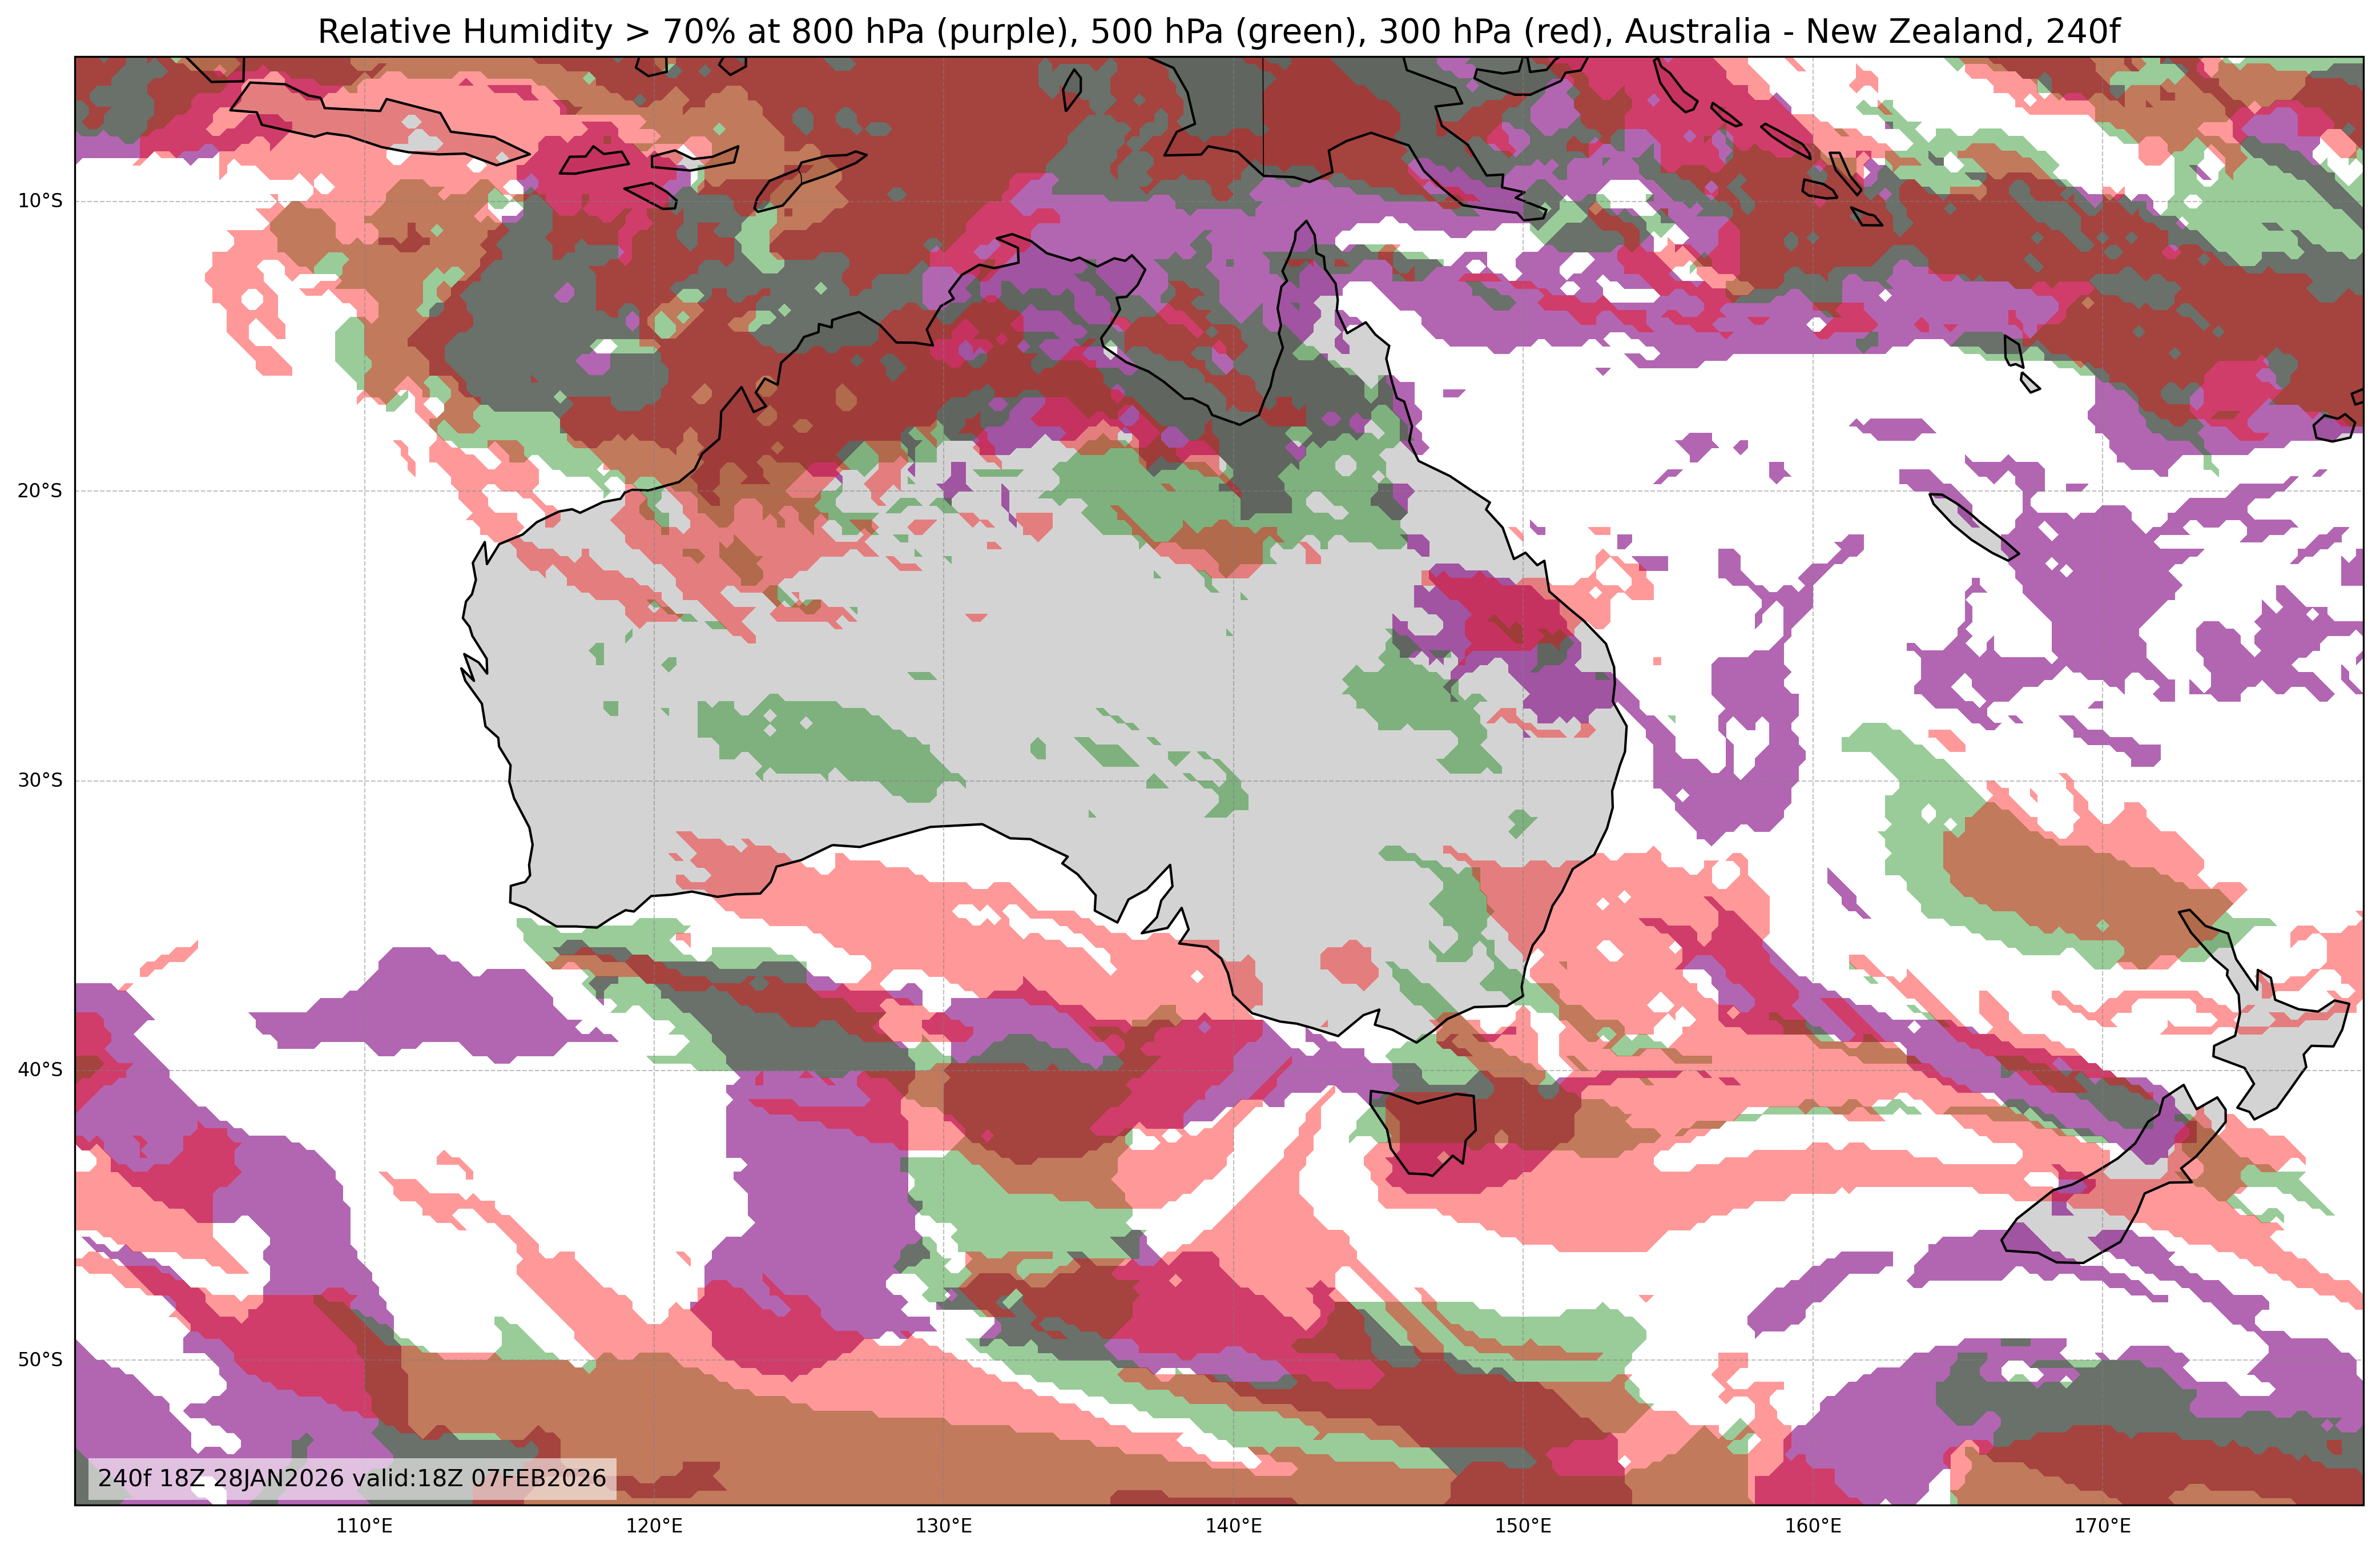
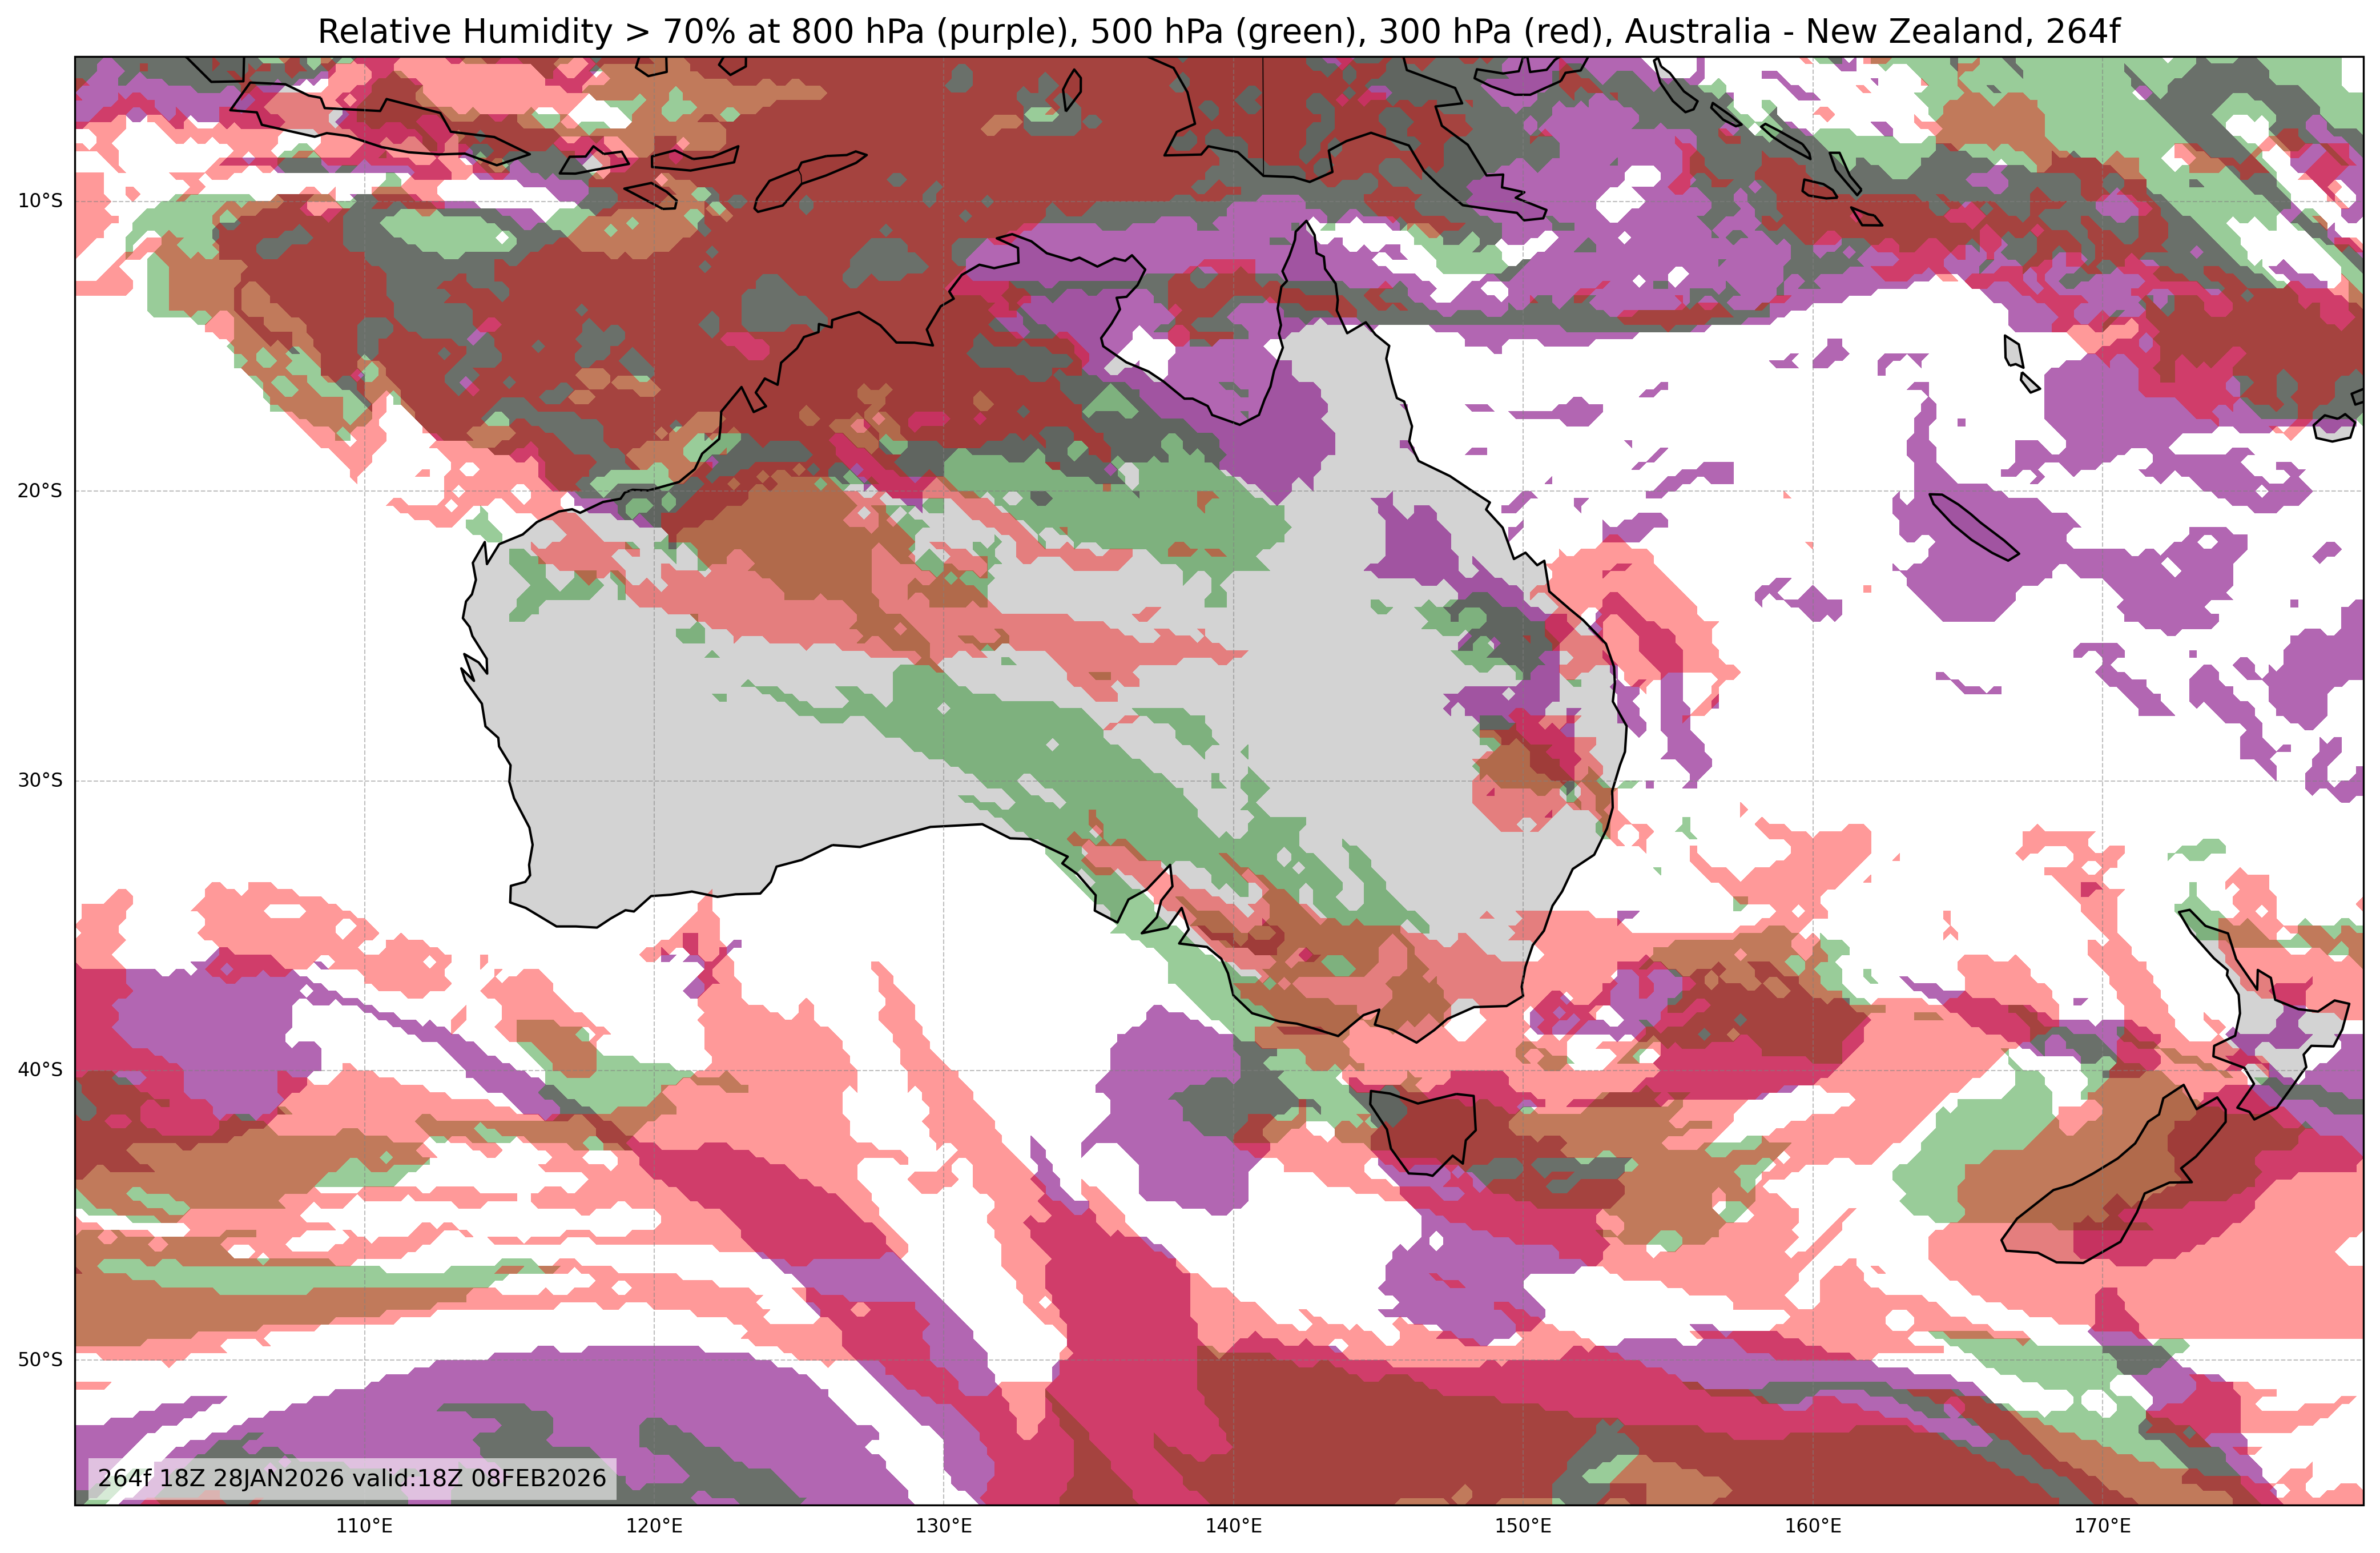
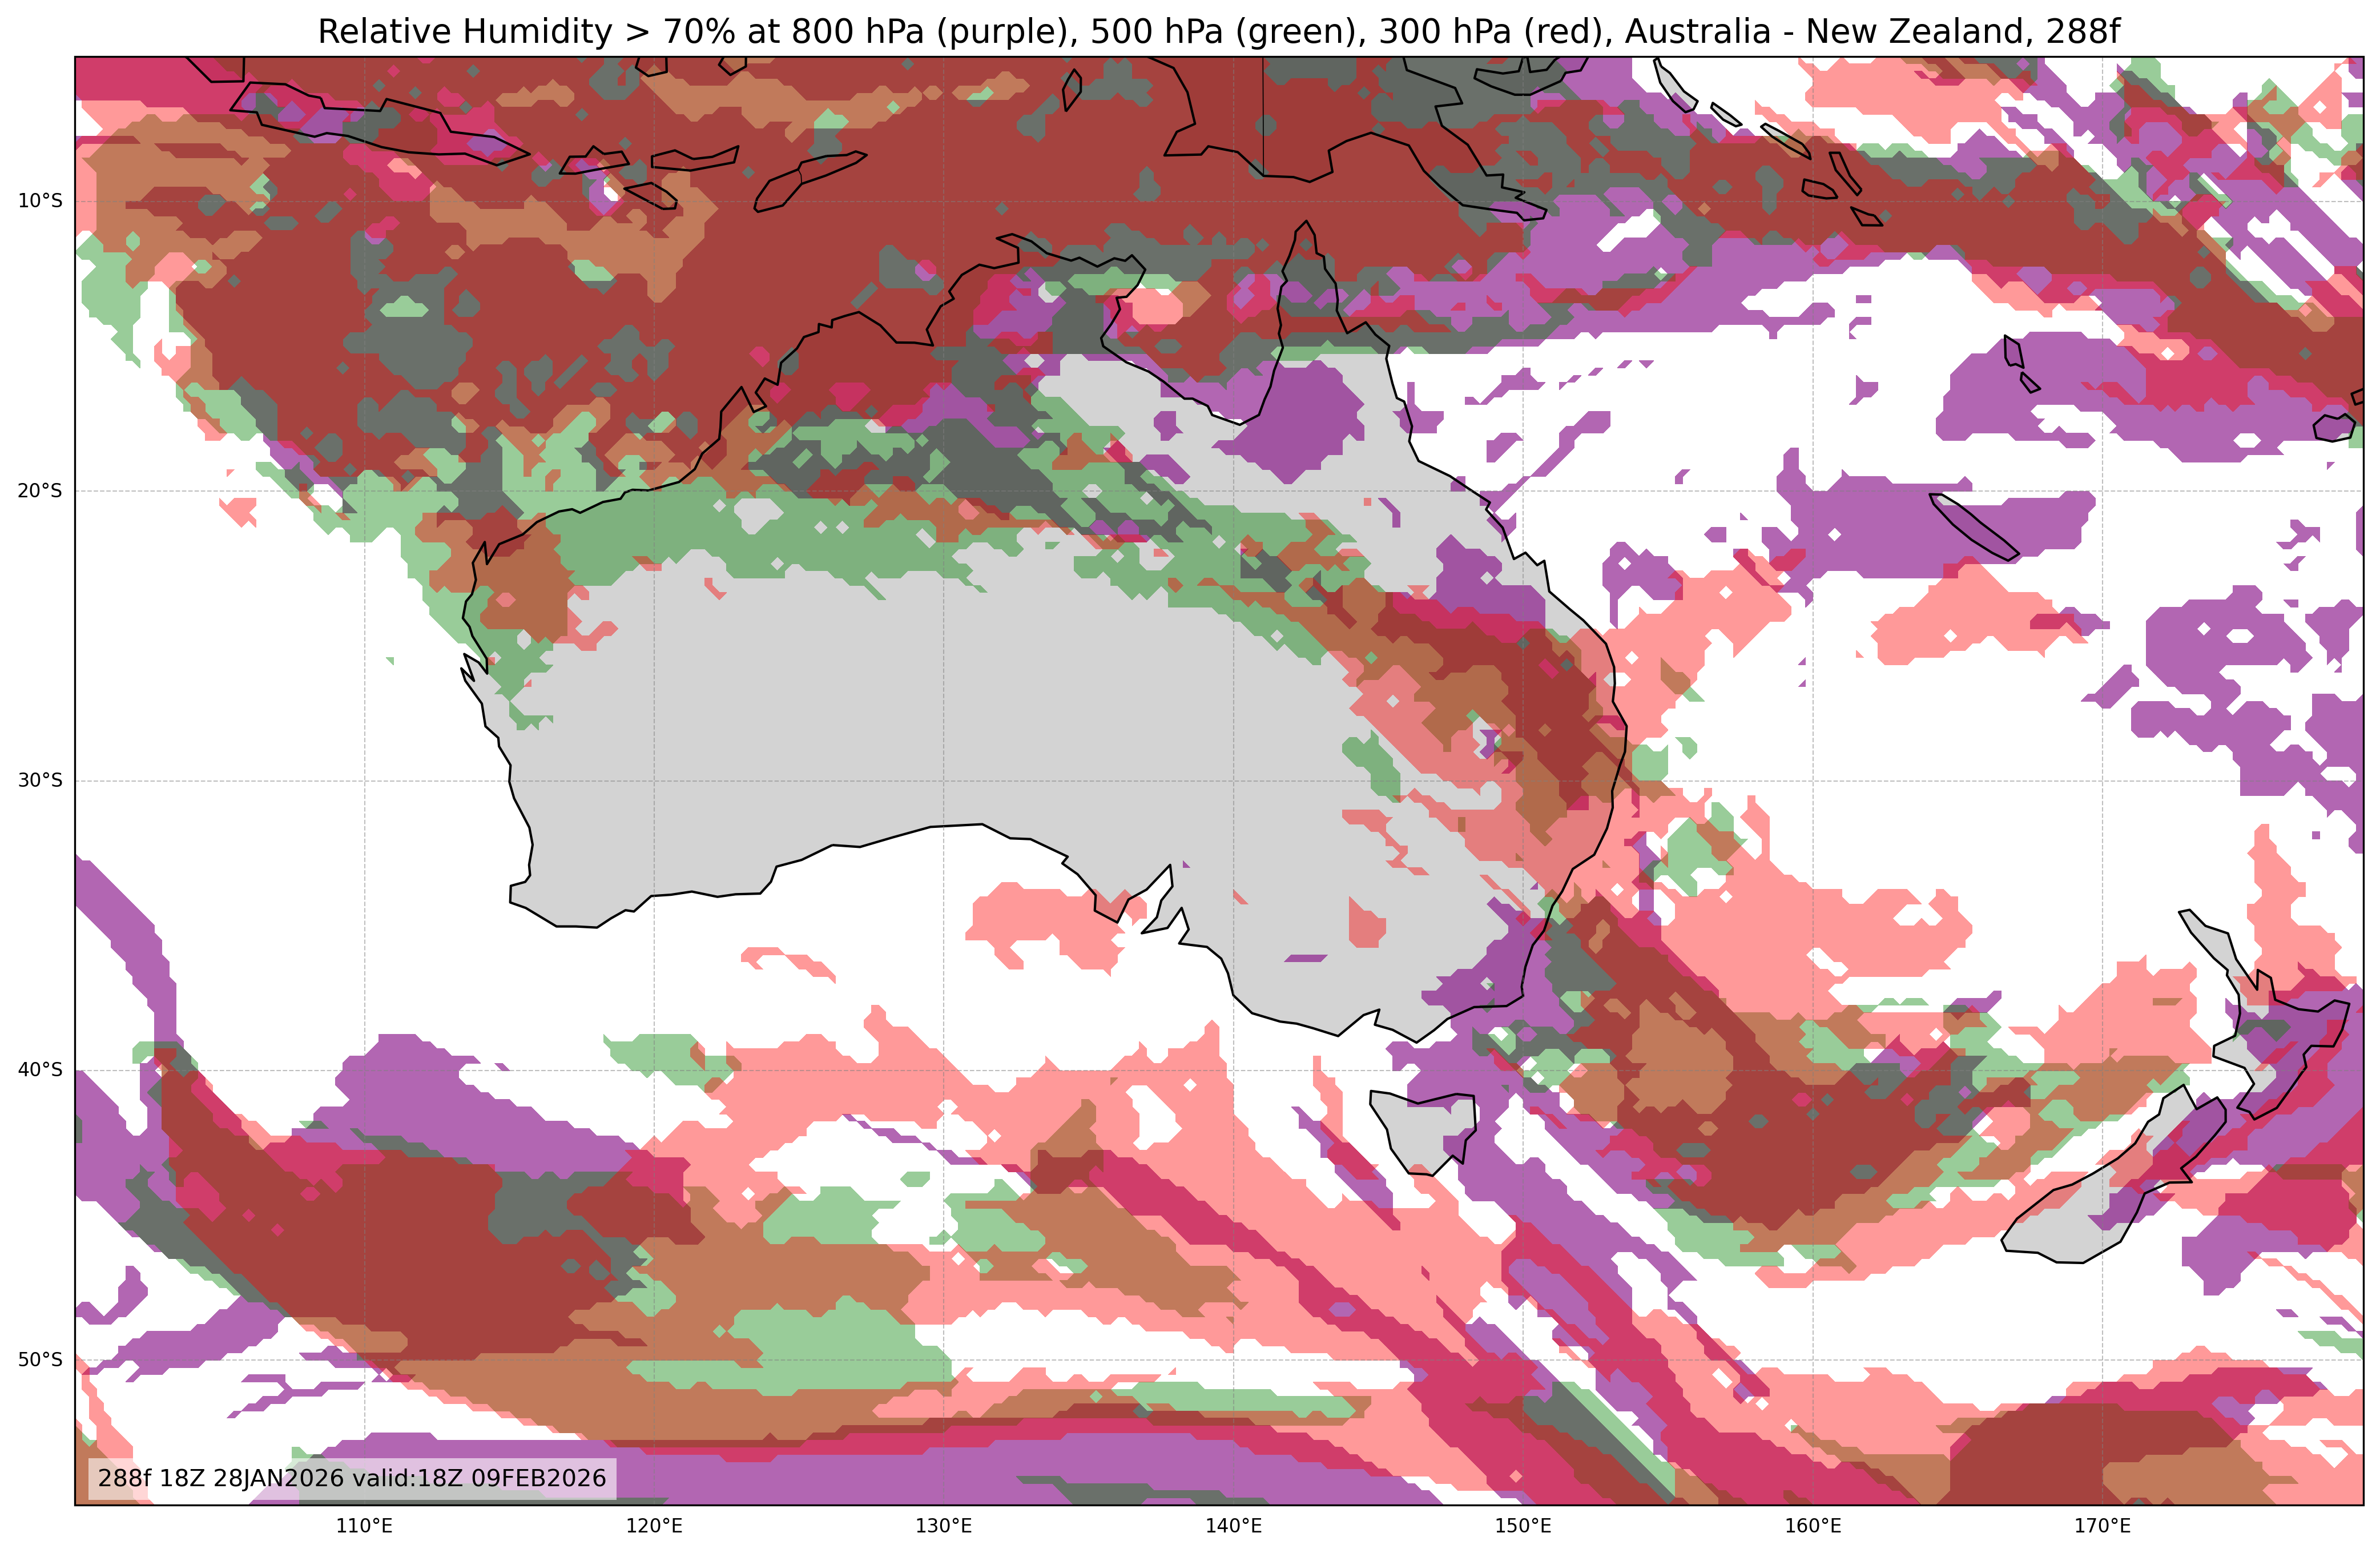
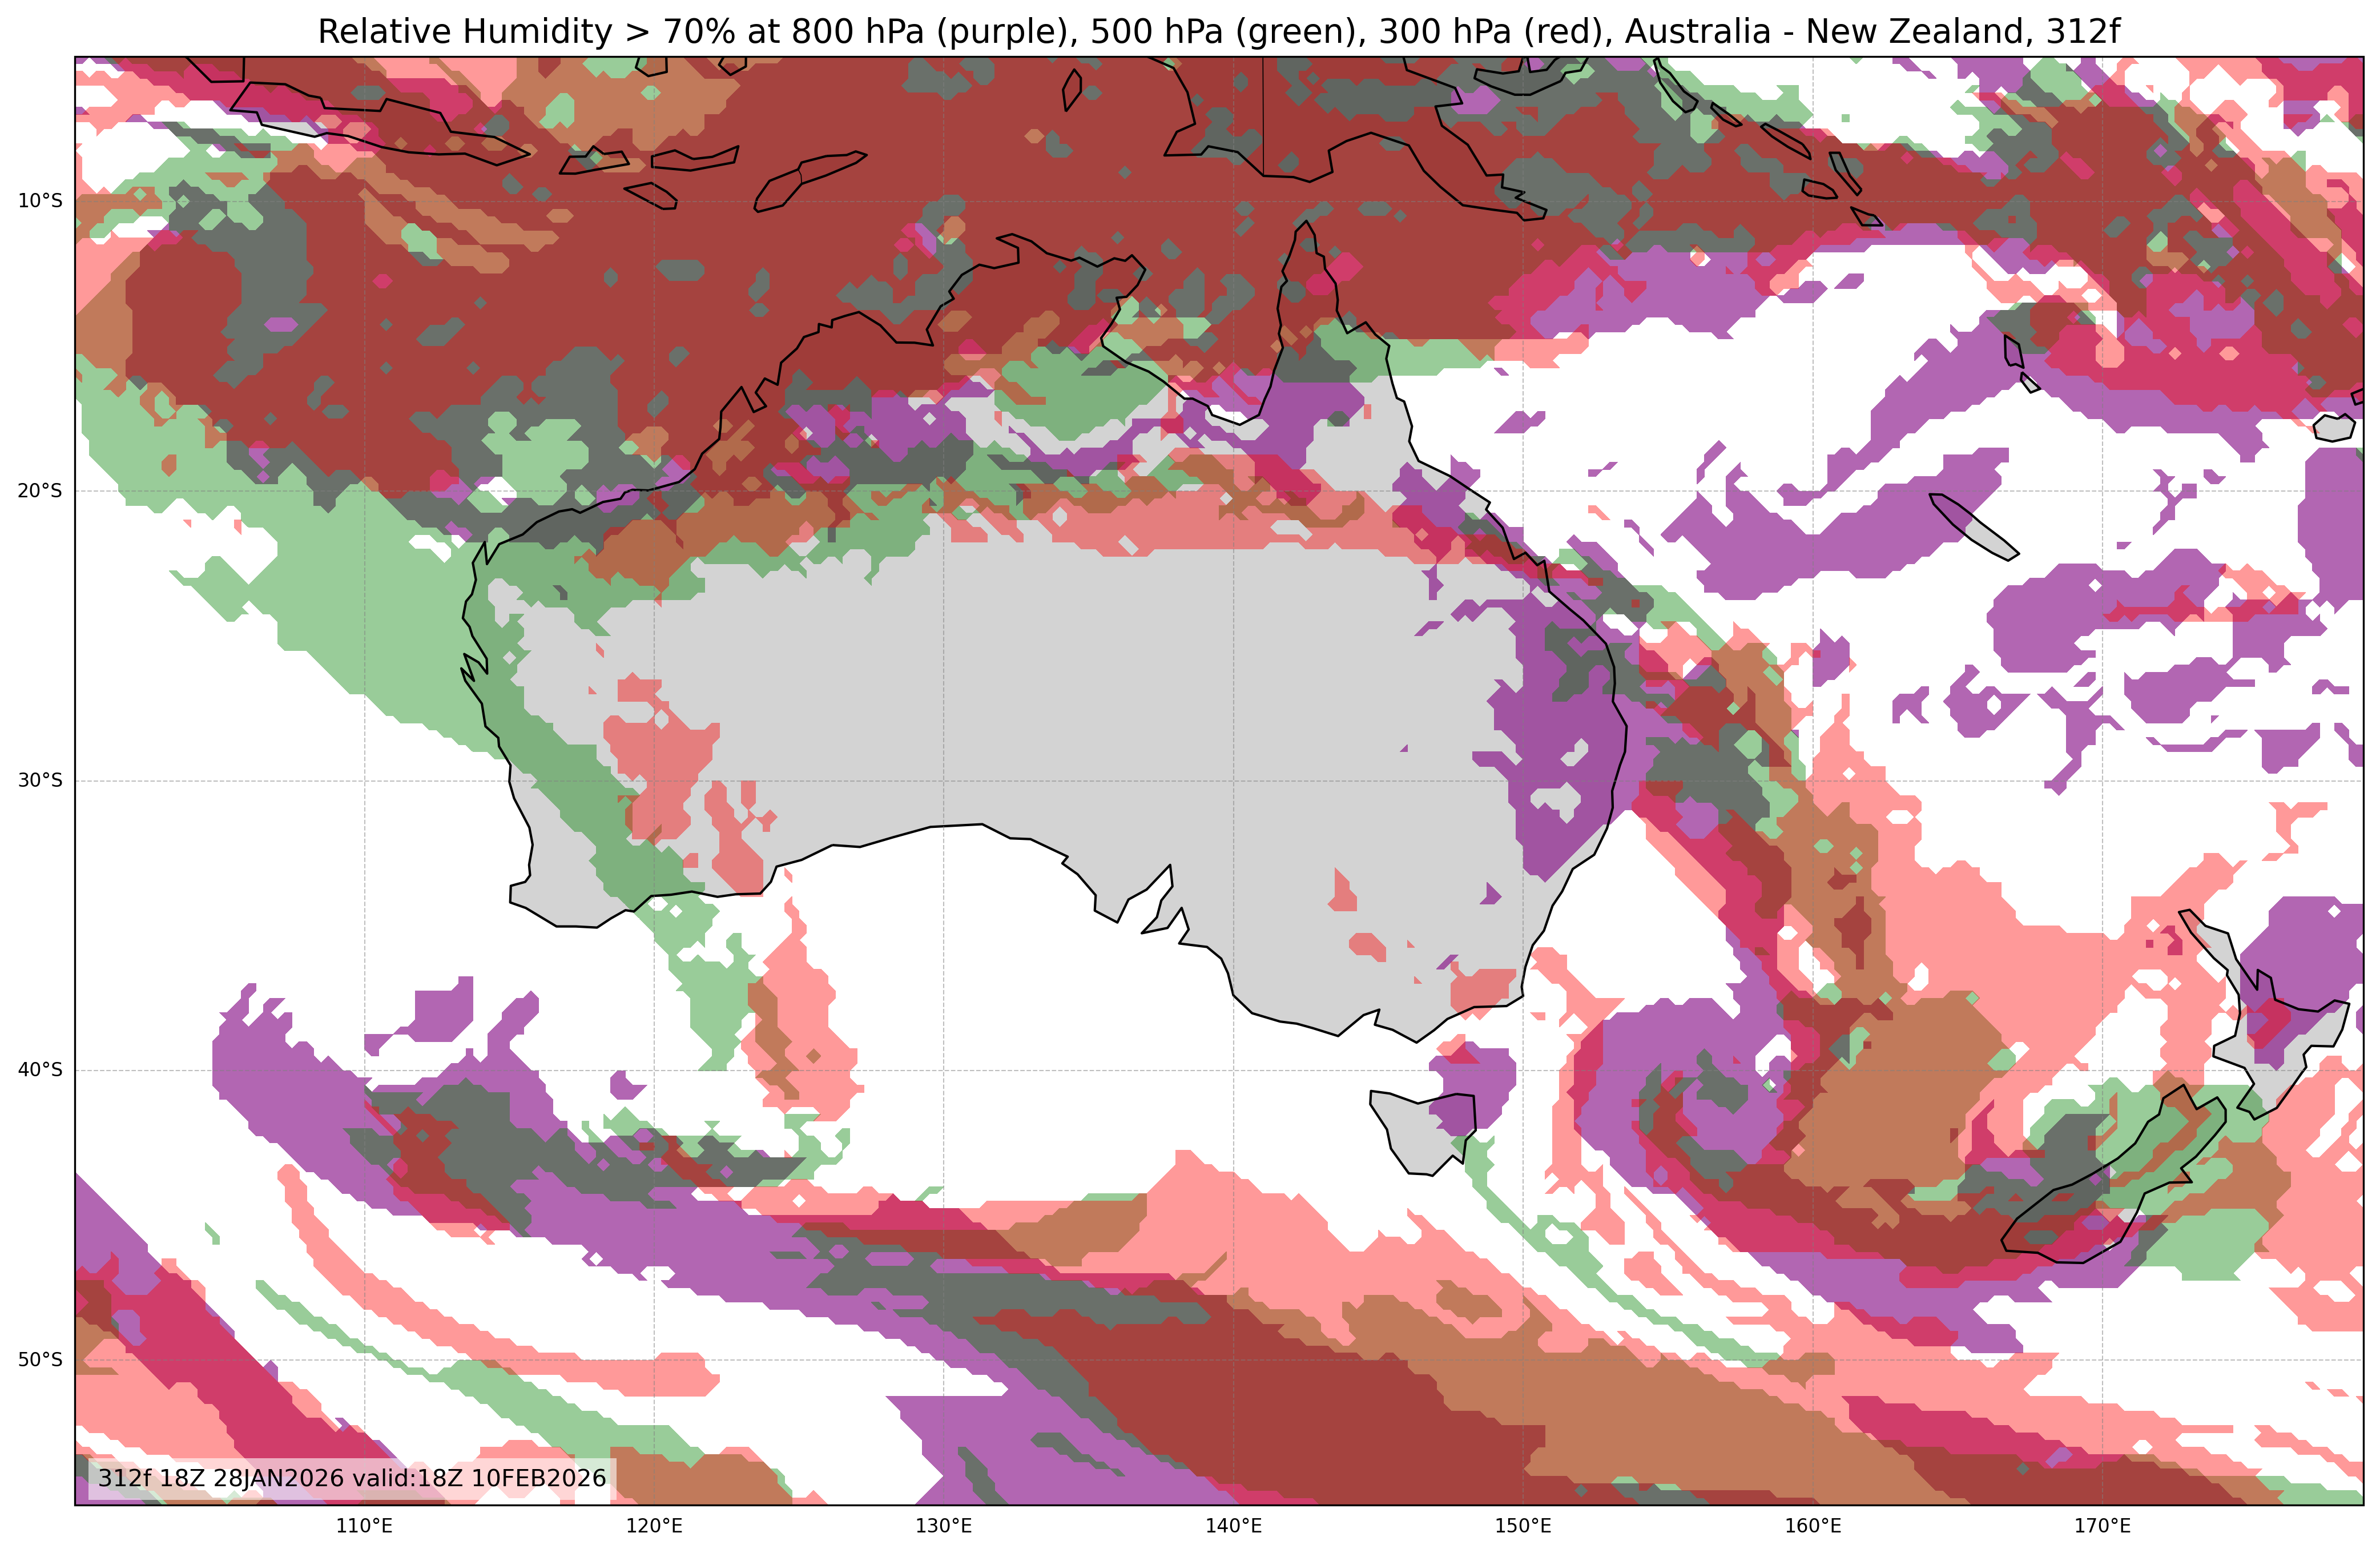
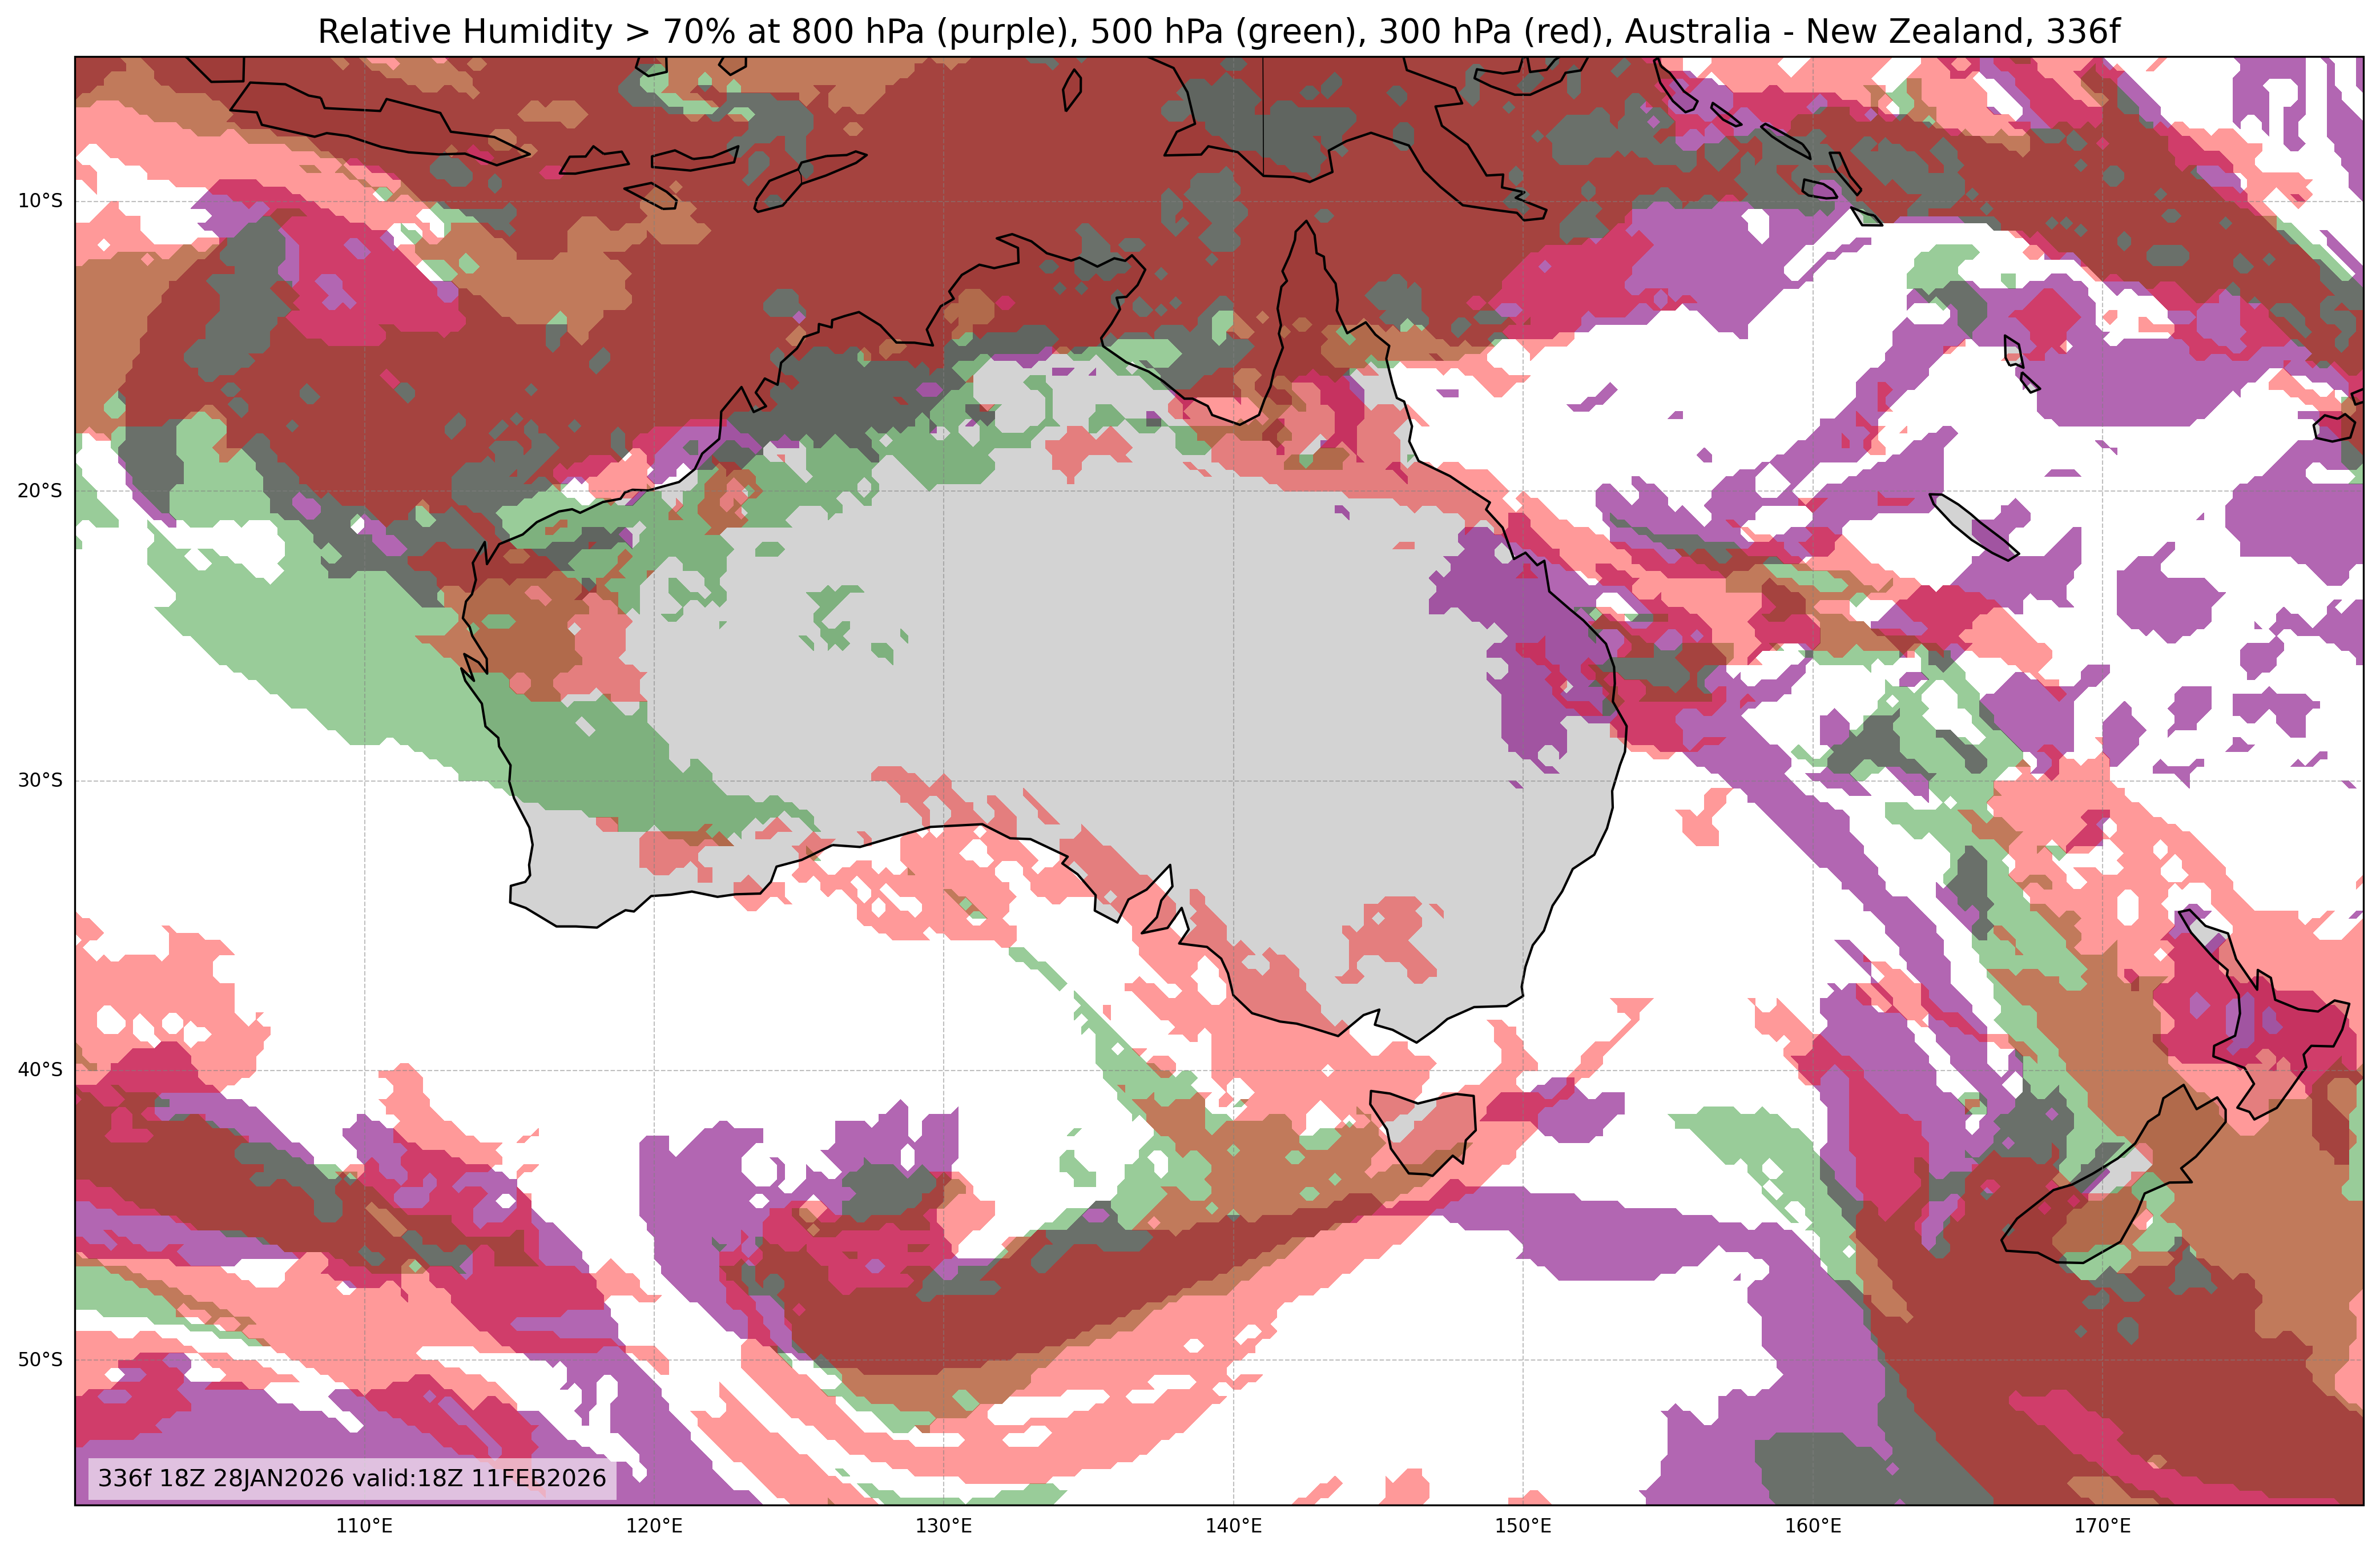
| Relative Humidity at 800, 500, & 300mb or Low, Middle, & High Cloud Cover |
All Times |
🔍 | 🔍 | 🔍 | 🔍 | 🔍 |
Forecast Animation Player
Therefore, we provide a reliable synoptic chart daily. Also, users track the ten day weather adelaide easily. Consequently, you plan outdoor trips perfectly.
Check The Weather Forecast For Australia And New Zealand
First, examine the australia weather map every morning. Moreover, travelers need a clear synoptic chart australia. Thus, you avoid sudden heavy rainstorms safely. However, local conditions change very quickly sometimes.
Using A Live Cyclone Tracker
Next, open our live cyclone tracker immediately. Indeed, this tool shows dangerous storms clearly. Besides, coastal residents check the sydney australia weather map. Then, families secure their homes quickly.
Analyze Your 10-day Synoptic Chart Australia
Sometimes, you need a 10-day synoptic chart australia. Furthermore, meteorologists trust the gfs model entirely. Hence, professionals predict climate shifts very accurately. Similarly, farmers use a rainfall checker daily.
Find A 7 Day Synoptic Chart
Additionally, a 7 day synoptic chart helps everyone. Therefore, you understand the map heat trends clearly. Also, we update the australia weather map frequently. Consequently, users get precise regional data.
Review The Weather Forecast For Australia And New Zealand
Always trust this Weather Forecast for Australia and New Zealand. Moreover, we offer the ten day weather adelaide exactly. Thus, tourists pack their travel bags correctly. However, you must monitor the gfs constantly.
Important Rainfall Checker Benefits
First, a rainfall checker saves valuable crop fields. Indeed, agricultural workers rely on accurate data. Besides, they study the synoptic chart australia closely. Then, everyone avoids massive flood damage.
Explore The Map Heat Patterns
Next, viewers analyze the map heat carefully. Furthermore, extreme temperatures require serious safety precautions. Hence, you view the sydney australia weather map. Similarly, the 10-day synoptic chart australia guides you.
Daily Weather Forecast For Australia And New Zealand Tools
Ultimately, our Weather Forecast for Australia and New Zealand delivers. Therefore, check these great digital tools below:
- Users access the live cyclone tracker fast.
- Also, experts read a 7 day synoptic chart.
- Moreover, everyone views the synoptic chart.
Reliable Gfs System Updates
Consequently, the gfs system provides excellent results. Besides, computers process global atmosphere changes rapidly. Then, we update the ten day weather adelaide instantly. Thus, your weekend plans succeed flawlessly.
Trust The Australia Weather Map
Always open the australia weather map first. Furthermore, understanding a basic synoptic chart helps immensely. Hence, you prepare for sudden cold fronts. Similarly, a map heat warns about summer.
Your Sydney Australia Weather Map Guide
Finally, locate your sydney australia weather map online. Therefore, city drivers avoid terrible road conditions. Also, they use the rainfall checker regularly. Consequently, morning commutes become much safer today.
Advanced Synoptic Chart Australia Details
Next, study the synoptic chart australia properly. Indeed, reading a 10-day synoptic chart australia takes practice. Besides, the 7 day synoptic chart looks simpler. Then, you track massive pressure systems easily.
Moreover, the Weather Forecast for Australia and New Zealand updates. Thus, you find a live cyclone tracker here. However, storms require your immediate personal attention. Always watch the sky very closely.
More Weather Forecast For Australia And New Zealand Facts
First, our Weather Forecast for Australia and New Zealand wins awards. Therefore, thousands visit this platform every day. Also, readers trust the ten day weather adelaide. Consequently, they enjoy perfect beach holidays.
Why Use The Gfs Model
Furthermore, the gfs model calculates complex variables perfectly. Hence, scientists rely on these specific numbers. Similarly, the australia weather map shows wind speeds. Next, you see the map heat clearly.
Track Storms With A Live Cyclone Tracker
Indeed, a live cyclone tracker saves human lives. Besides, tracking systems update every single minute. Then, coastal towns prepare for strong winds. Thus, the sydney australia weather map proves vital.
Value Of A Rainfall Checker
Moreover, a digital rainfall checker measures precipitation accurately. However, heavy rains cause dangerous flash floods. Therefore, check the 10-day synoptic chart australia often. Also, review the 7 day synoptic chart too.
Master Your Synoptic Chart Australia
Consequently, mastering the synoptic chart australia takes time. Next, a basic synoptic chart displays high pressure. Furthermore, low pressure brings massive storm clouds. Hence, you predict local changes very easily.
Planning With Ten Day Weather Adelaide
Similarly, the ten day weather adelaide helps local businesses. First, restaurants plan outdoor seating arrangements carefully. Indeed, they check the map heat regularly. Besides, hot days increase cold drink sales.
Complete Weather Forecast For Australia And New Zealand
Finally, this Weather Forecast for Australia and New Zealand rules. Then, you track every single climate shift. Thus, the live cyclone tracker protects your family. Moreover, use the rainfall checker wisely today.
Also, examine the australia weather map tonight. Consequently, the sydney australia weather map guides tomorrow. Therefore, read your 10-day synoptic chart australia closely. Always study the 7 day synoptic chart.