Medium Range Forecasts
| Weather Map Images | Time: | Analysis | Day 1 24 Hours |
Day 2 48 Hours |
Day 3 72 Hours |
Day 4 96 Hours |
| Field: | All Fields |
All Fields |
All Fields |
All Fields |
All Fields |
|
| 500mb Geopotential Height & Vorticity |
All Times |
🔍 | 🔍 | 🔍 | 🔍 | 🔍 |
| Sea Level Pressure & 1000-500mb Thickness |
All Times |
🔍 | 🔍 | 🔍 | 🔍 | 🔍 |
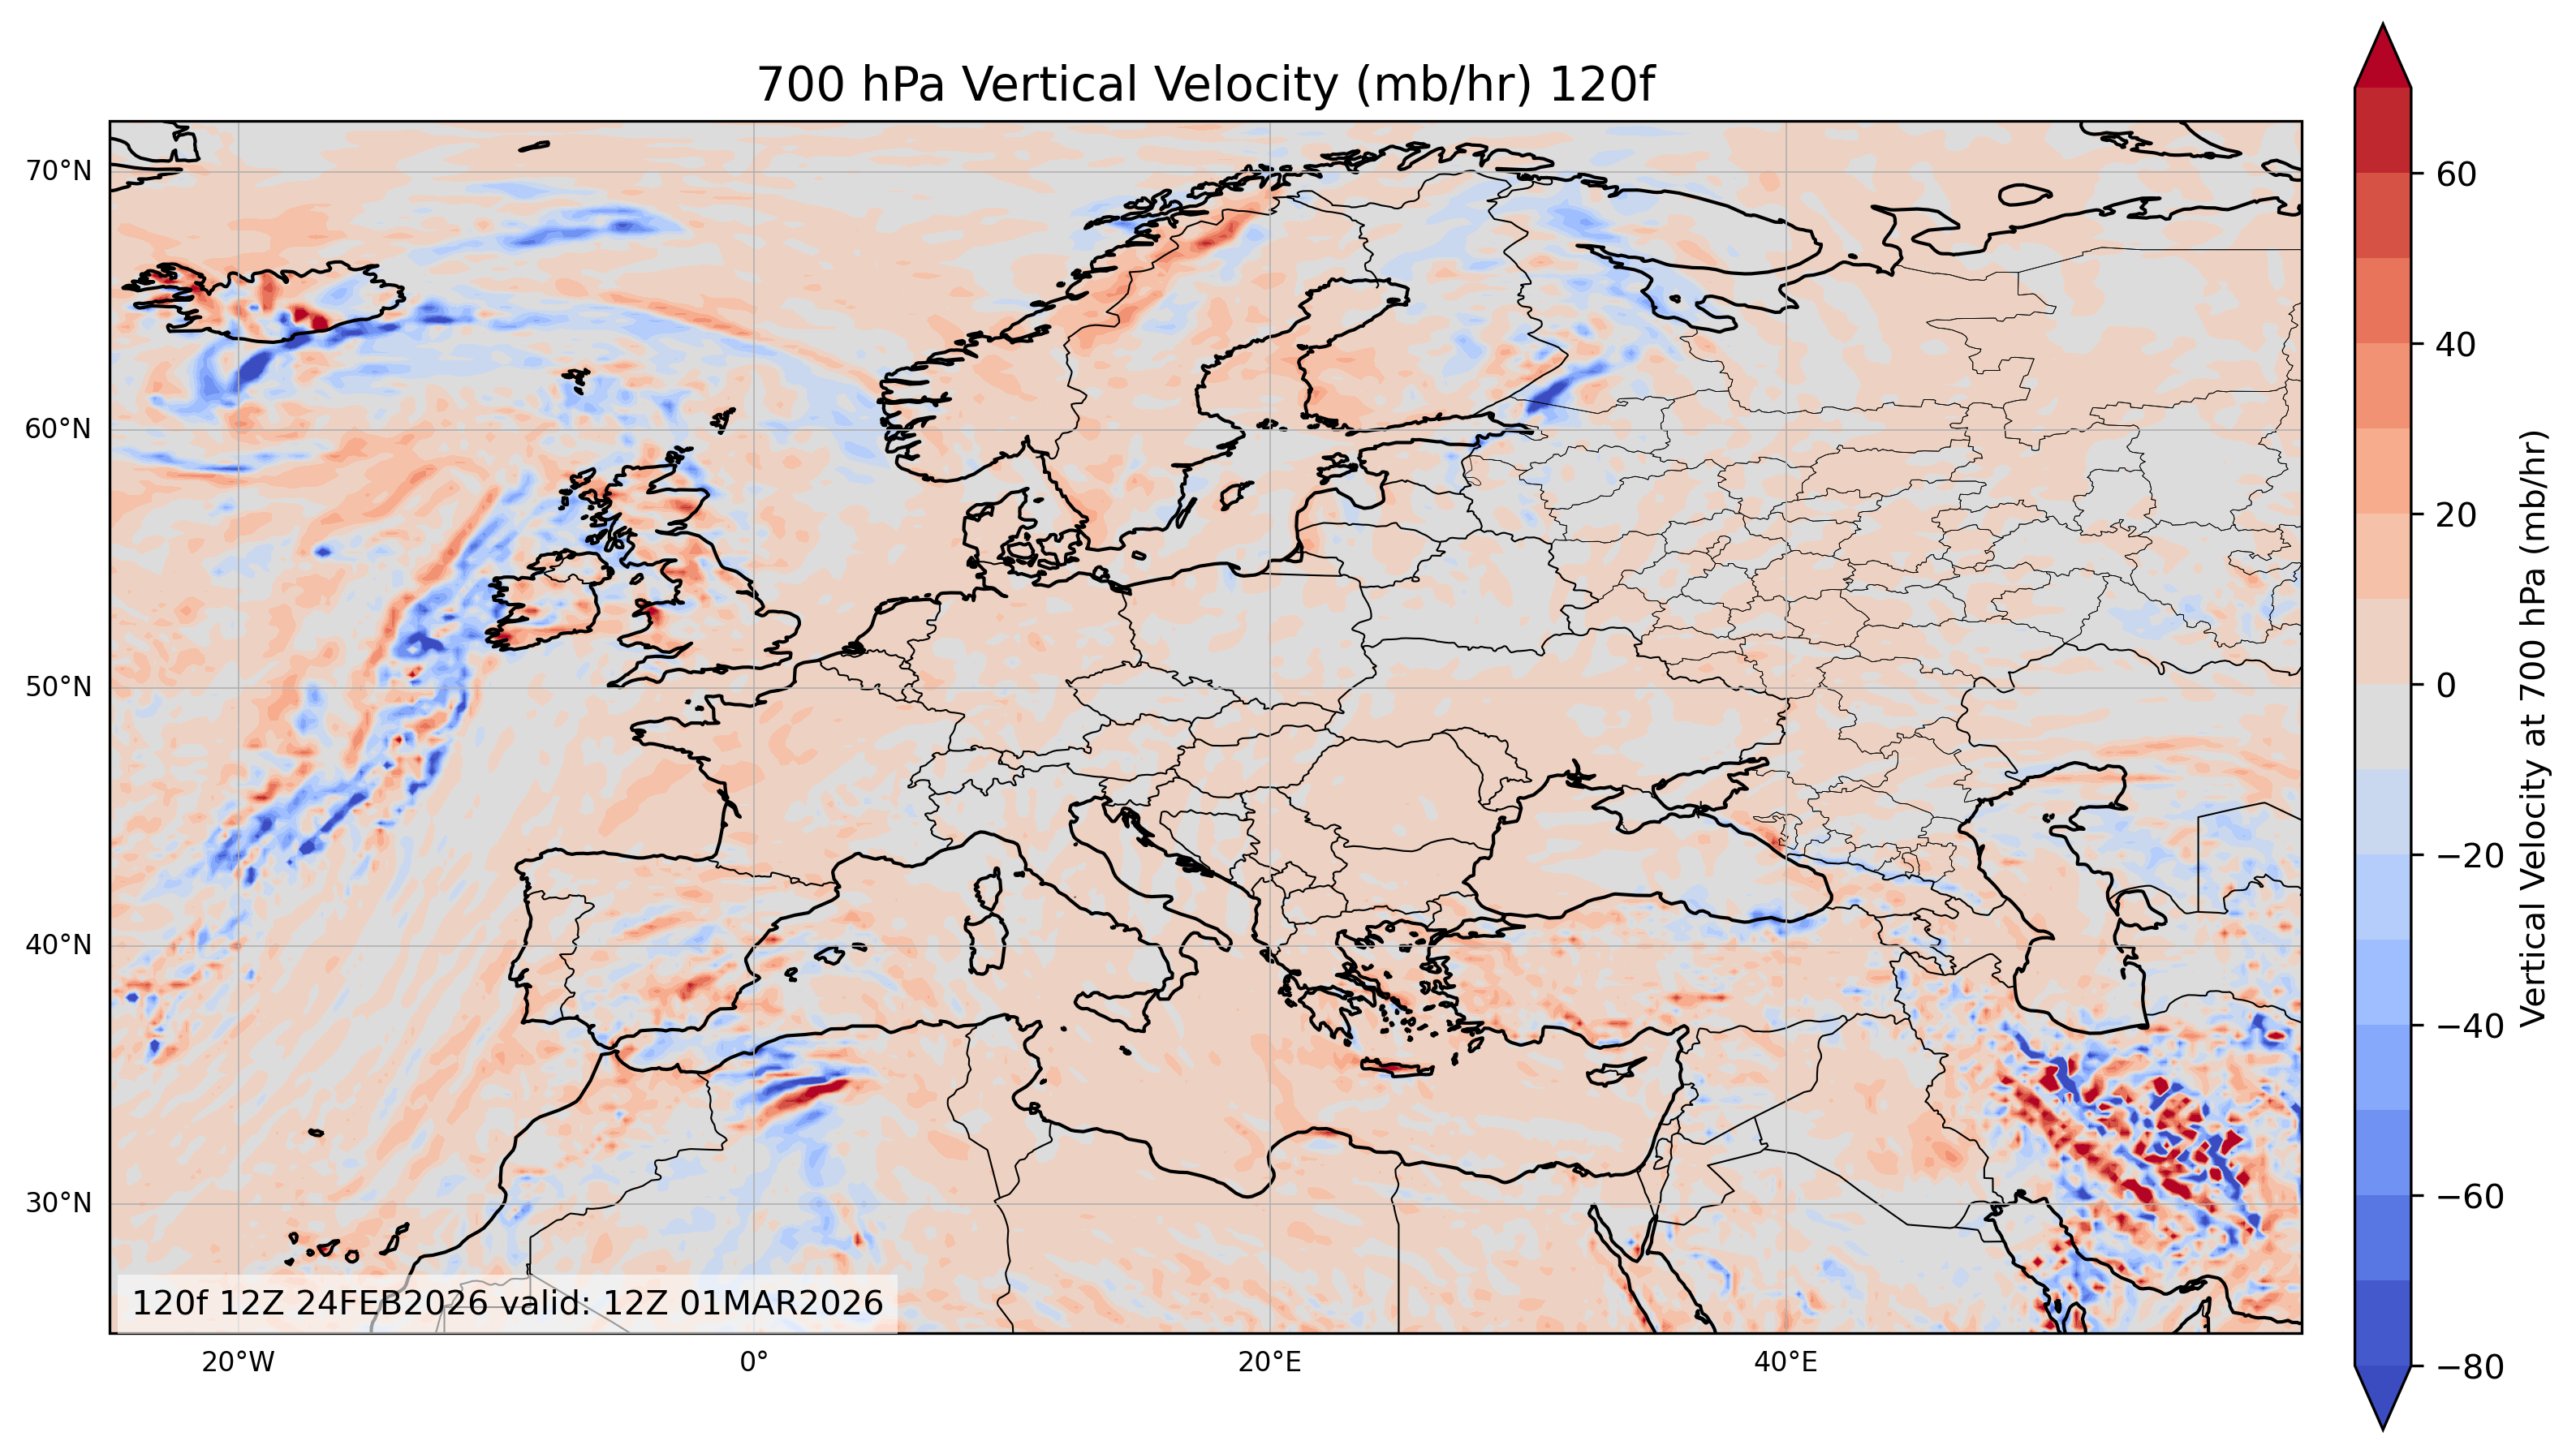
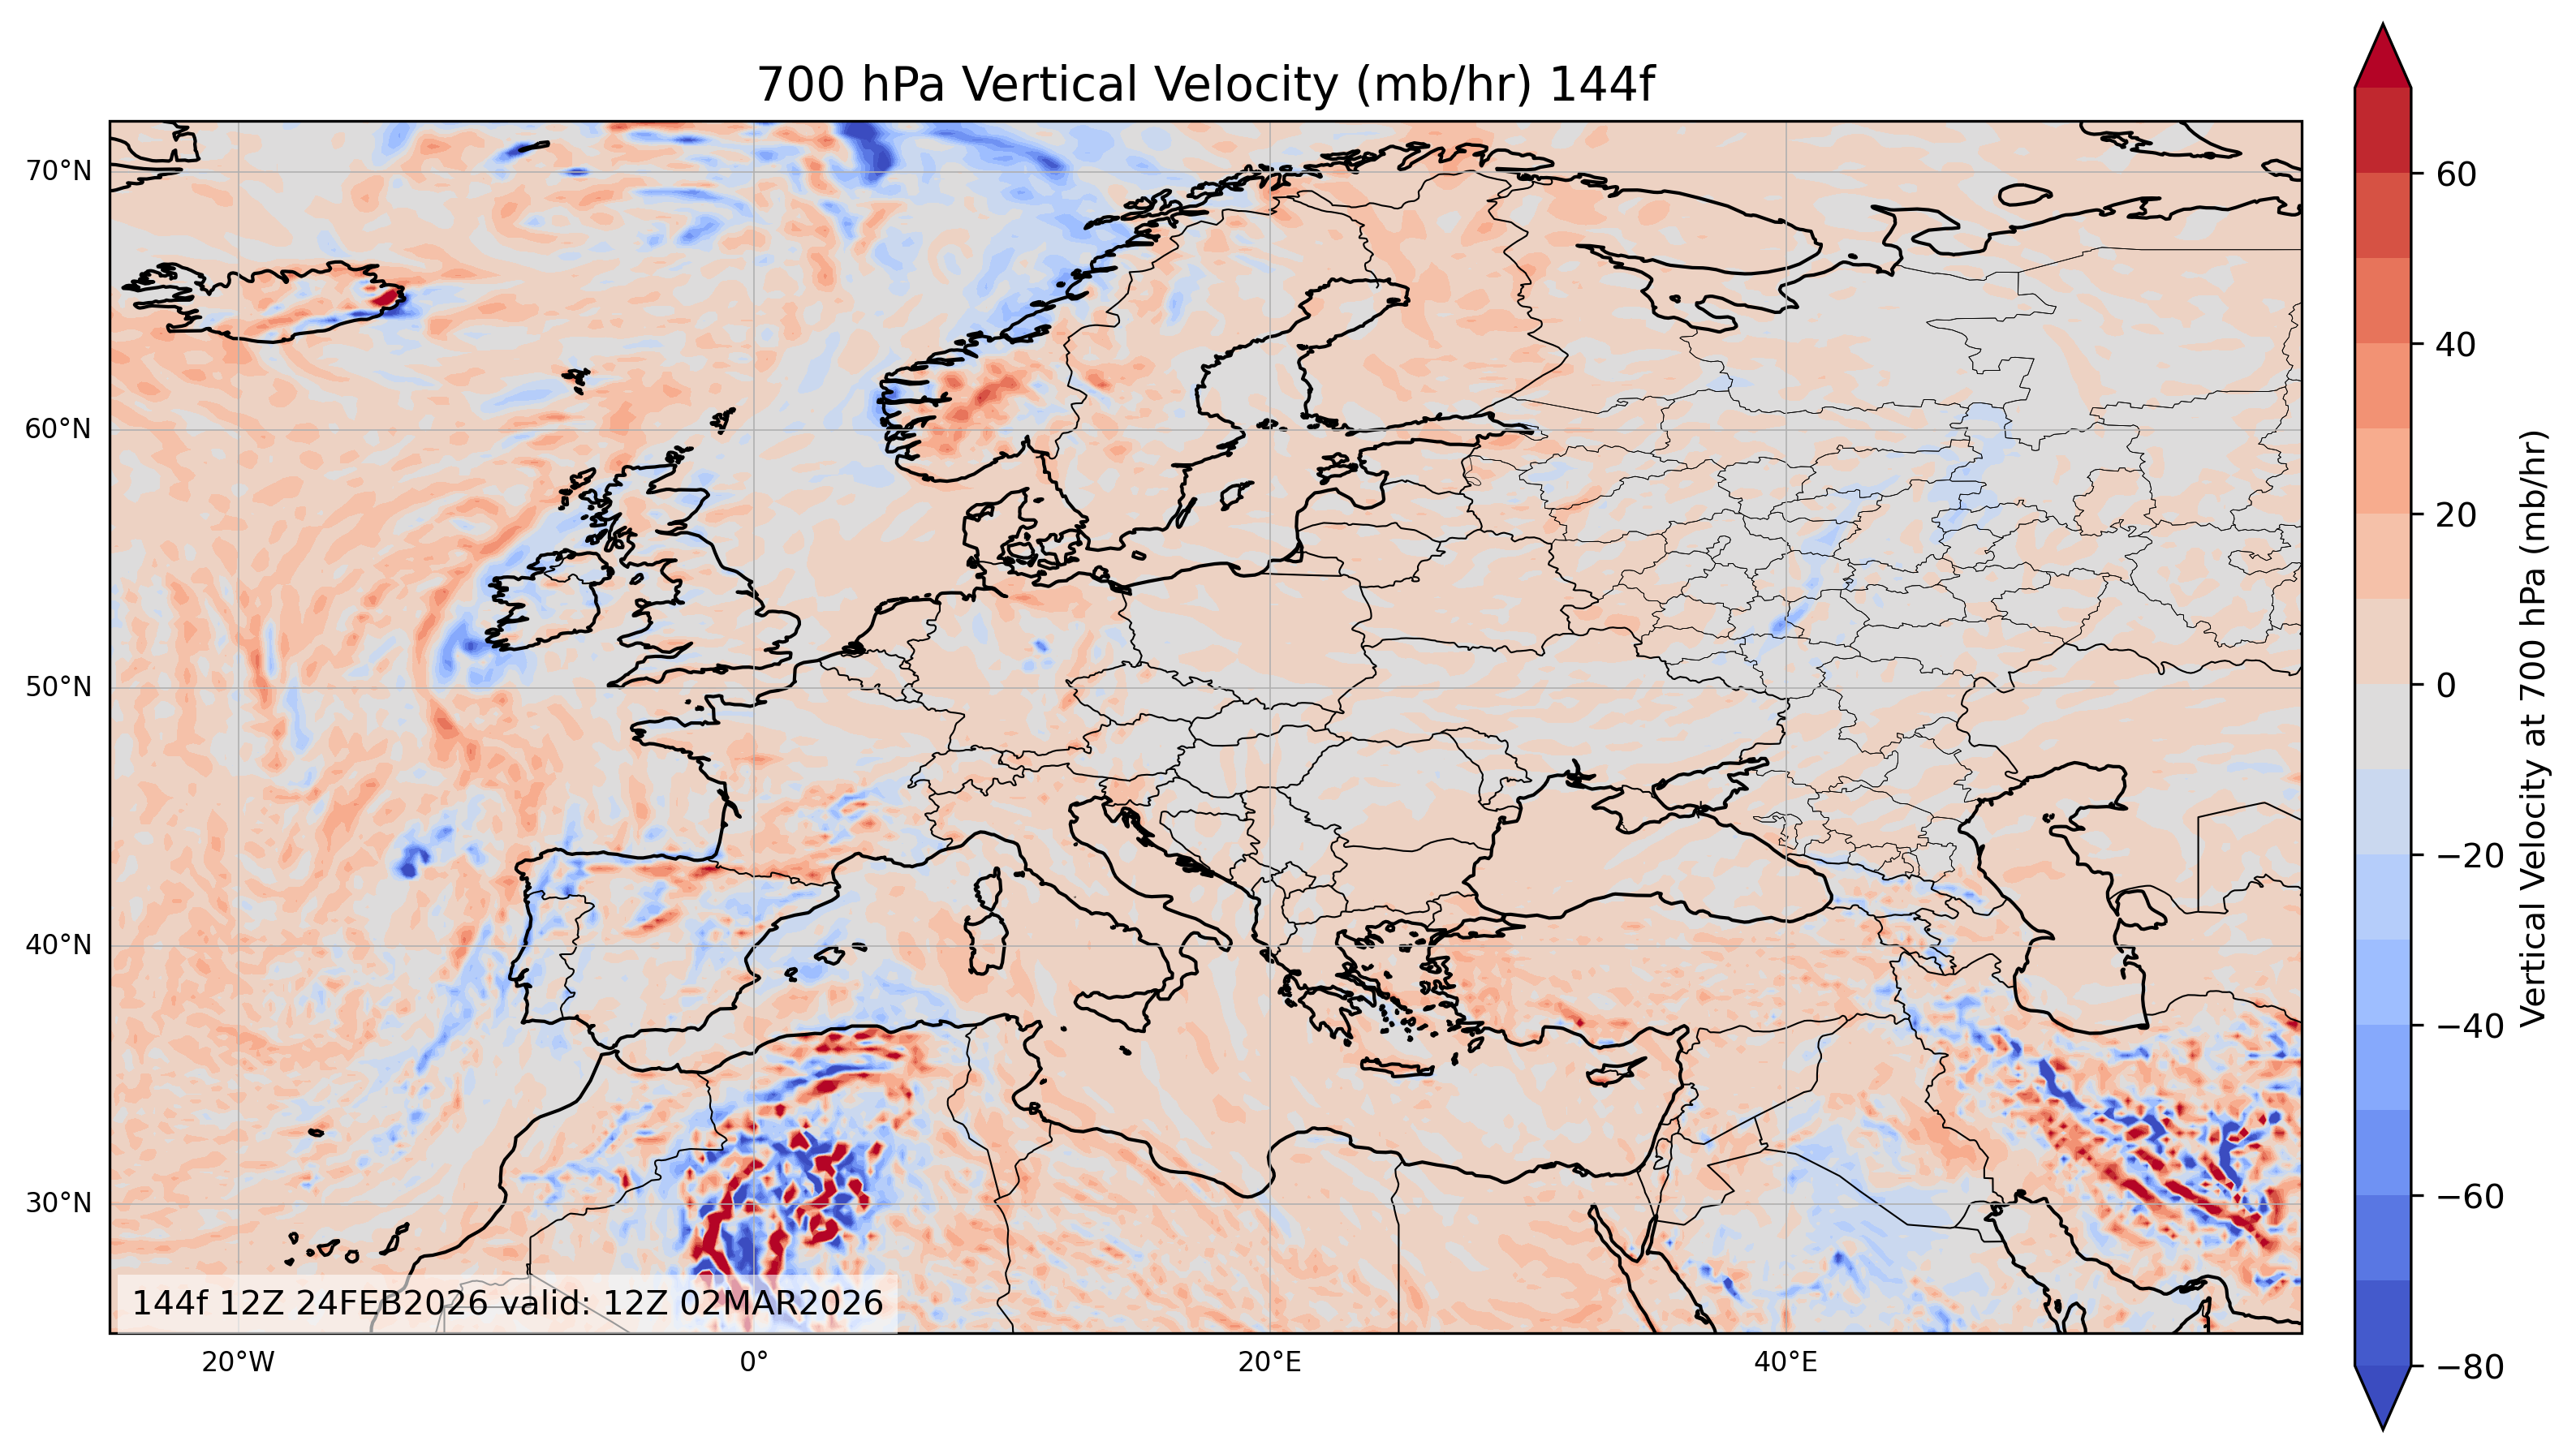
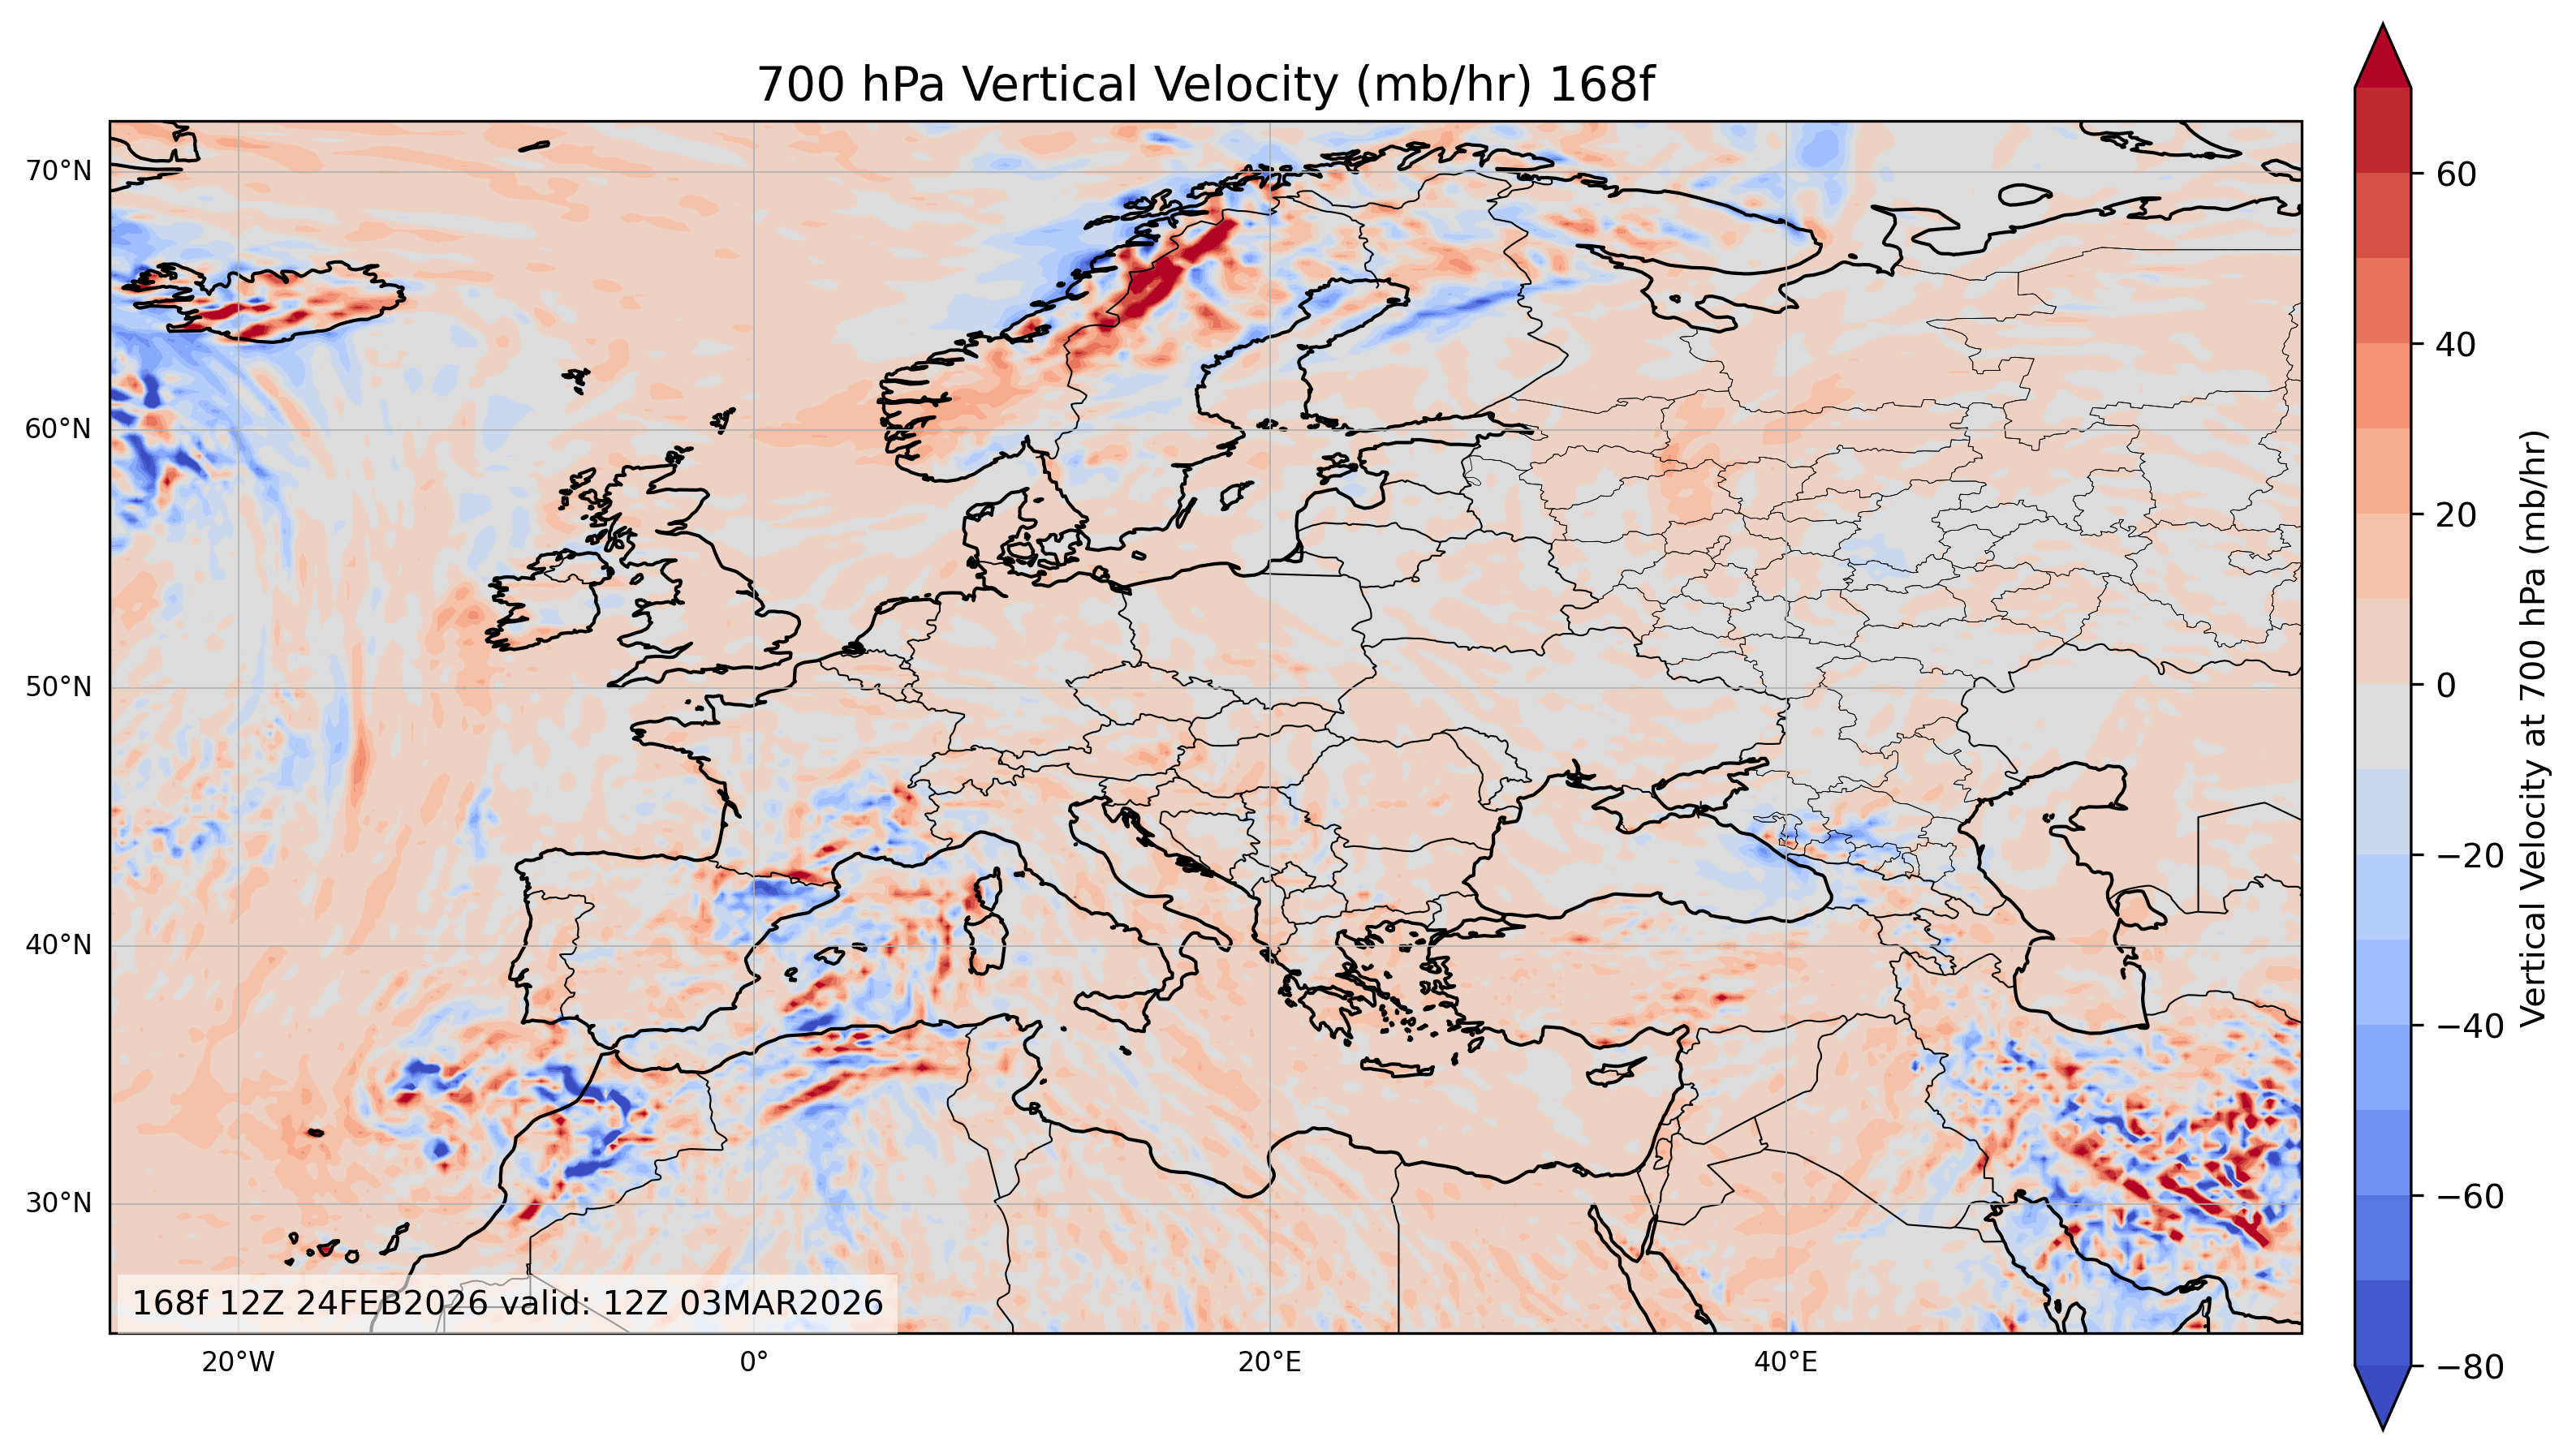
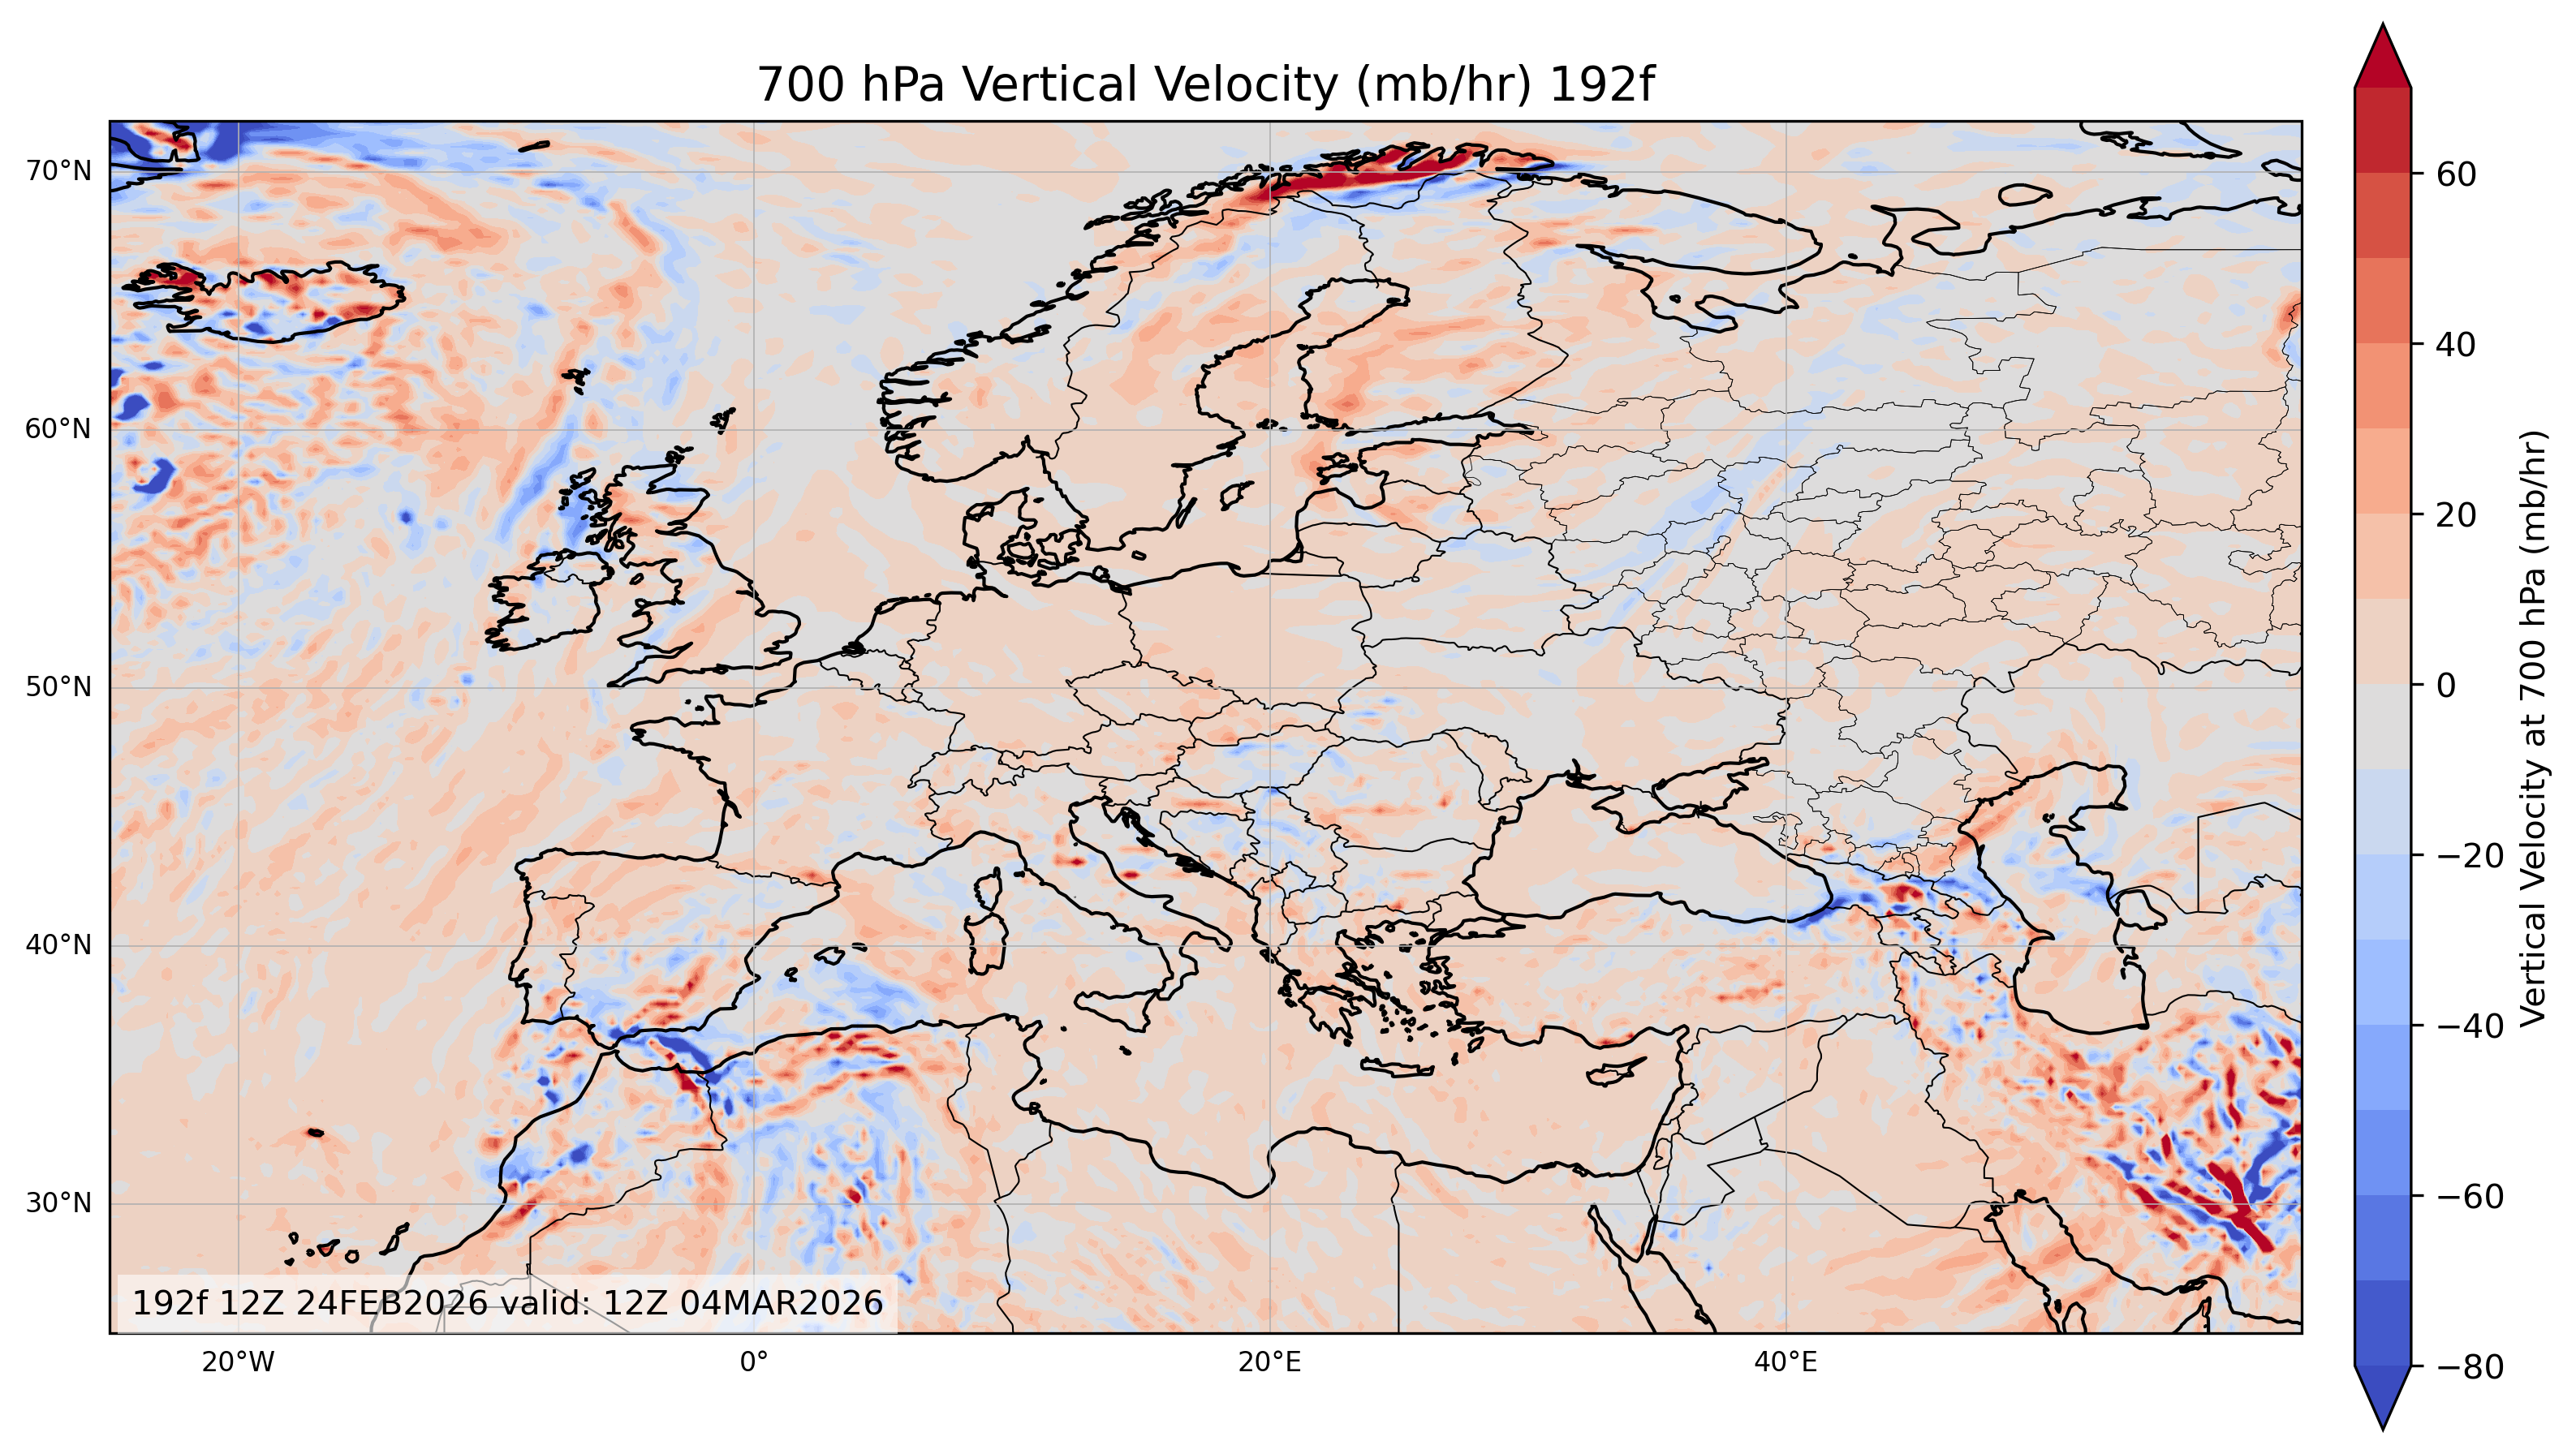
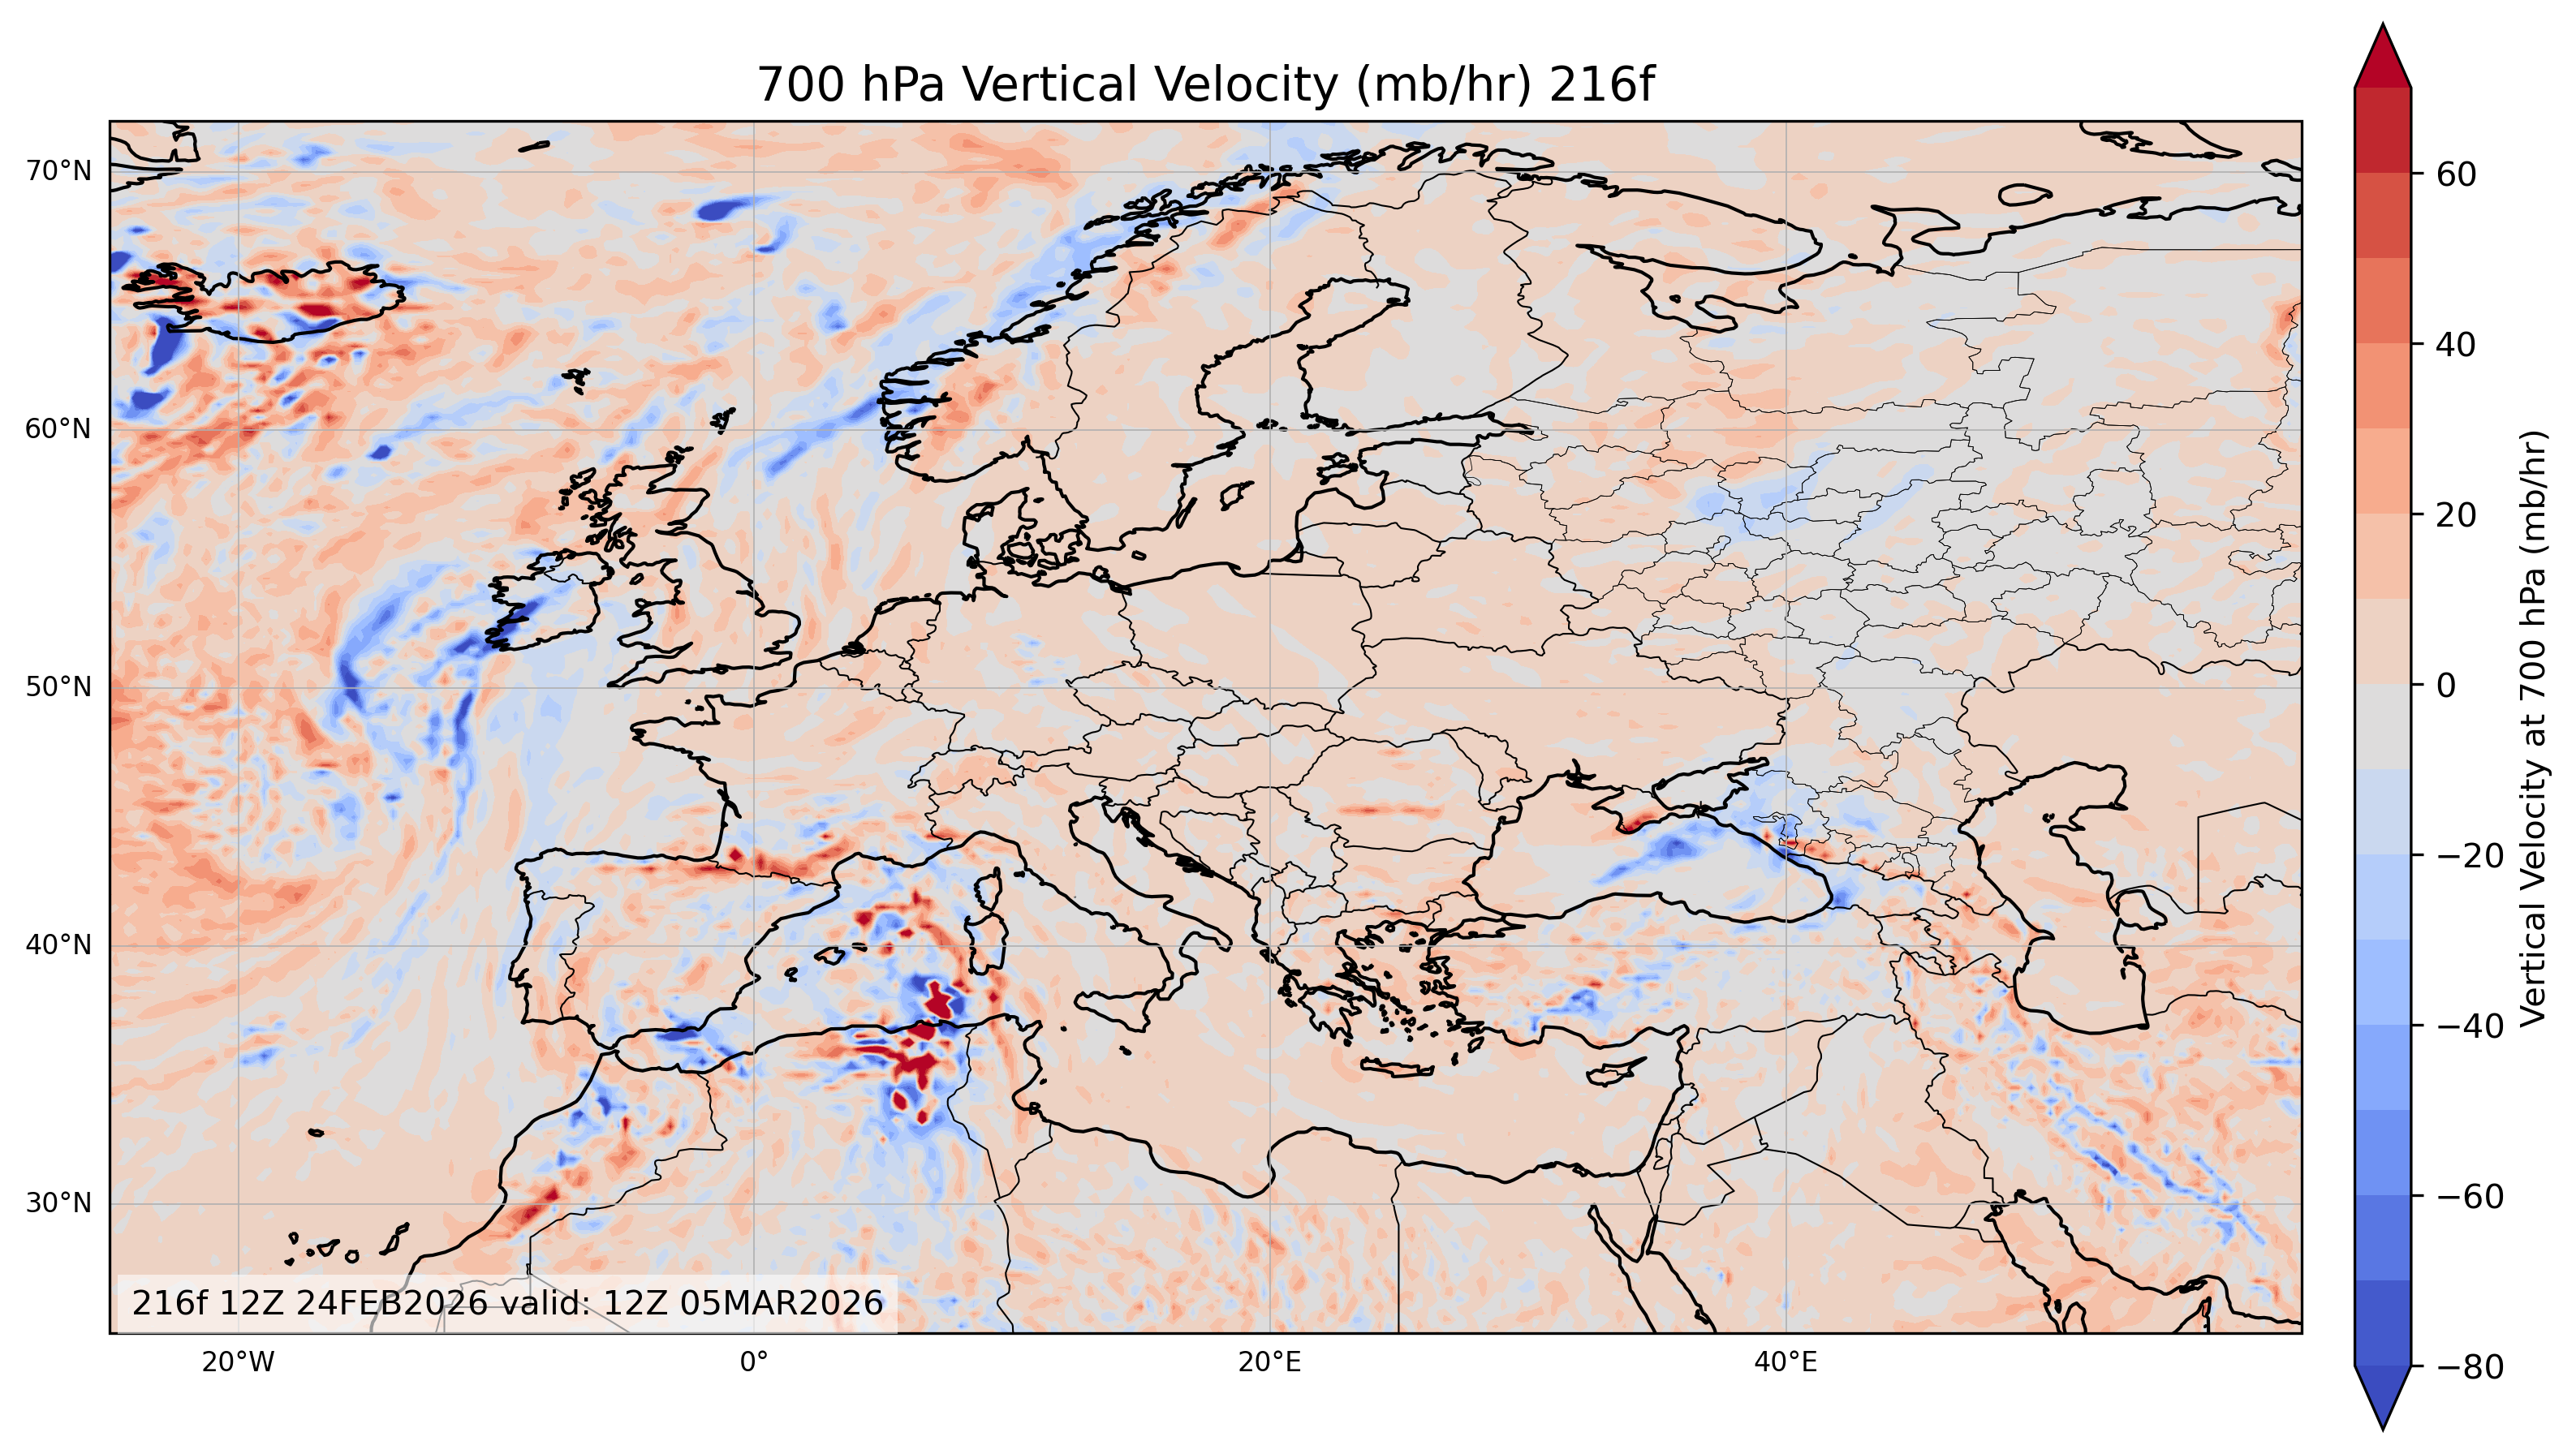
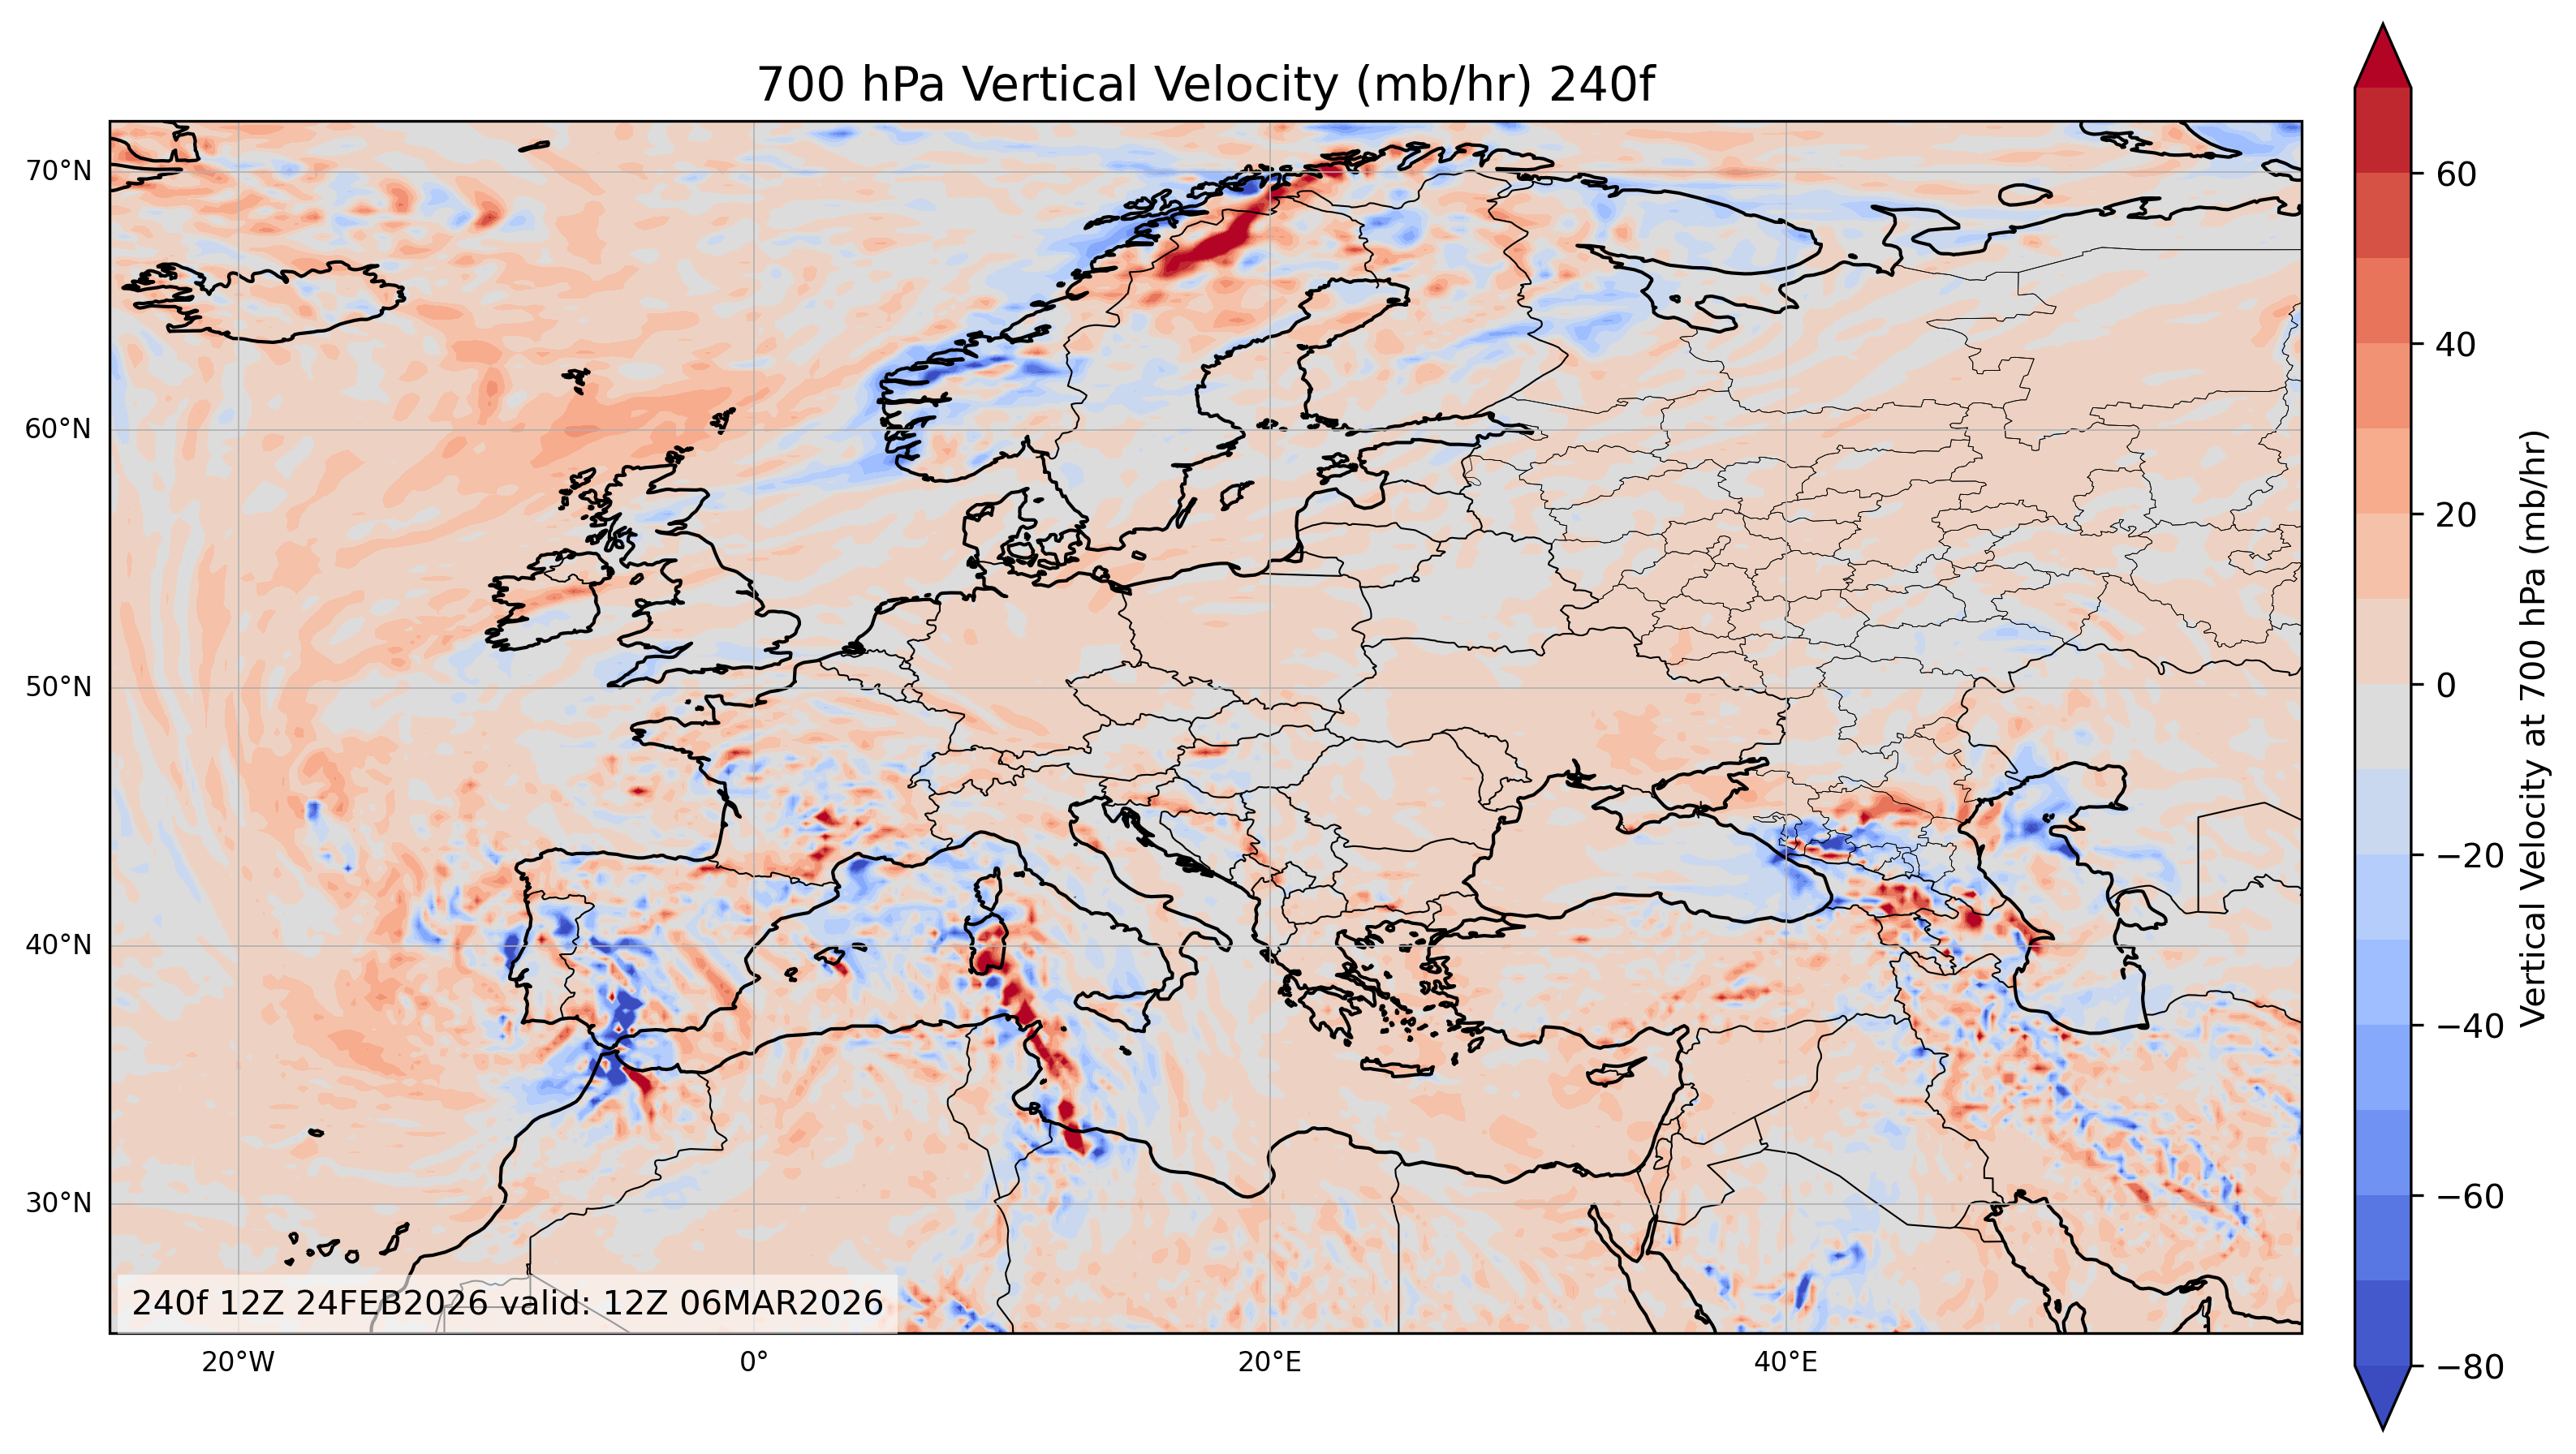
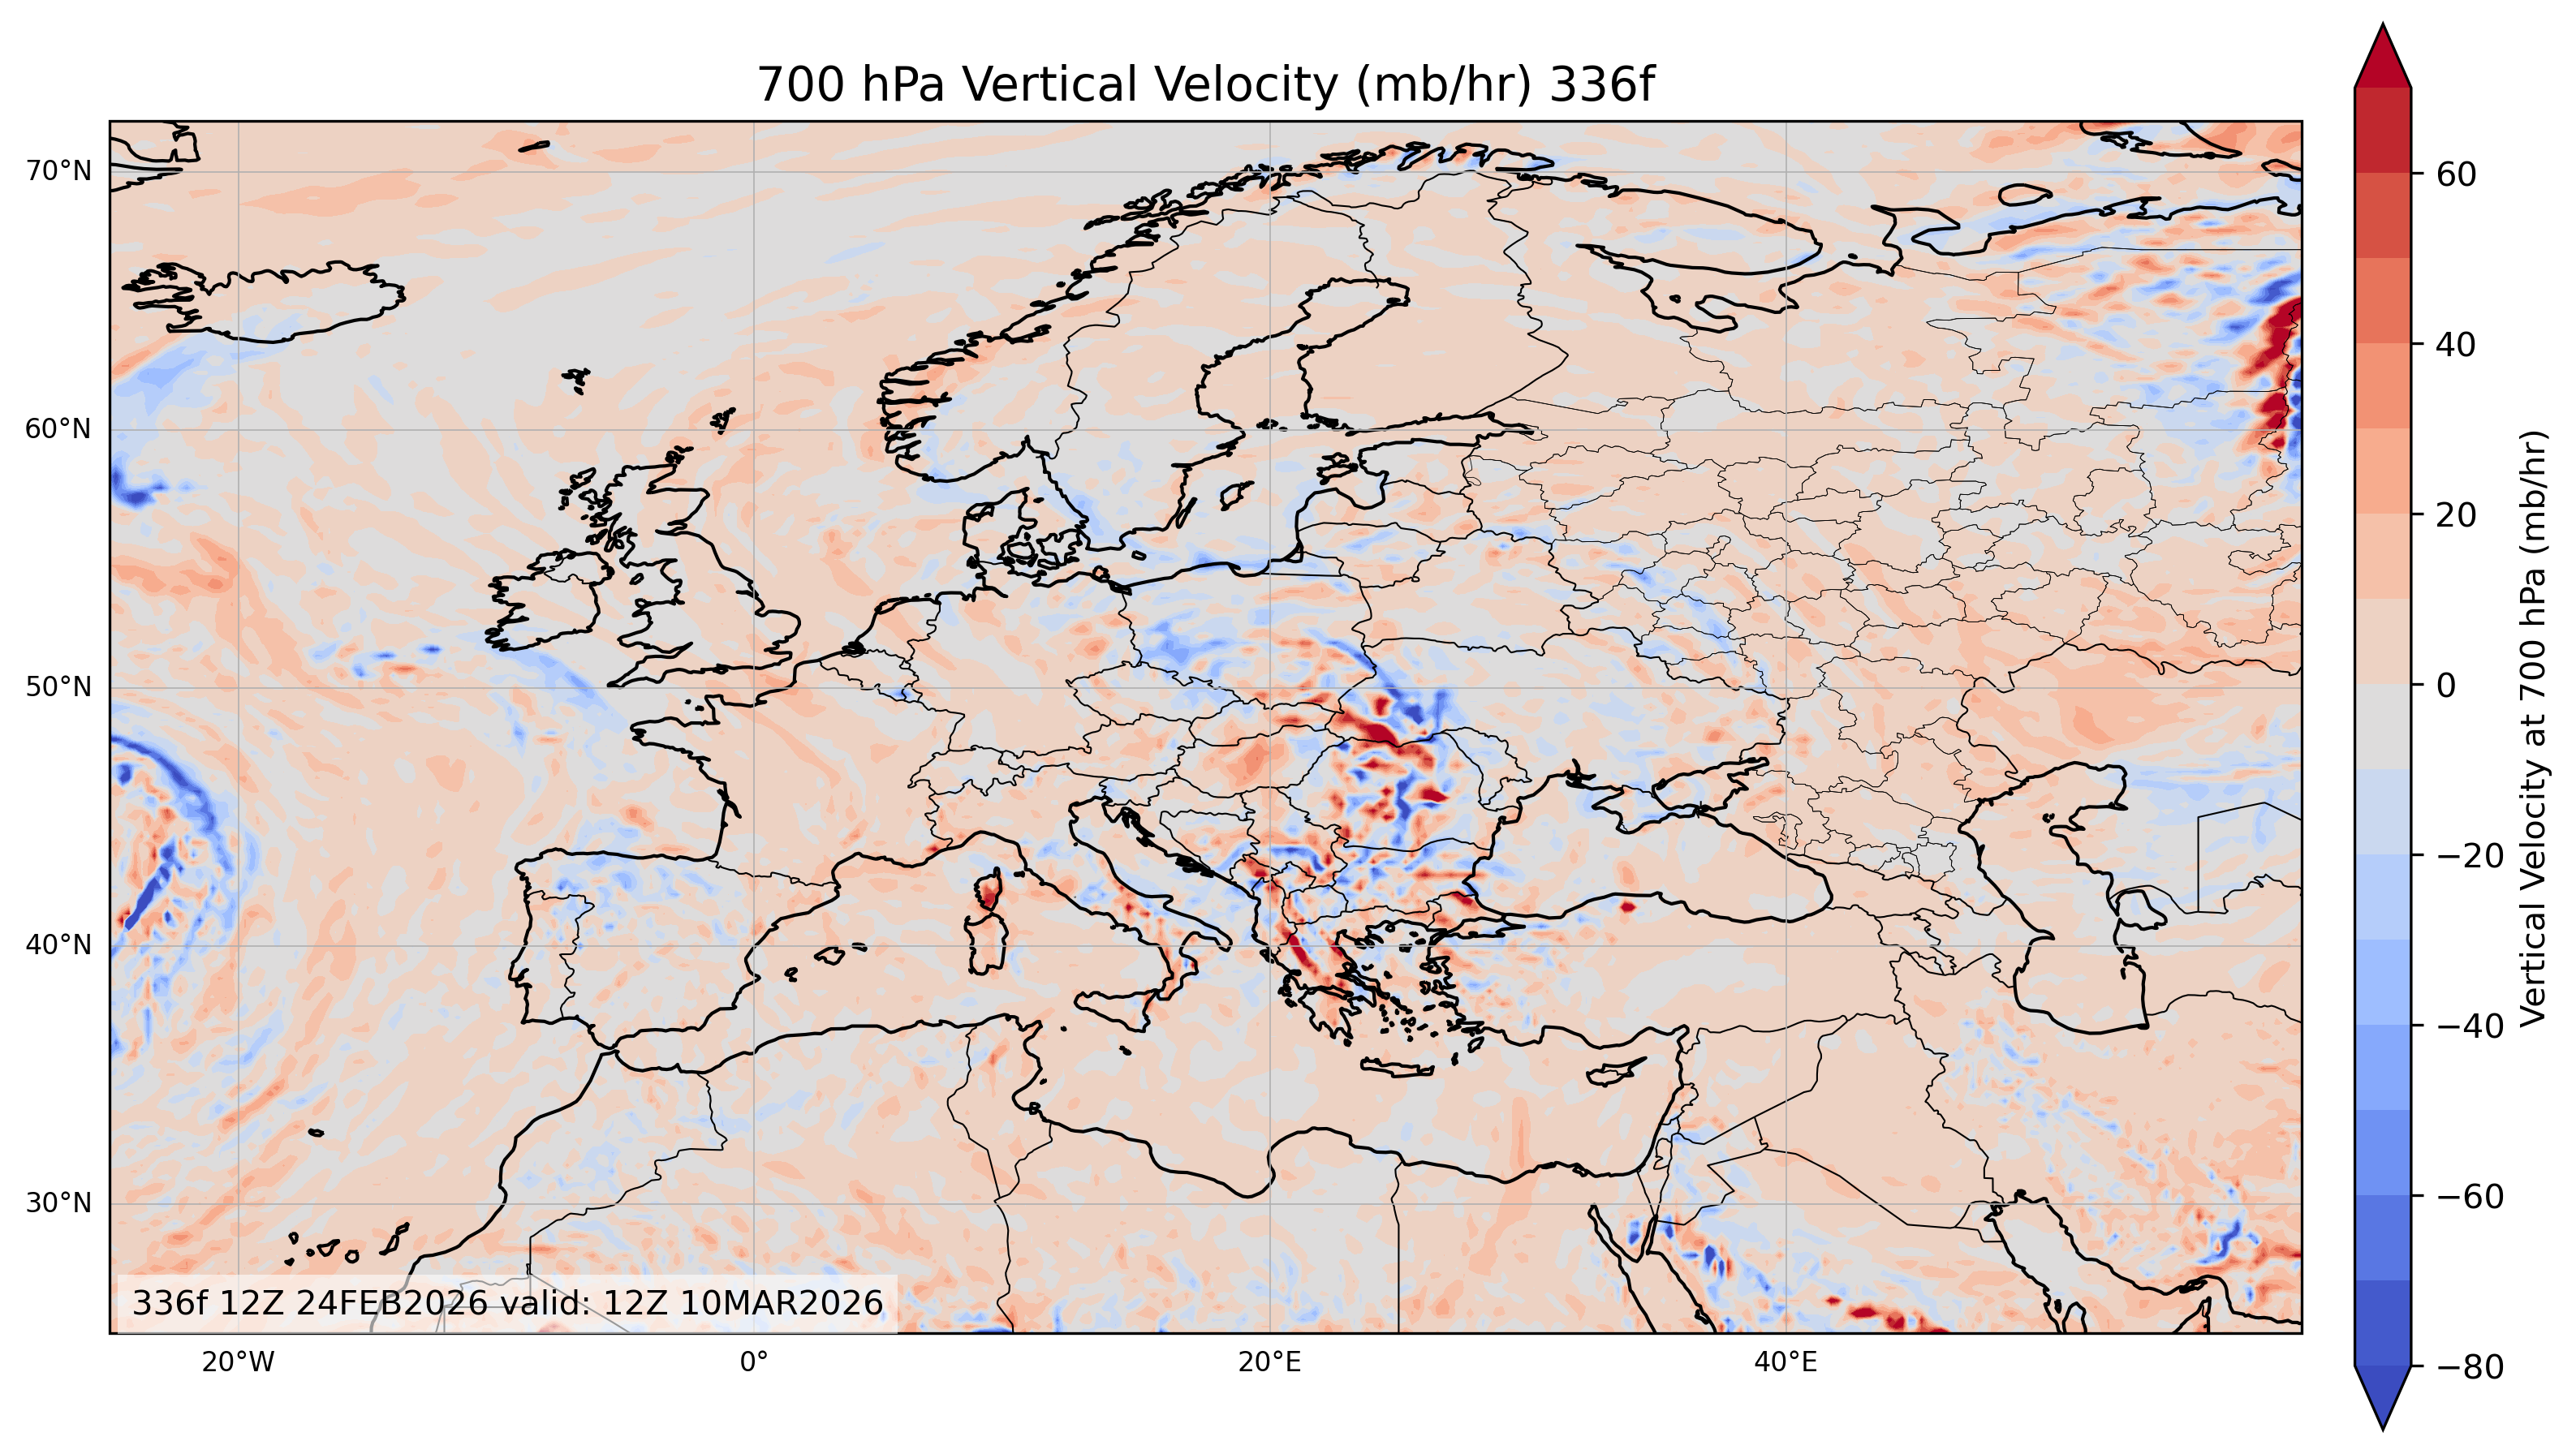
| 700 mb Vertical Velocity (mb/hr) | All Times |
🔍 | 🔍 | 🔍 | 🔍 | 🔍 |
| 850mb Temperature Relative Humidity & Winds |
All Times |
🔍 | 🔍 | 🔍 | 🔍 | 🔍 |
| 200mb Streamlines & Isotachs |
All Times |
🔍 | 🔍 | 🔍 | 🔍 | 🔍 |
| Precipitable Water & Convective Available Potential Energy |
All Times |
🔍 | 🔍 | 🔍 | 🔍 | 🔍 |
| Relative Humidity at 800, 500, & 300mb or Low, Middle, & High Cloud Cover |
All Times |
🔍 | 🔍 | 🔍 | 🔍 | 🔍 |
| Weather Map Images | Time: | Day 5 120 Hours |
Day 6 144 Hours |
Day 7 168 Hours |
Day 8 192 Hours |
Day 9 216 Hours |
| Field: | All Fields |
All Fields |
All Fields |
All Fields |
All Fields |
|
| 500mb Geopotential Height & Vorticity |
All Times |
🔍 | 🔍 | 🔍 | 🔍 | 🔍 |
| Sea Level Pressure & 1000-500mb Thickness |
All Times |
🔍 | 🔍 | 🔍 | 🔍 | 🔍 |
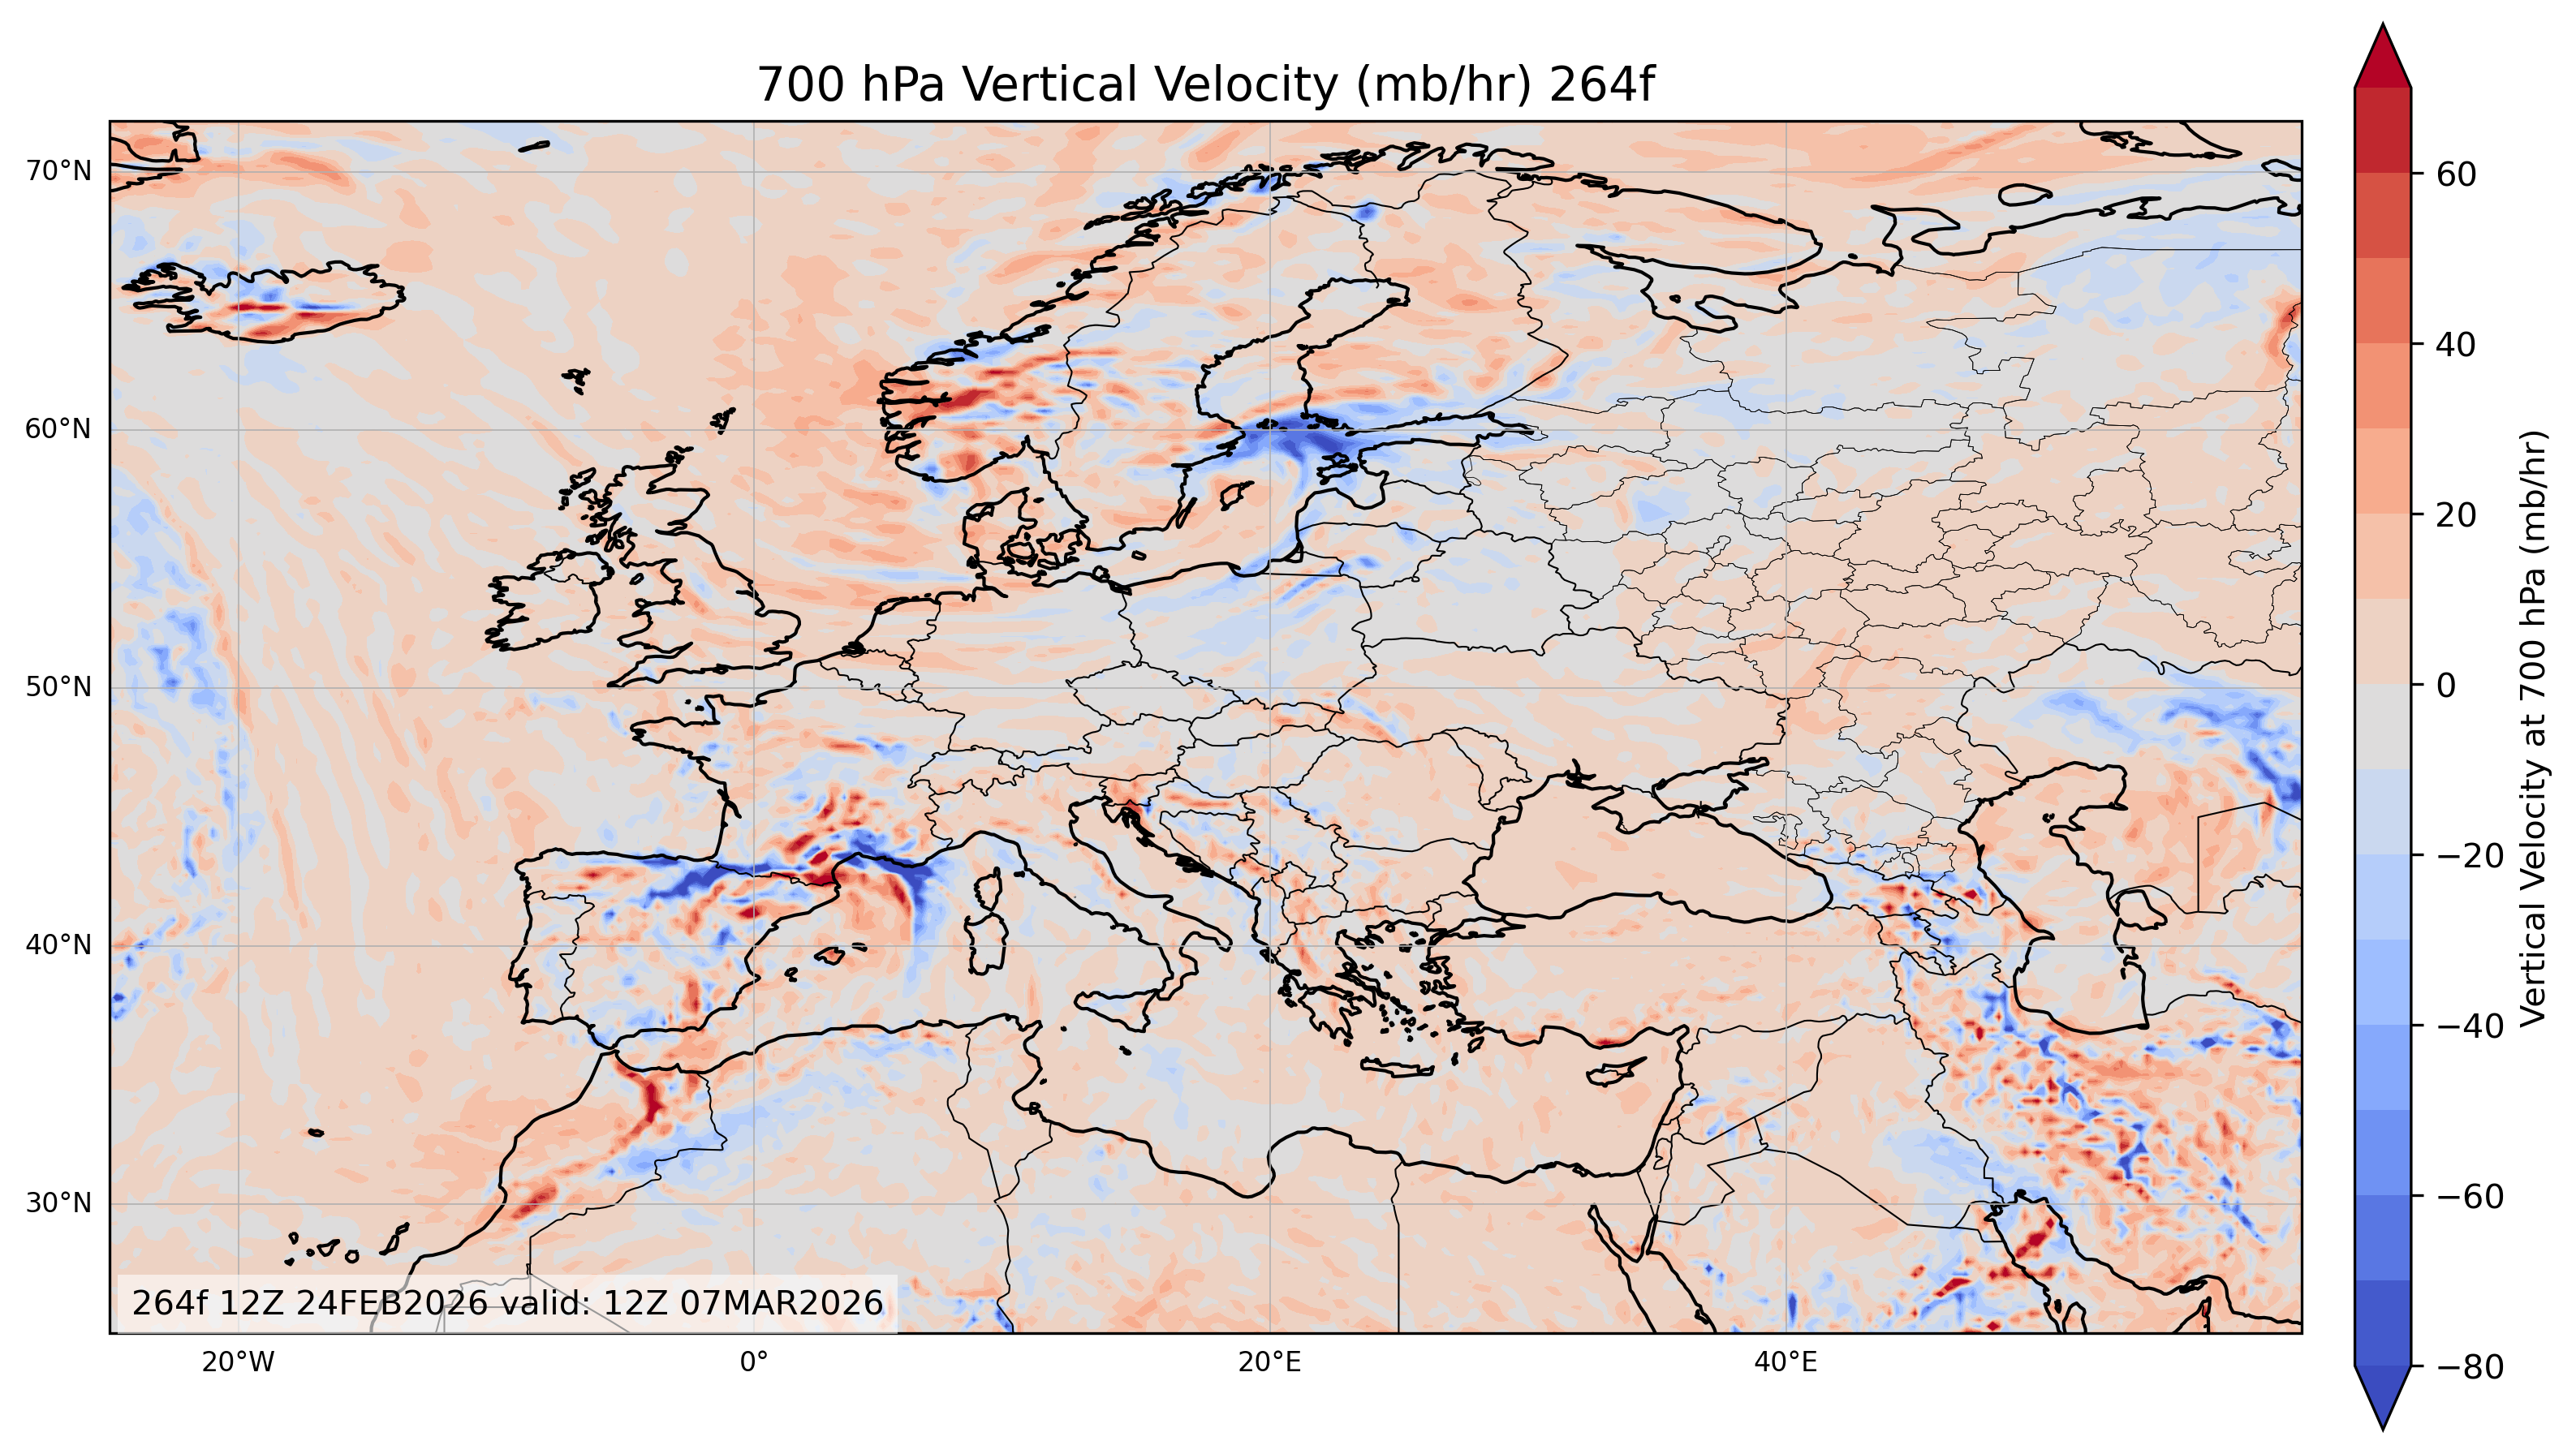
| 700 mb Vertical Velocity (mb/hr) | All Times |
🔍 | 🔍 | 🔍 | 🔍 | 🔍 |
| 850mb Temperature Relative Humidity & Winds |
All Times |
🔍 | 🔍 | 🔍 | 🔍 | 🔍 |
| 200mb Streamlines & Isotachs |
All Times |
🔍 | 🔍 | 🔍 | 🔍 | 🔍 |
| Precipitable Water & Convective Available Potential Energy |
All Times |
🔍 | 🔍 | 🔍 | 🔍 | 🔍 |
| Relative Humidity at 800, 500, & 300mb or Low, Middle, & High Cloud Cover |
All Times |
🔍 | 🔍 | 🔍 | 🔍 | 🔍 |
| Weather Map Images | Time: | Day 10 240 Hours |
Day 11 264 Hours |
Day 12 288 Hours |
Day 13 312 Hours |
Day 14 336 Hours |
| Field: | All Fields |
All Fields |
All Fields |
All Fields |
All Fields |
|
| 500mb Geopotential Height & Vorticity |
All Times |
🔍 | 🔍 | 🔍 | 🔍 | 🔍 |
| Sea Level Pressure & 1000-500mb Thickness |
All Times |
🔍 | 🔍 | 🔍 | 🔍 | 🔍 |
| 700 mb Vertical Velocity (mb/hr) | All Times |
🔍 | 🔍 | 🔍 | 🔍 | 🔍 |
| 850mb Temperature Relative Humidity & Winds |
All Times |
🔍 | 🔍 | 🔍 | 🔍 | 🔍 |
| 200mb Streamlines & Isotachs |
All Times |
🔍 | 🔍 | 🔍 | 🔍 | 🔍 |
| Precipitable Water & Convective Available Potential Energy |
All Times |
🔍 | 🔍 | 🔍 | 🔍 | 🔍 |
| Relative Humidity at 800, 500, & 300mb or Low, Middle, & High Cloud Cover |
All Times |
🔍 | 🔍 | 🔍 | 🔍 | 🔍 |
Europe Forecast Animation Player
WXMAPS Europe provides advanced meteorological forecast maps that visualize atmospheric data across Europe. The platform allows users to explore short-term weather predictions at 24-hour, 48-hour, and 72-hour intervals. Each map is based on model outputs that help meteorologists, researchers, and weather enthusiasts analyze atmospheric conditions in great detail.

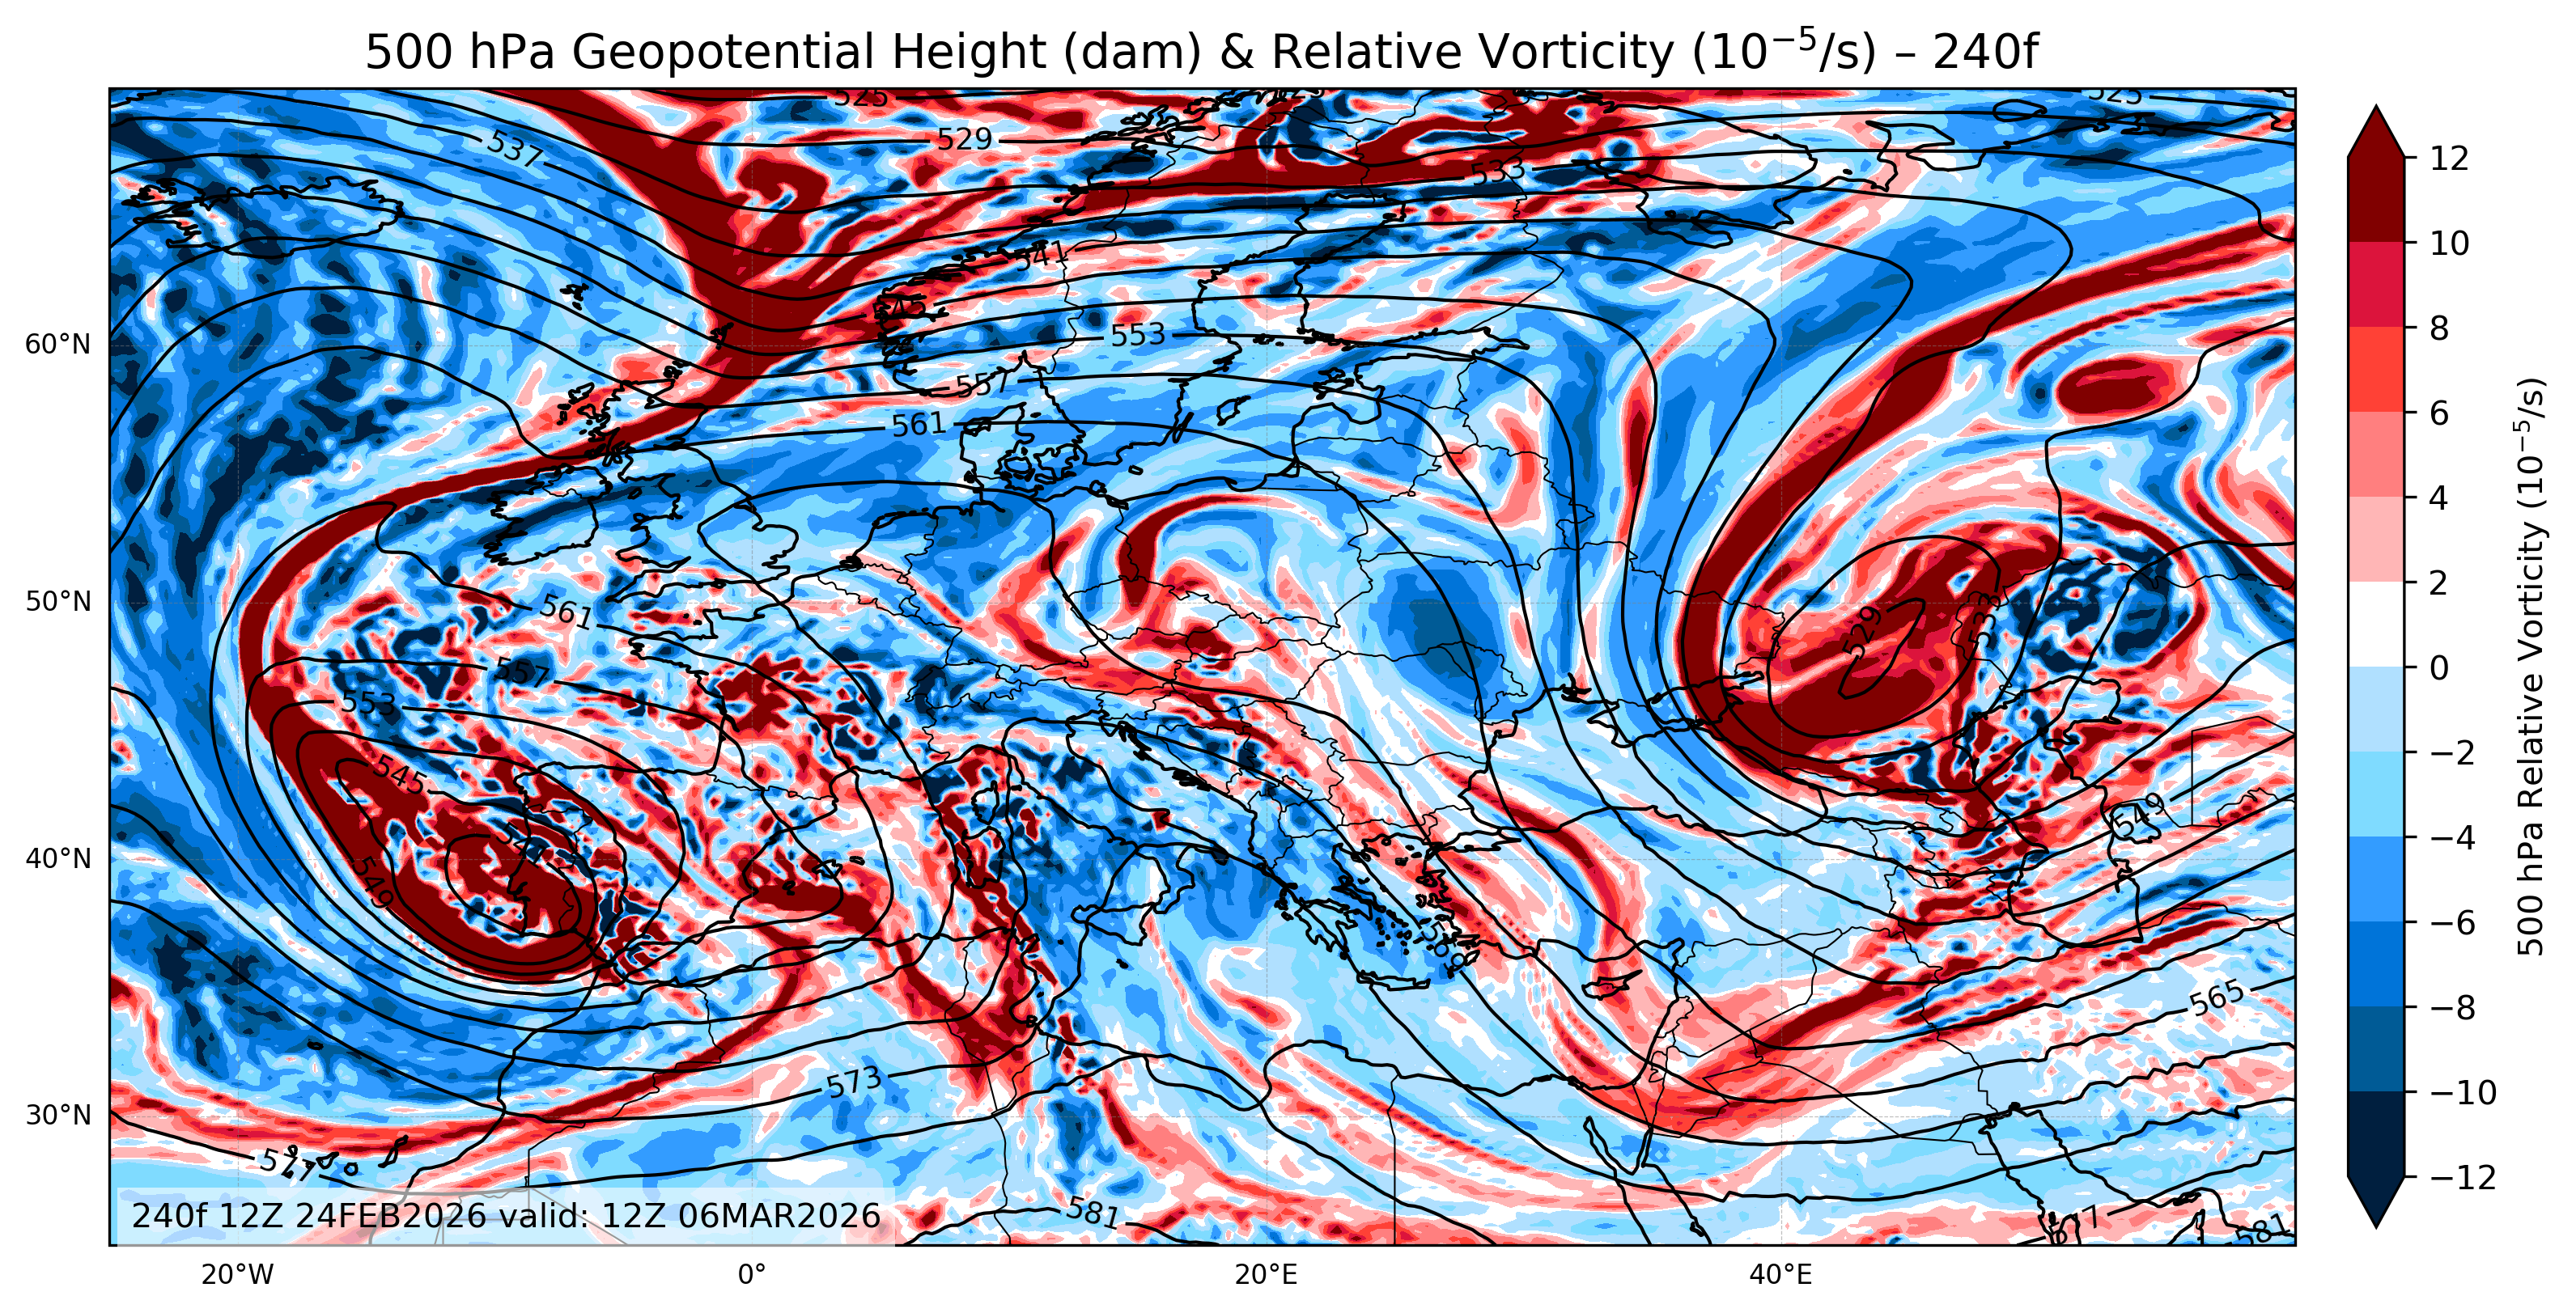
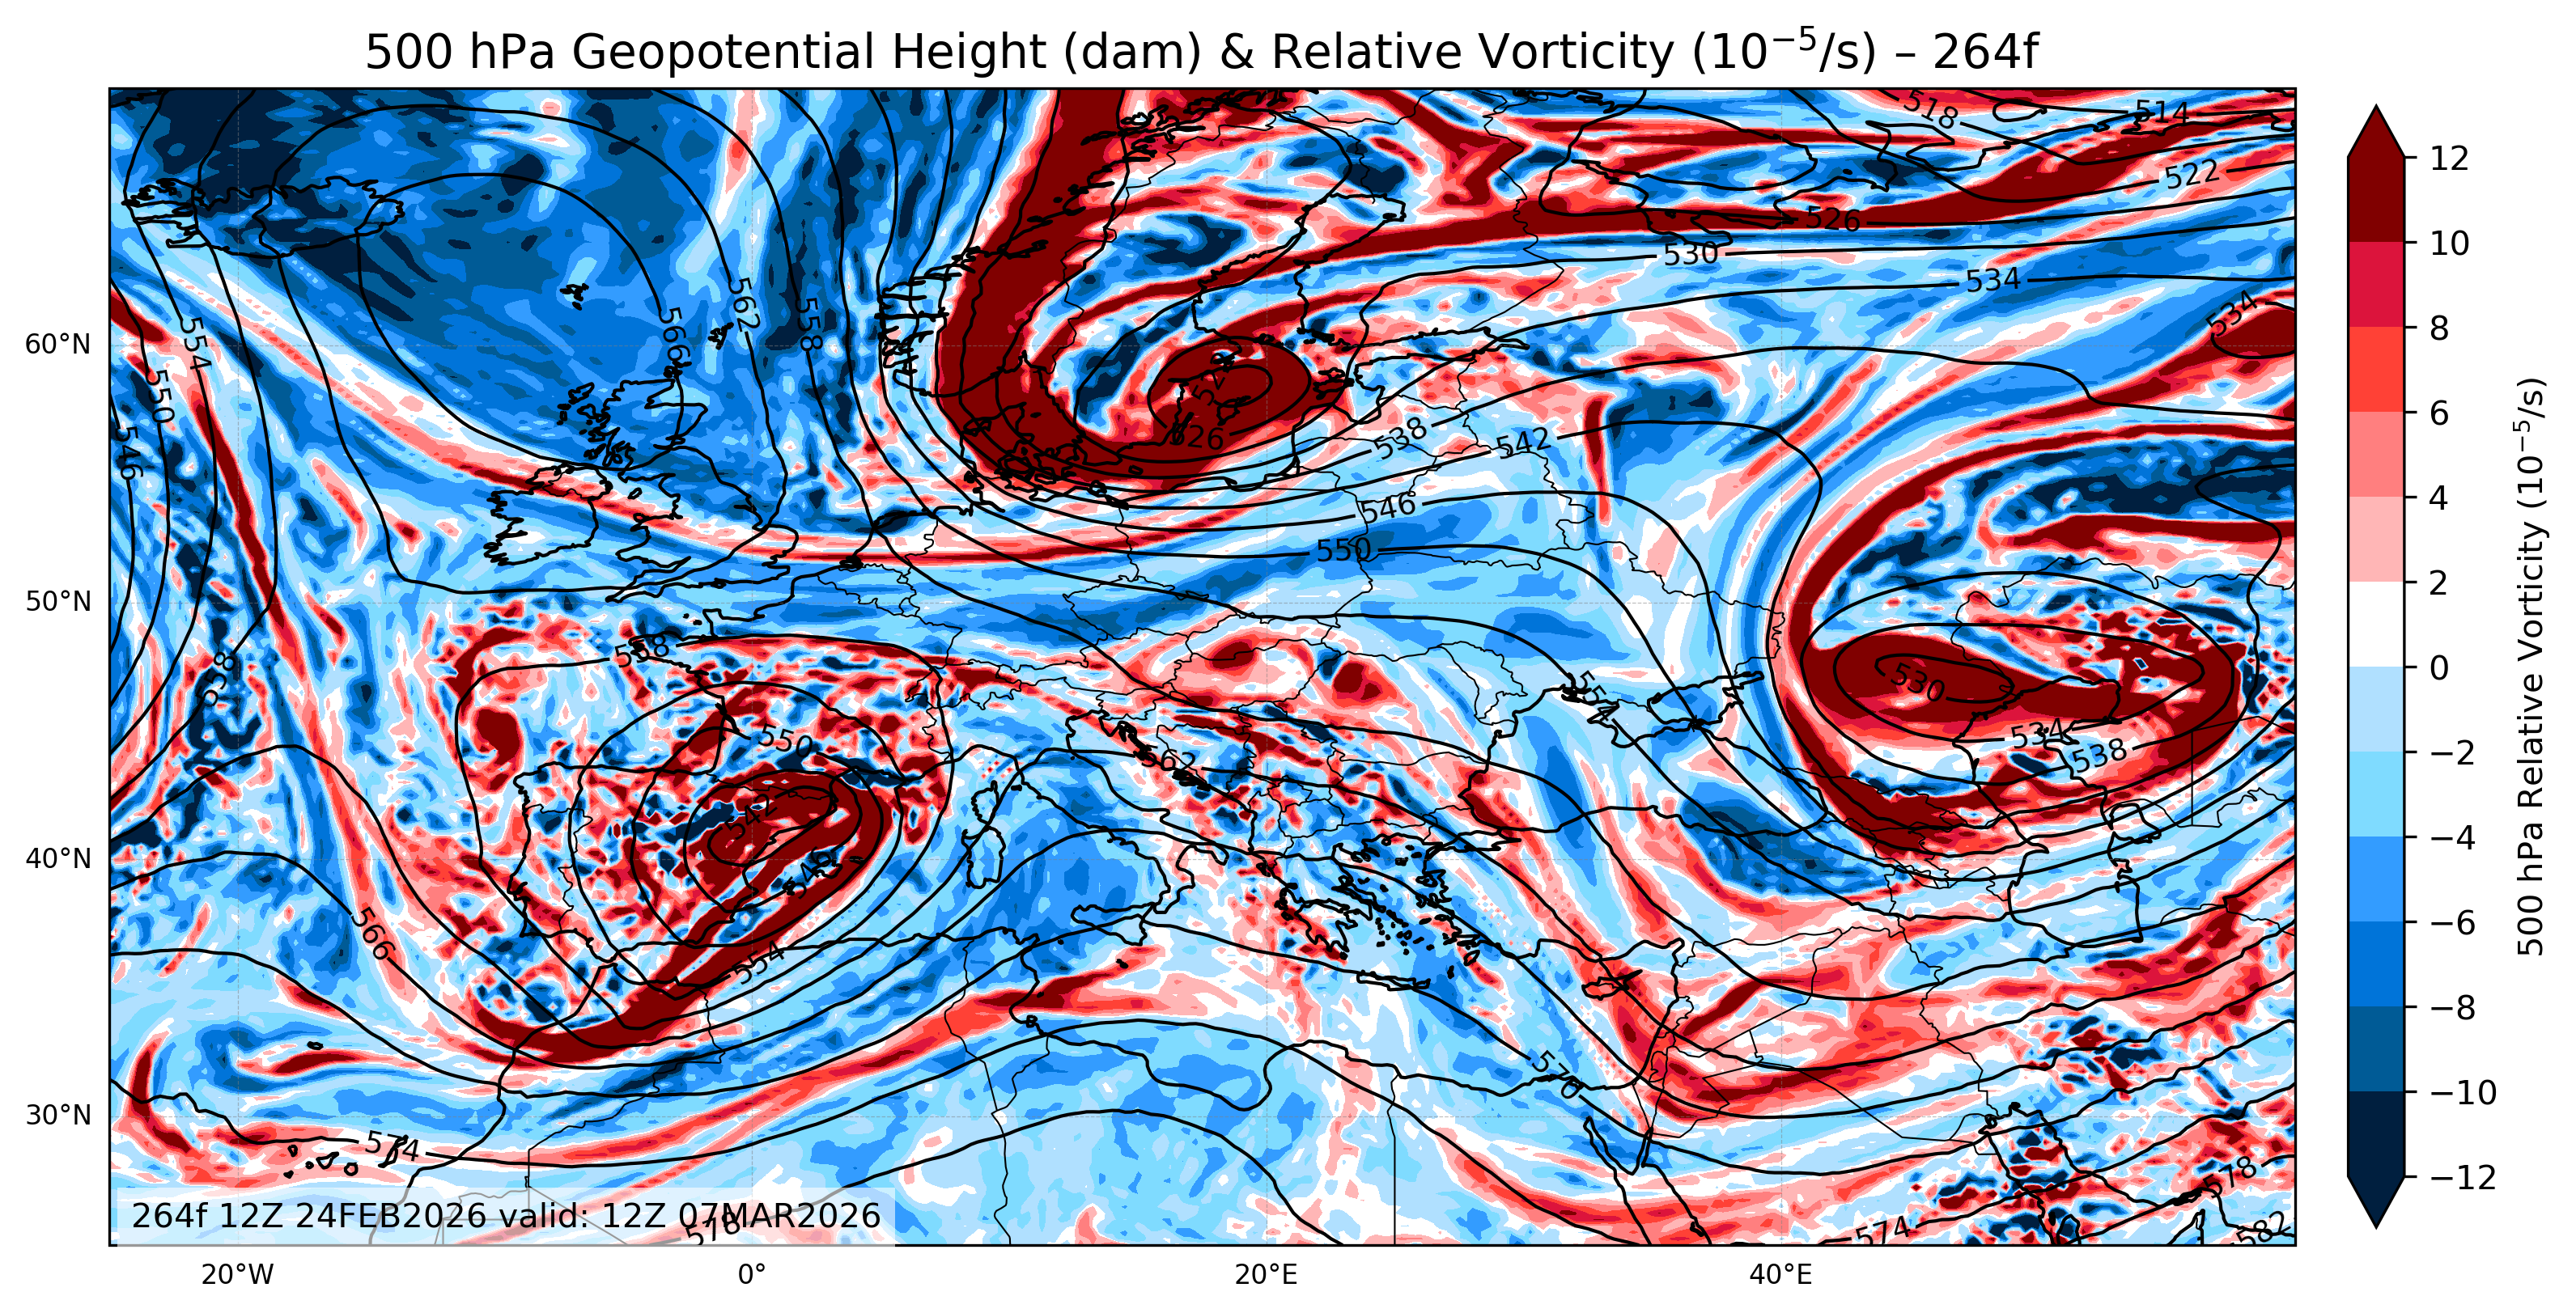
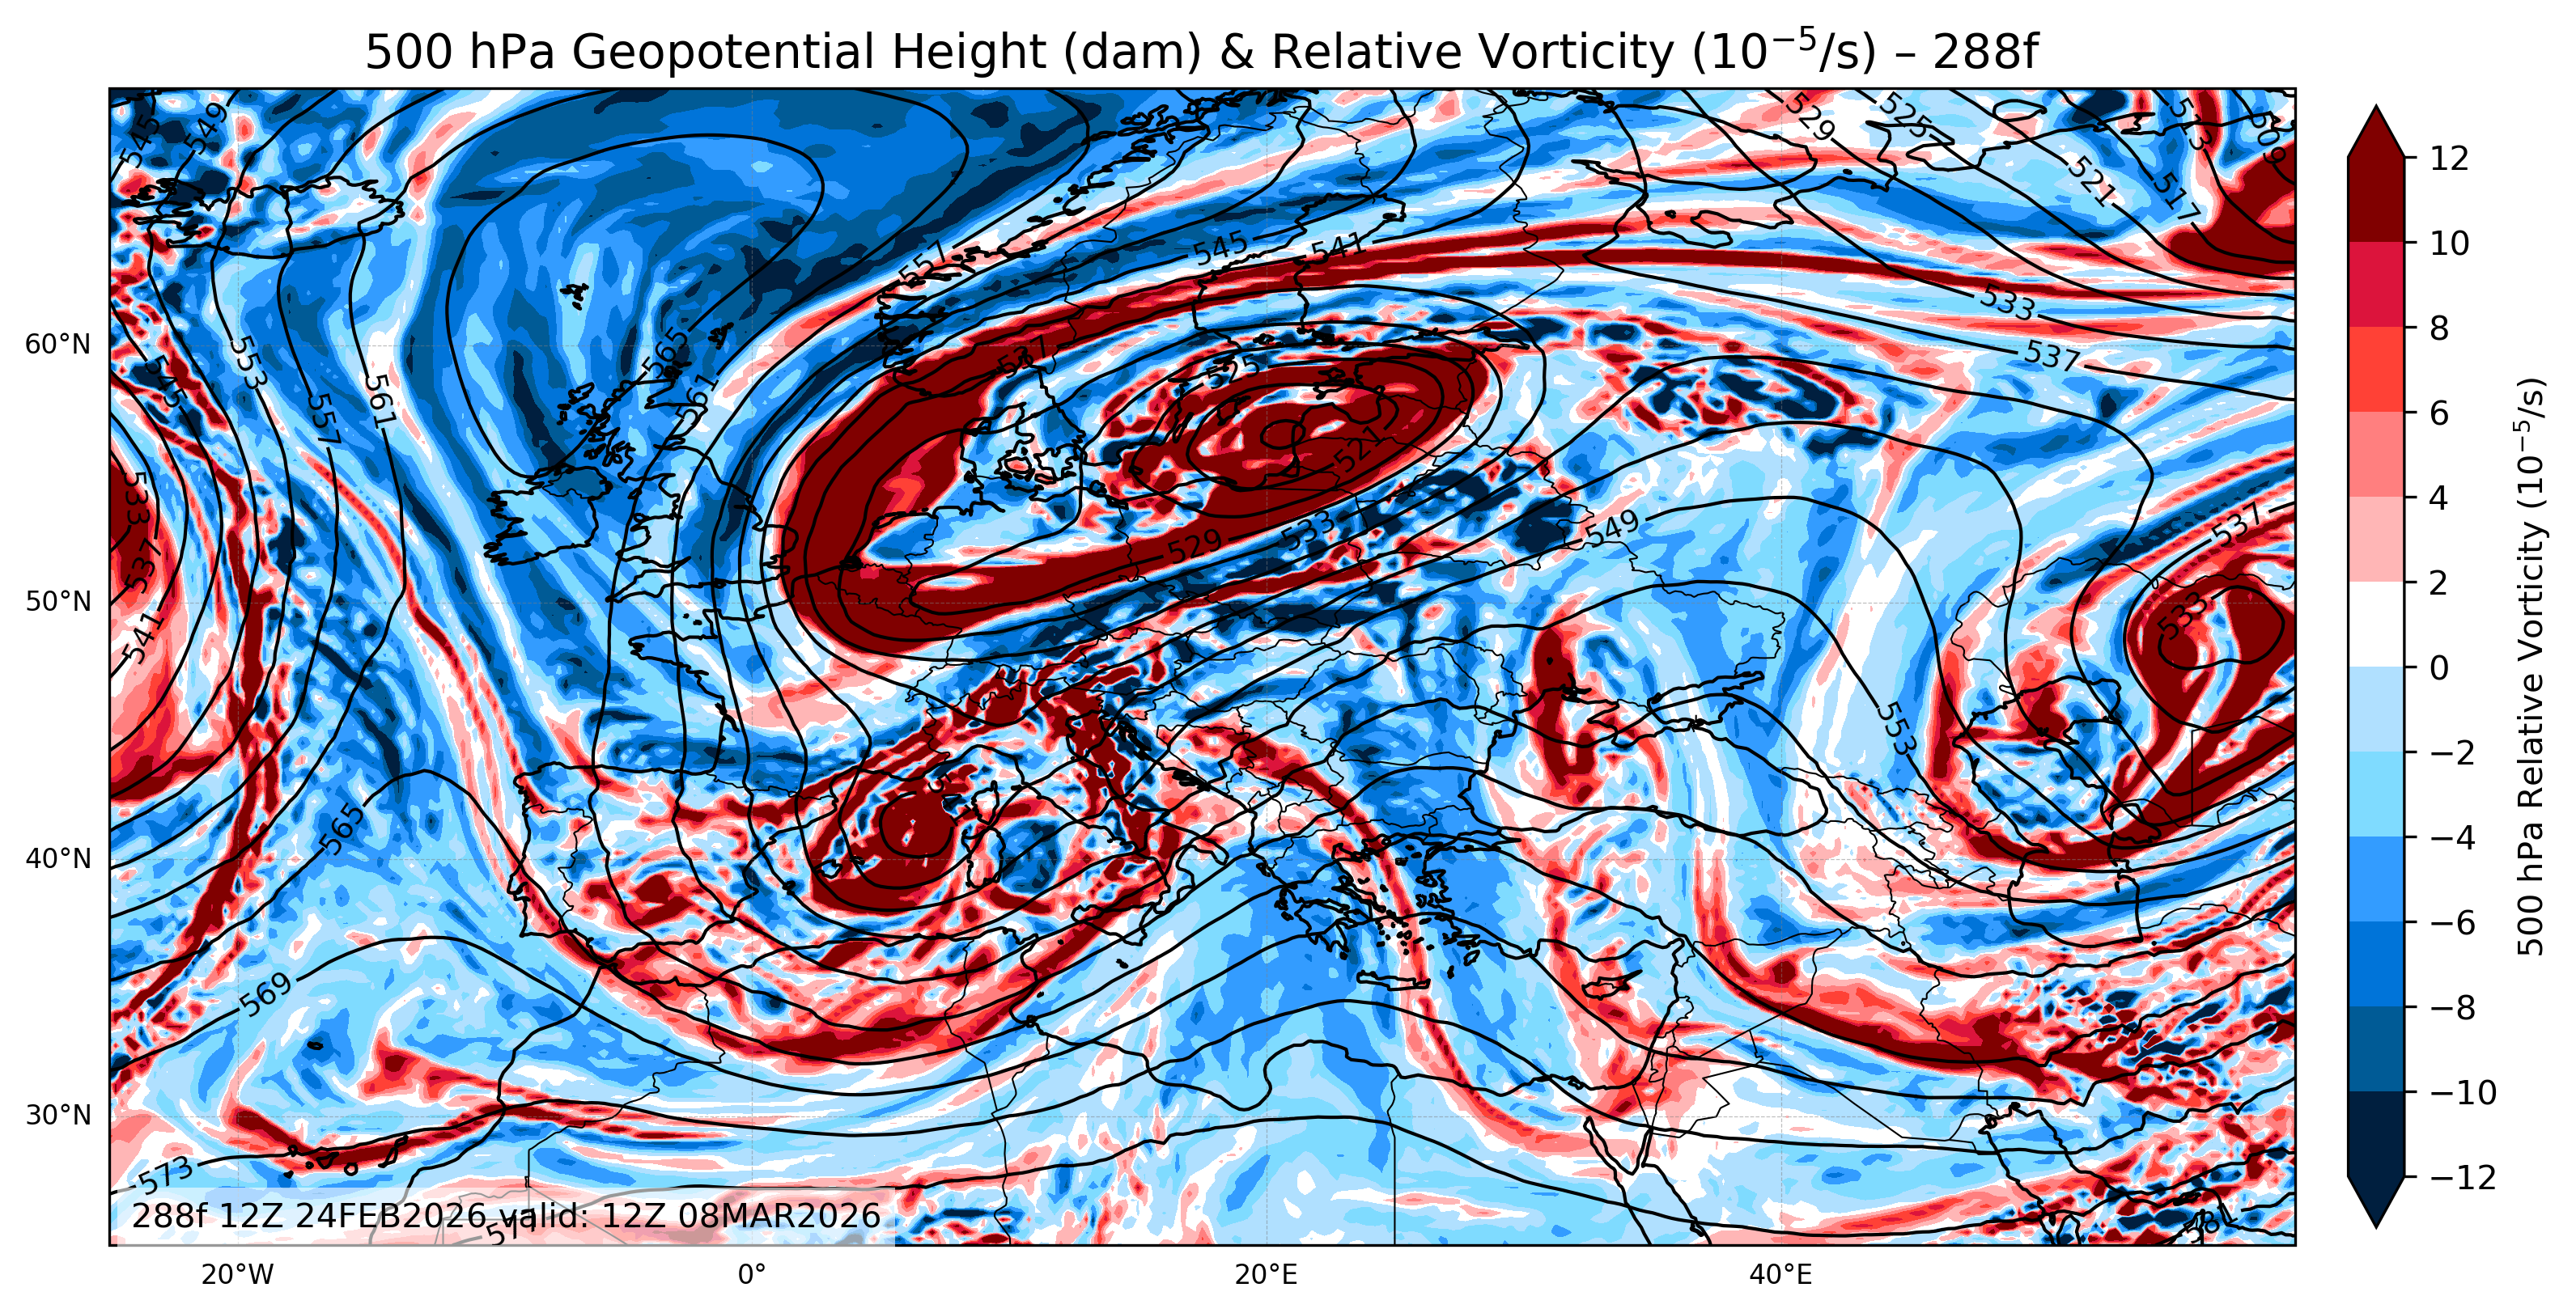
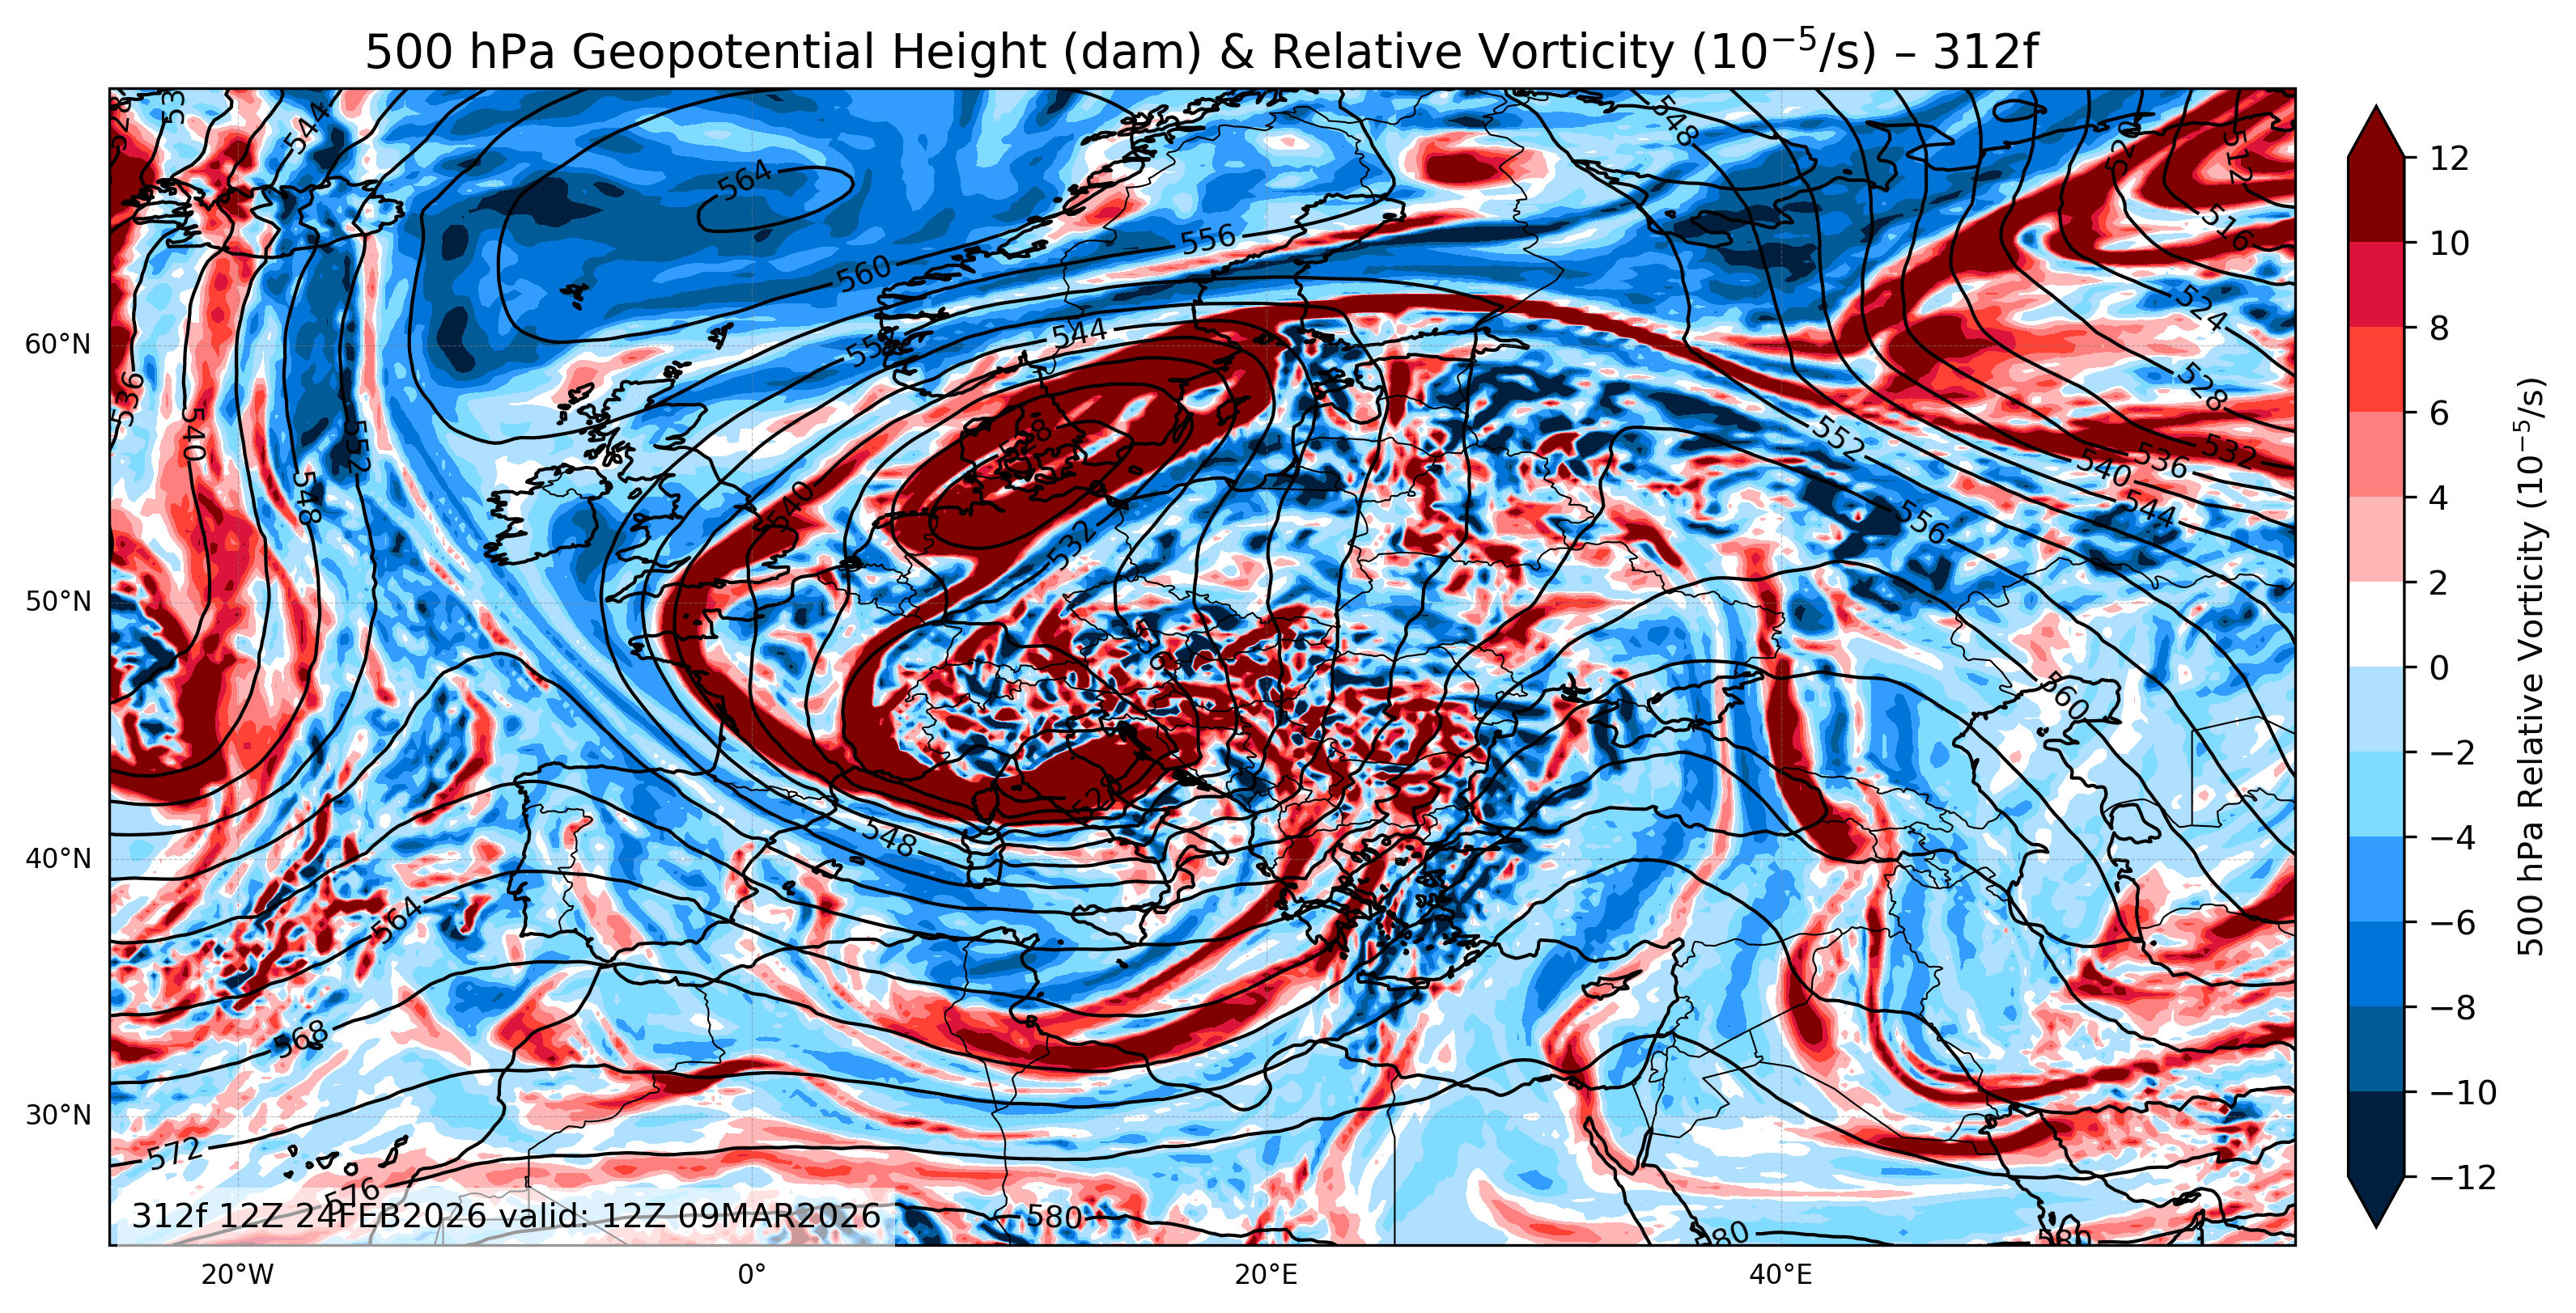
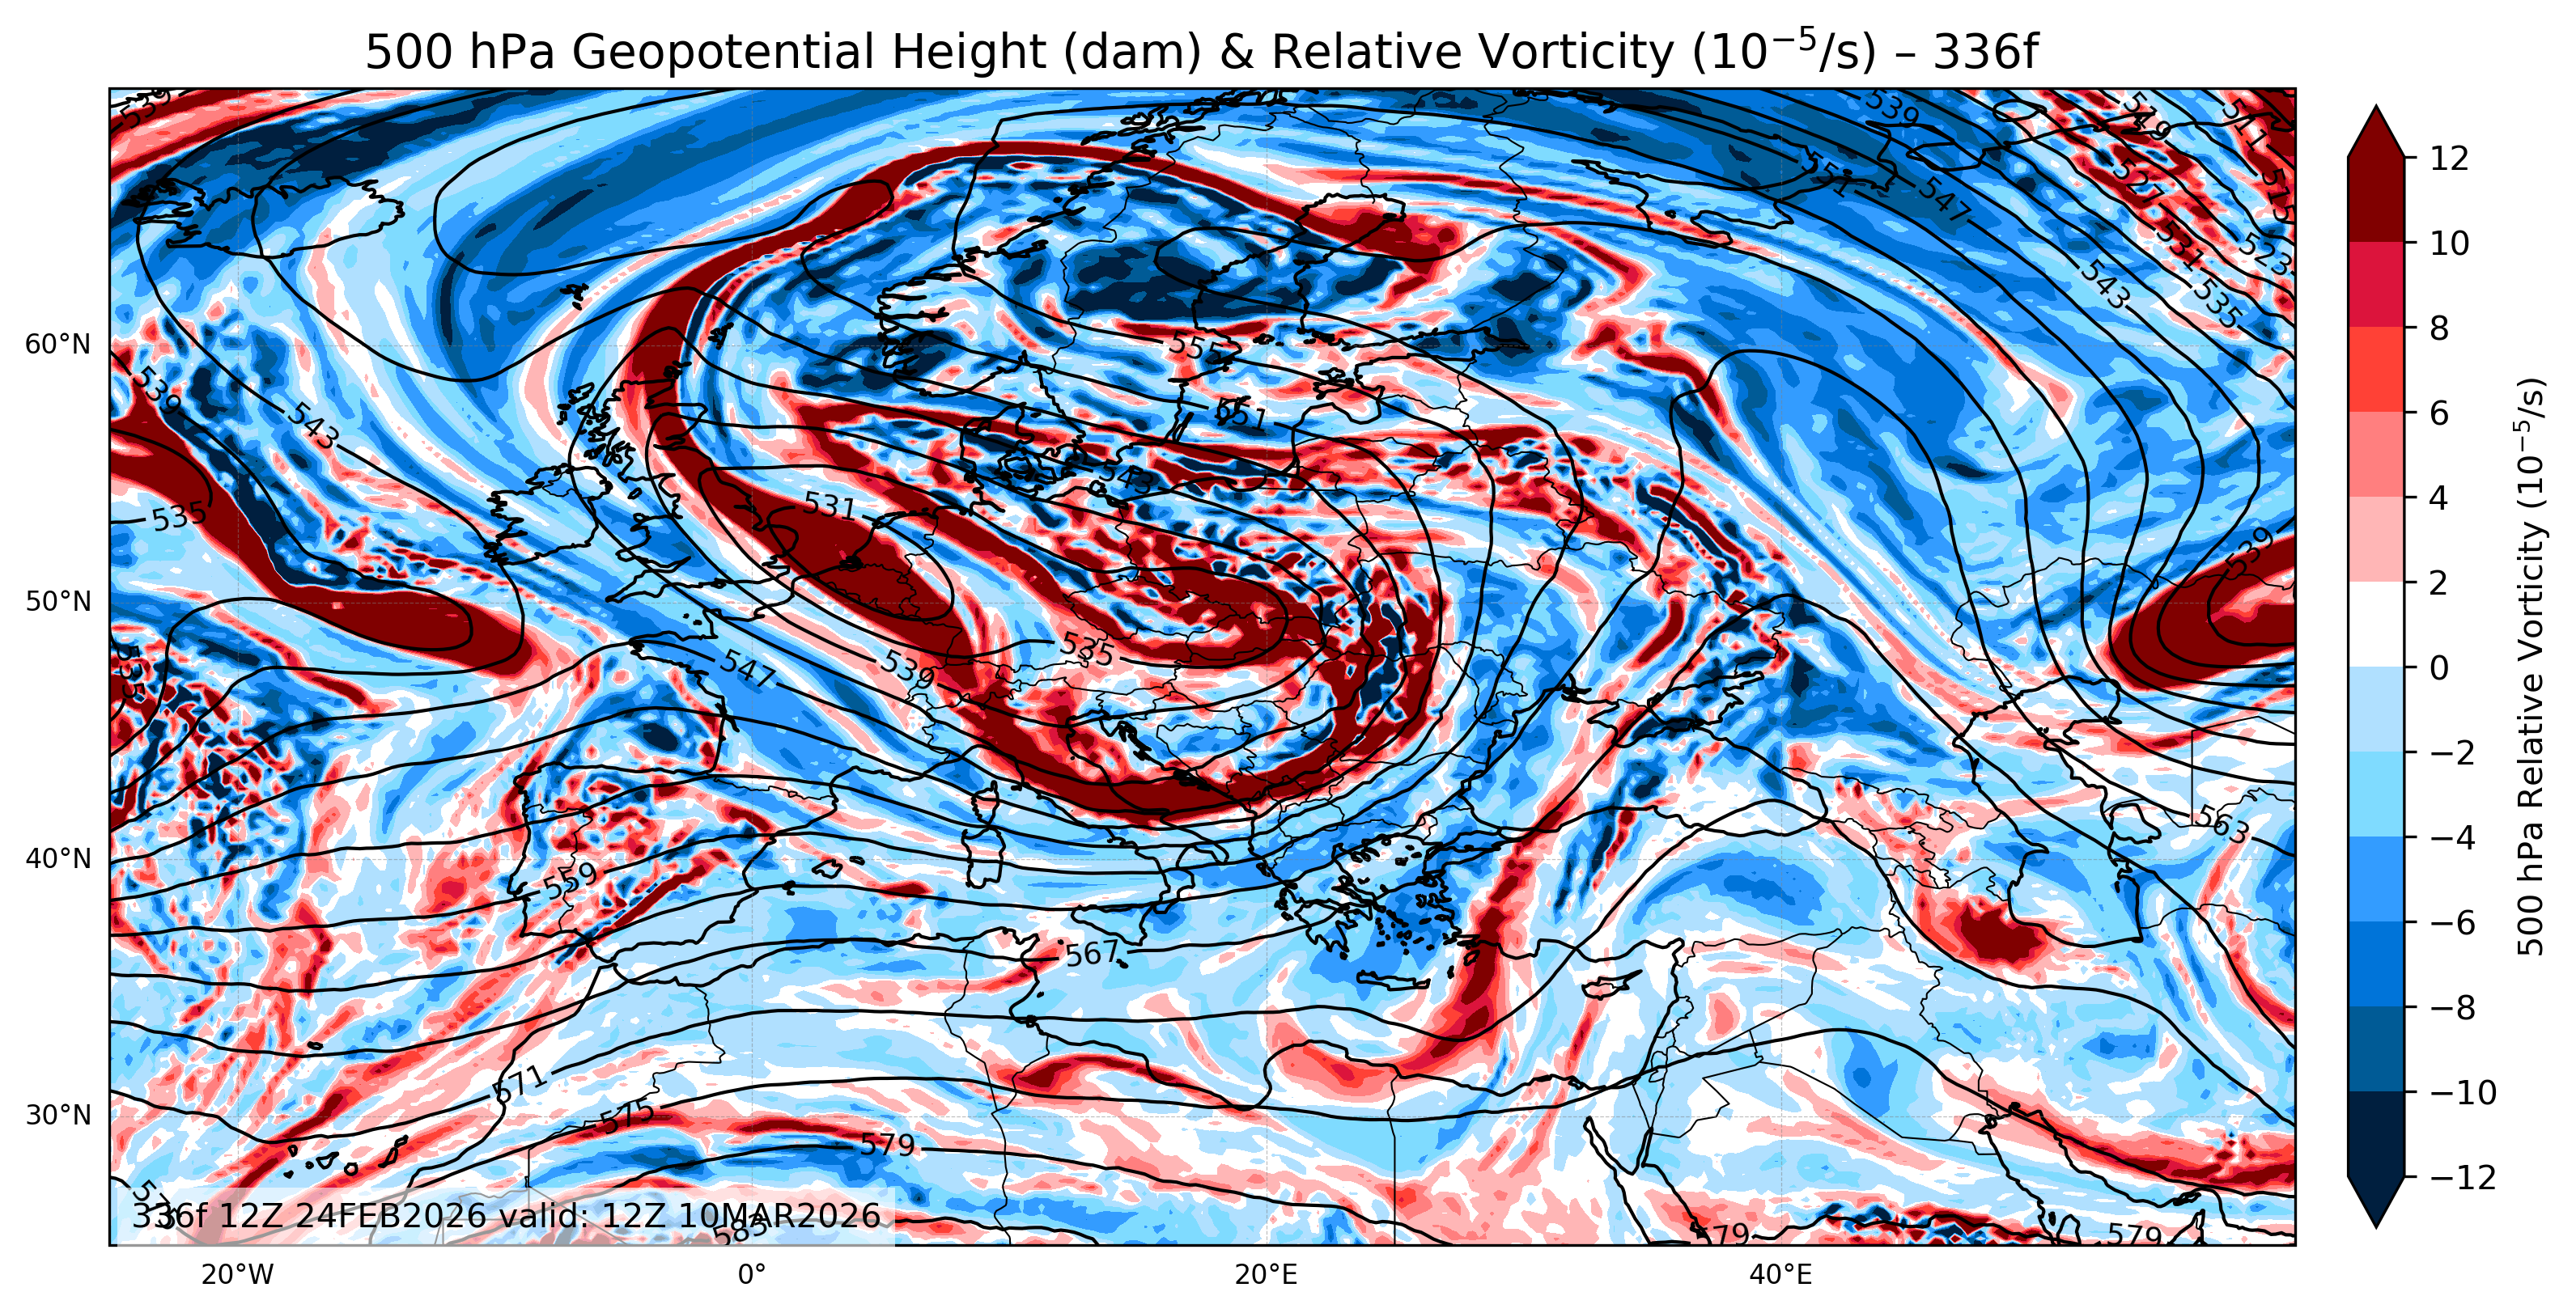
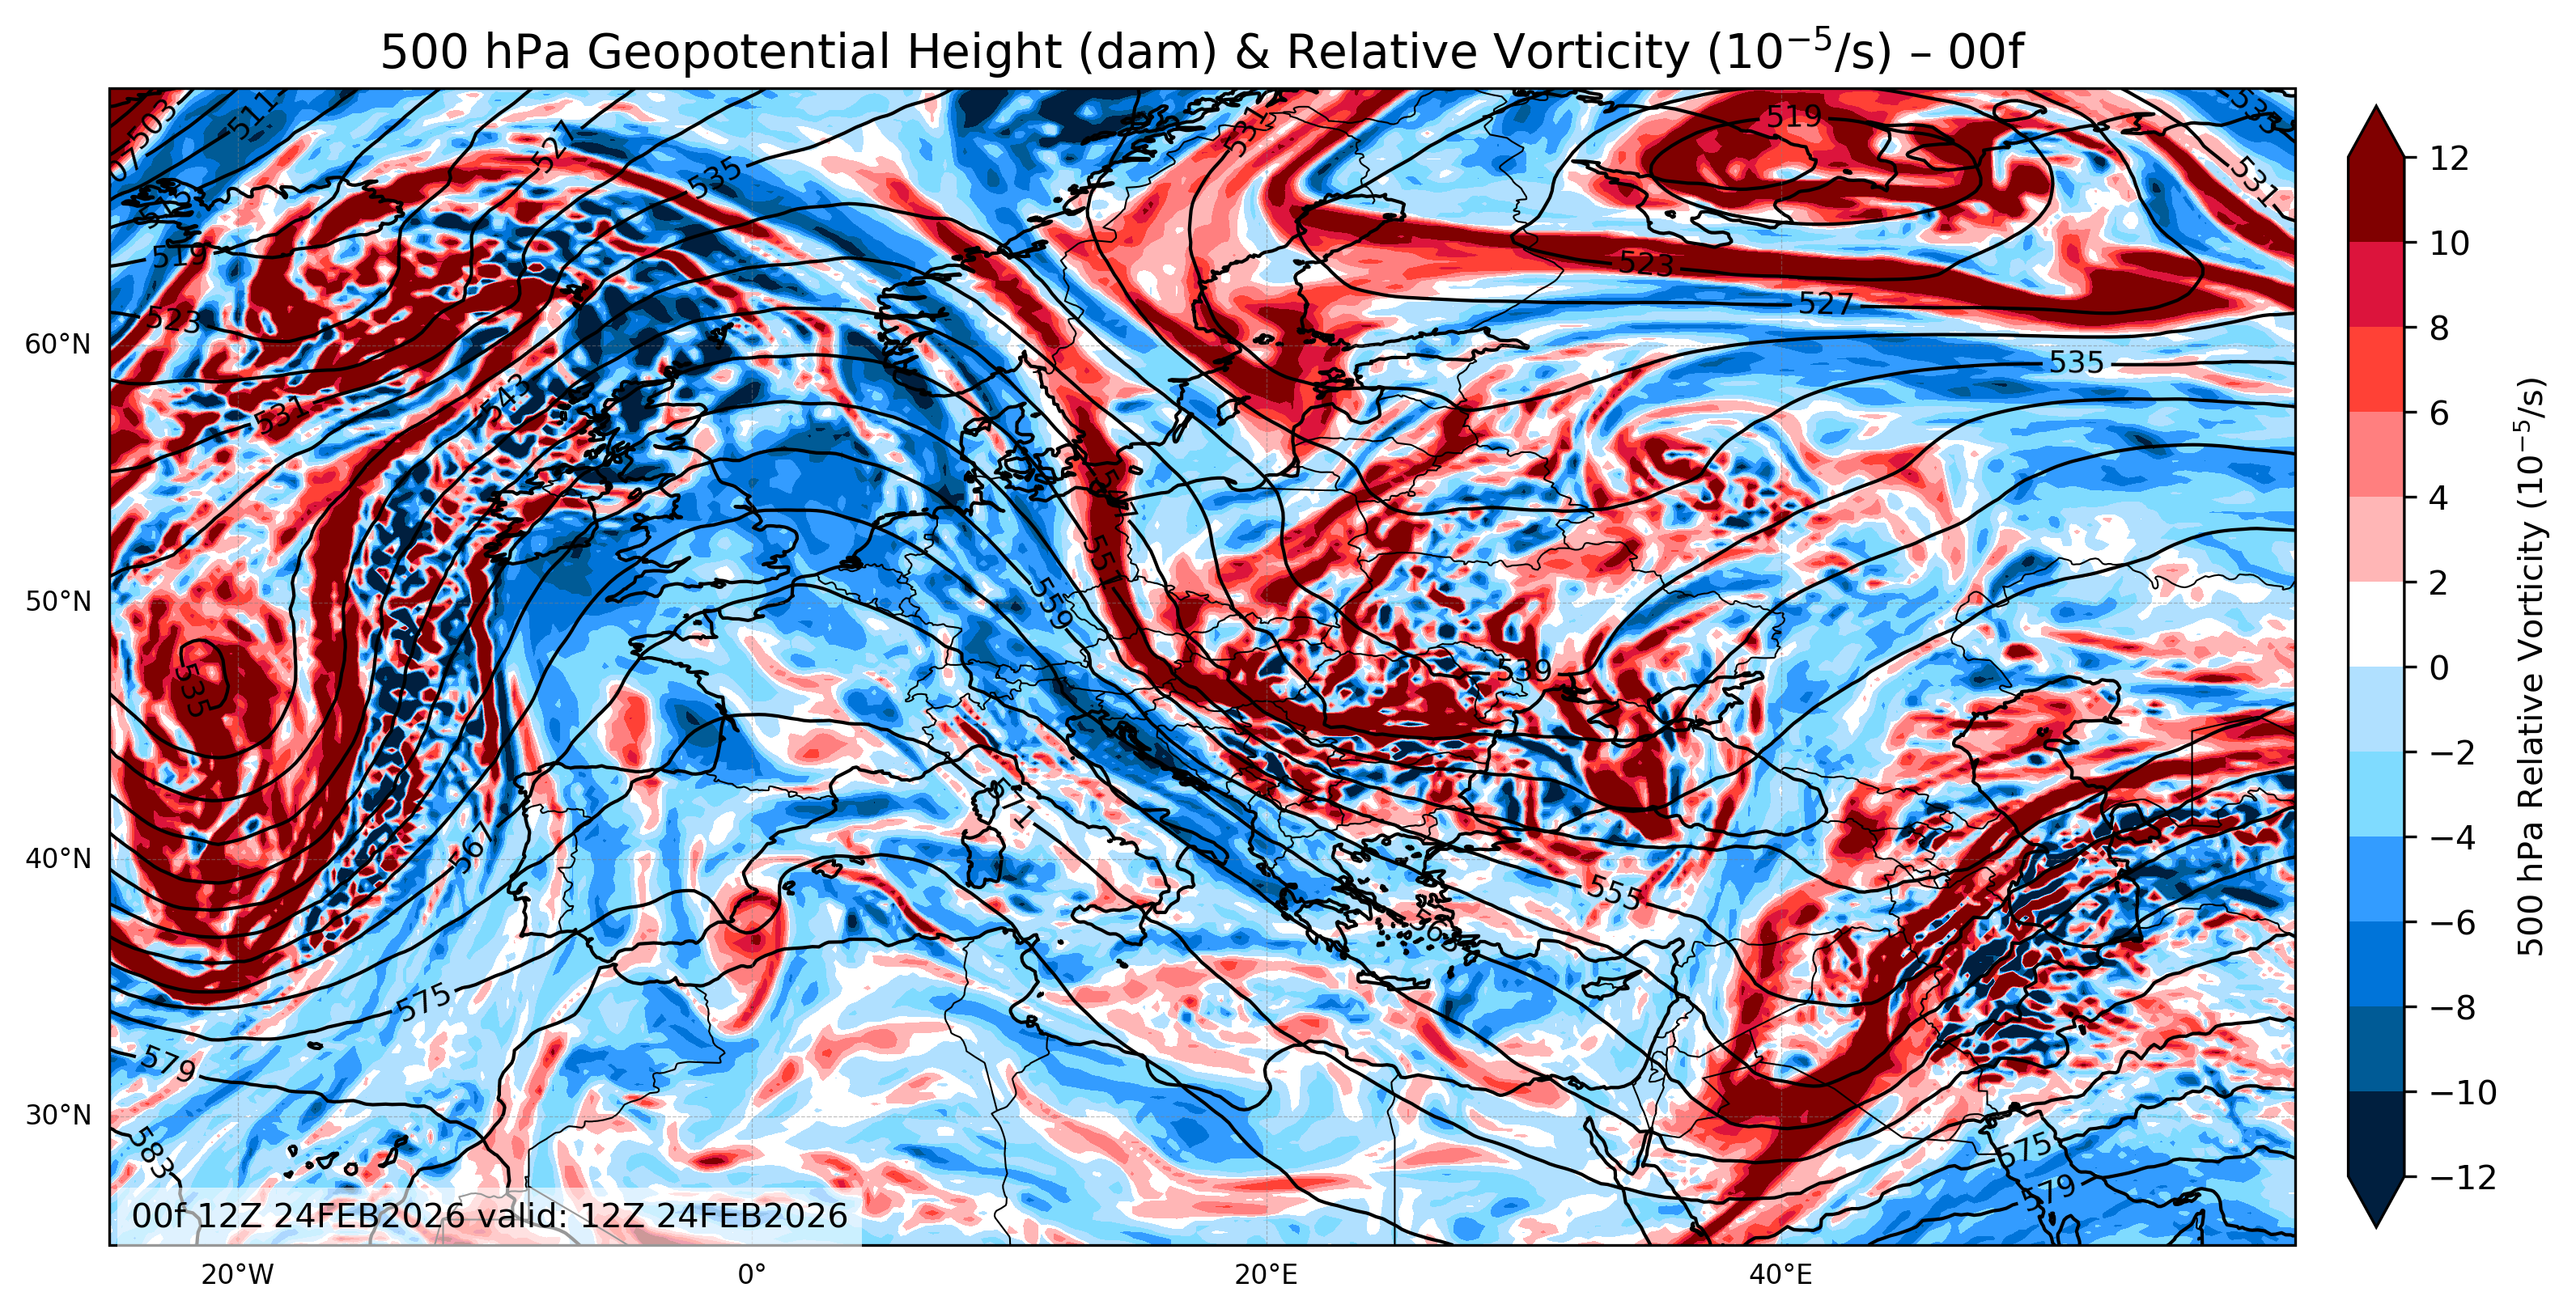
Wxmaps Europe: 500mb Geopotential Height & Vorticity
The 500mb Geopotential Height & Vorticity maps show large-scale weather patterns in the mid-troposphere. These maps are essential for identifying troughs, ridges, and cyclonic activity that influence storm development and movement across Europe. By comparing 24h, 48h, and 72h forecasts, users can track the progression of low-pressure systems and evaluate potential areas of instability.
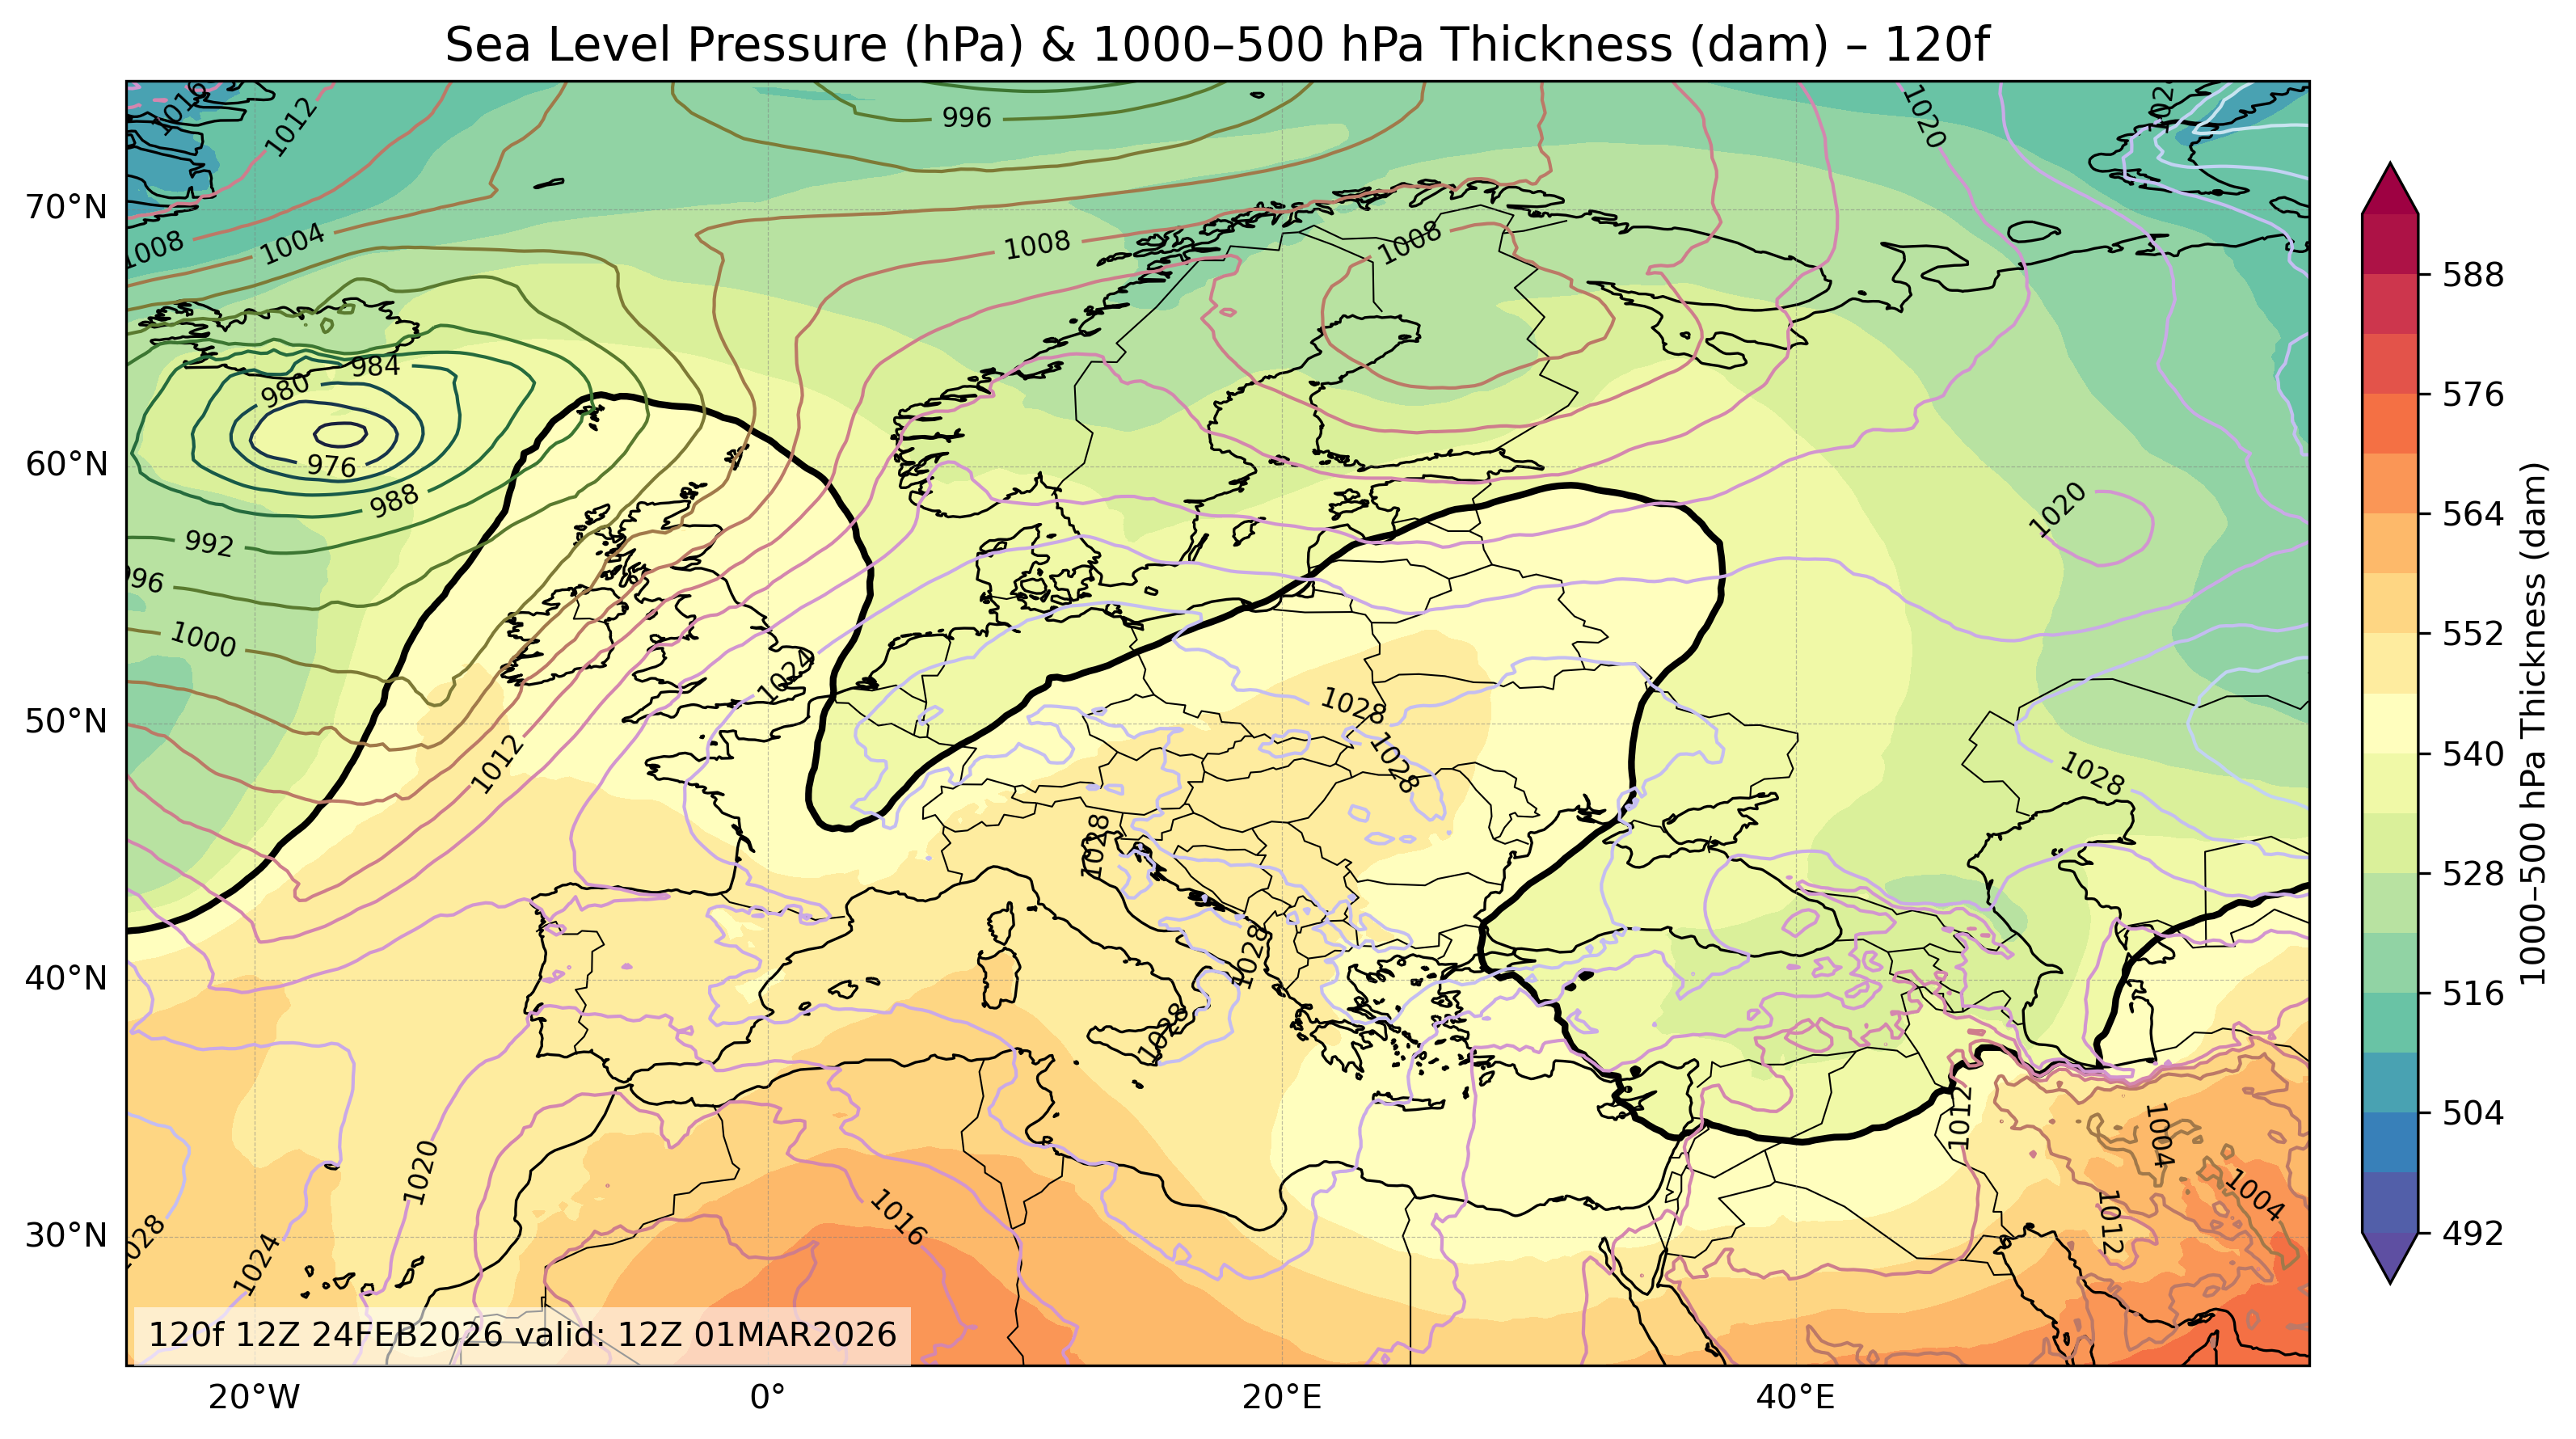
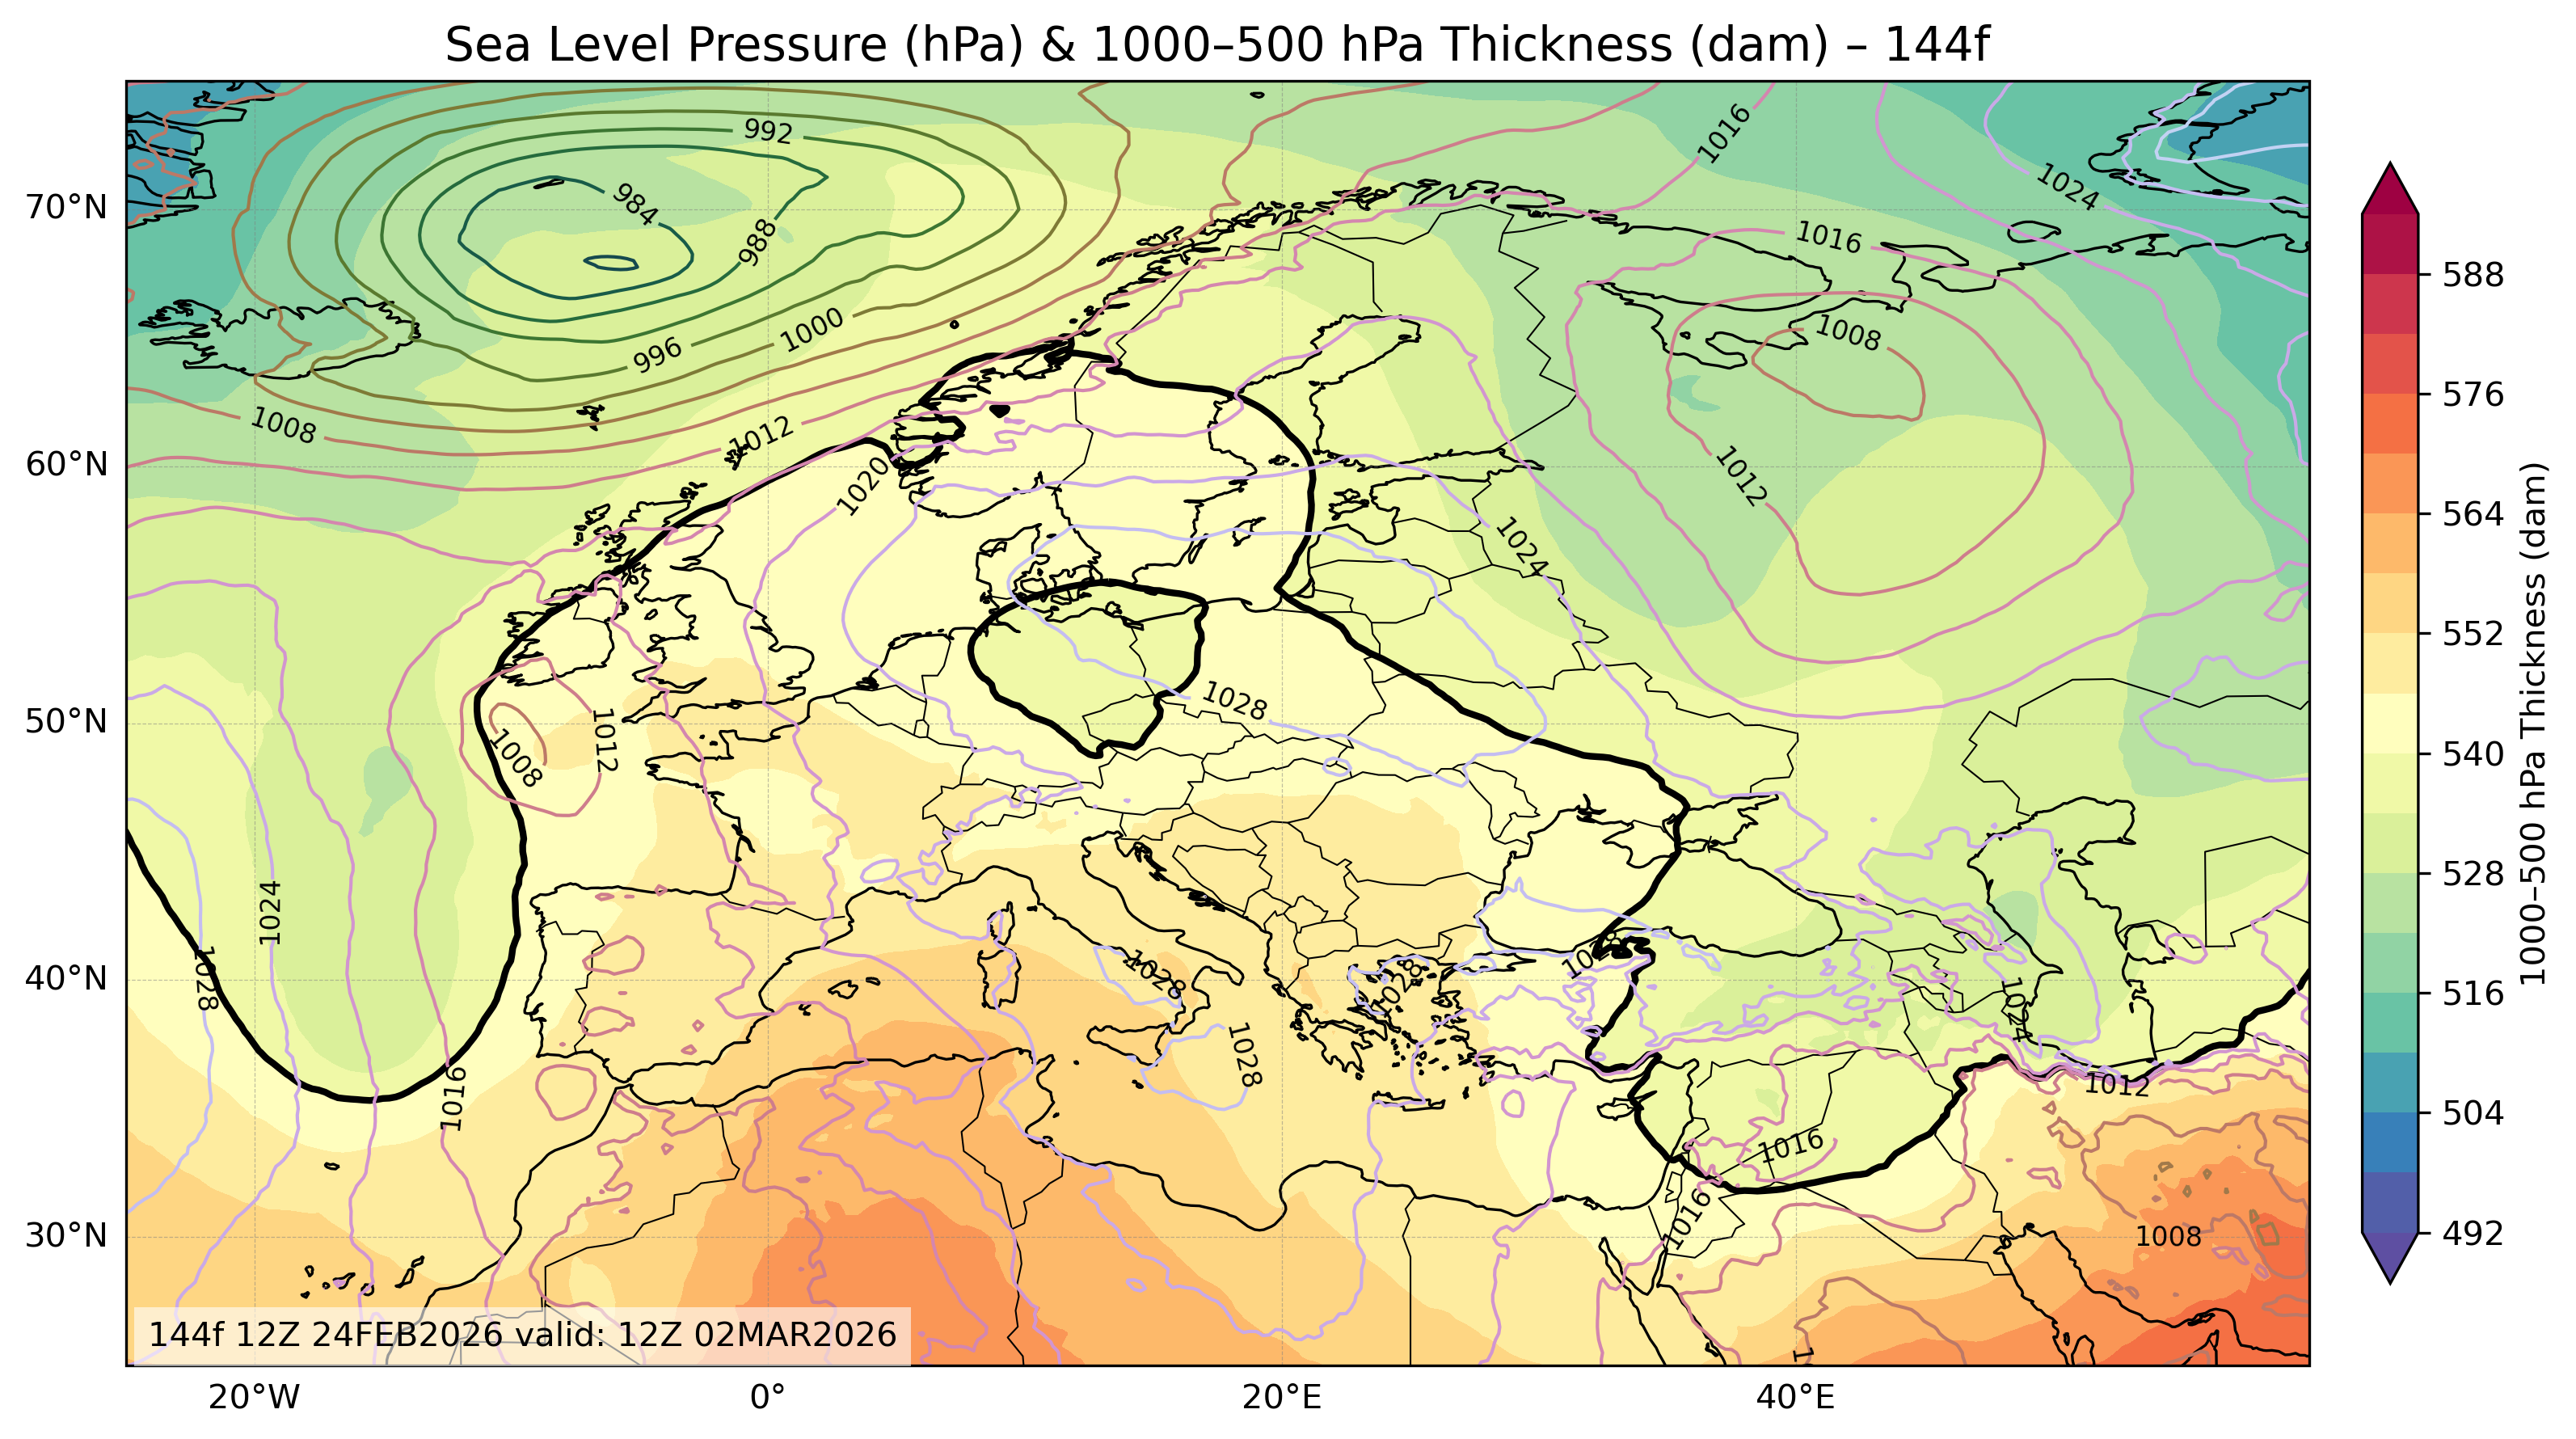
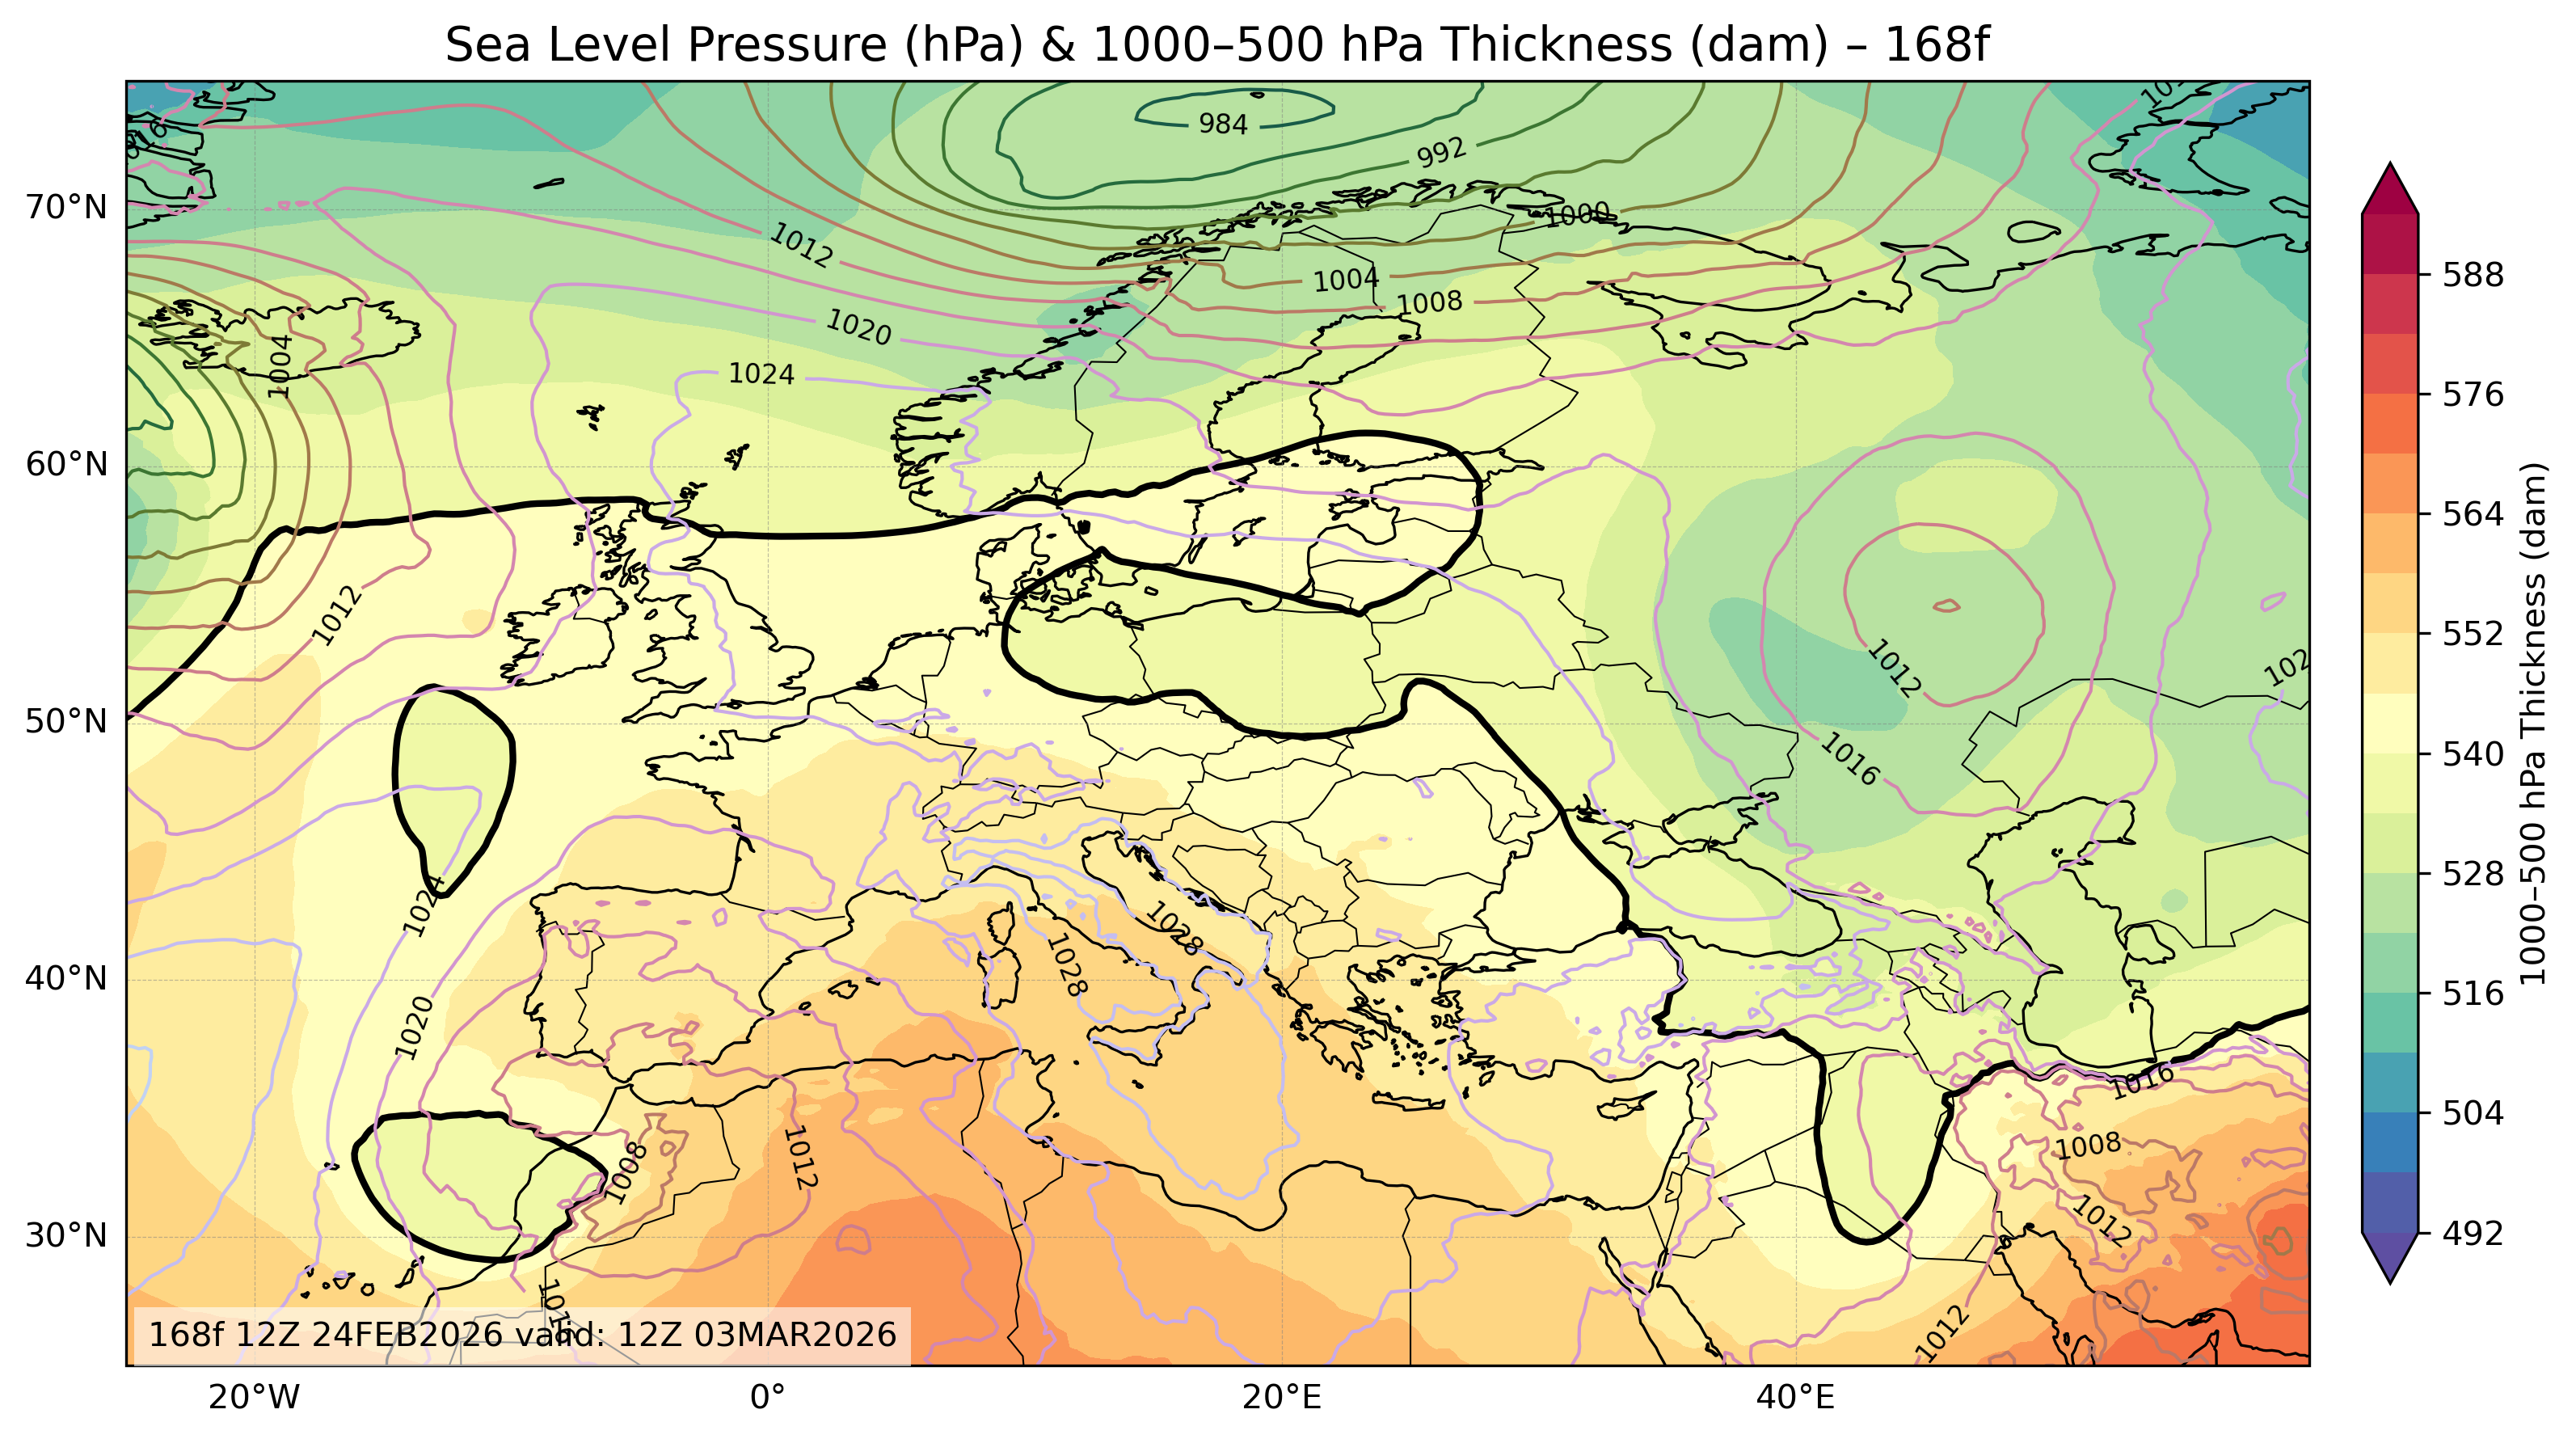
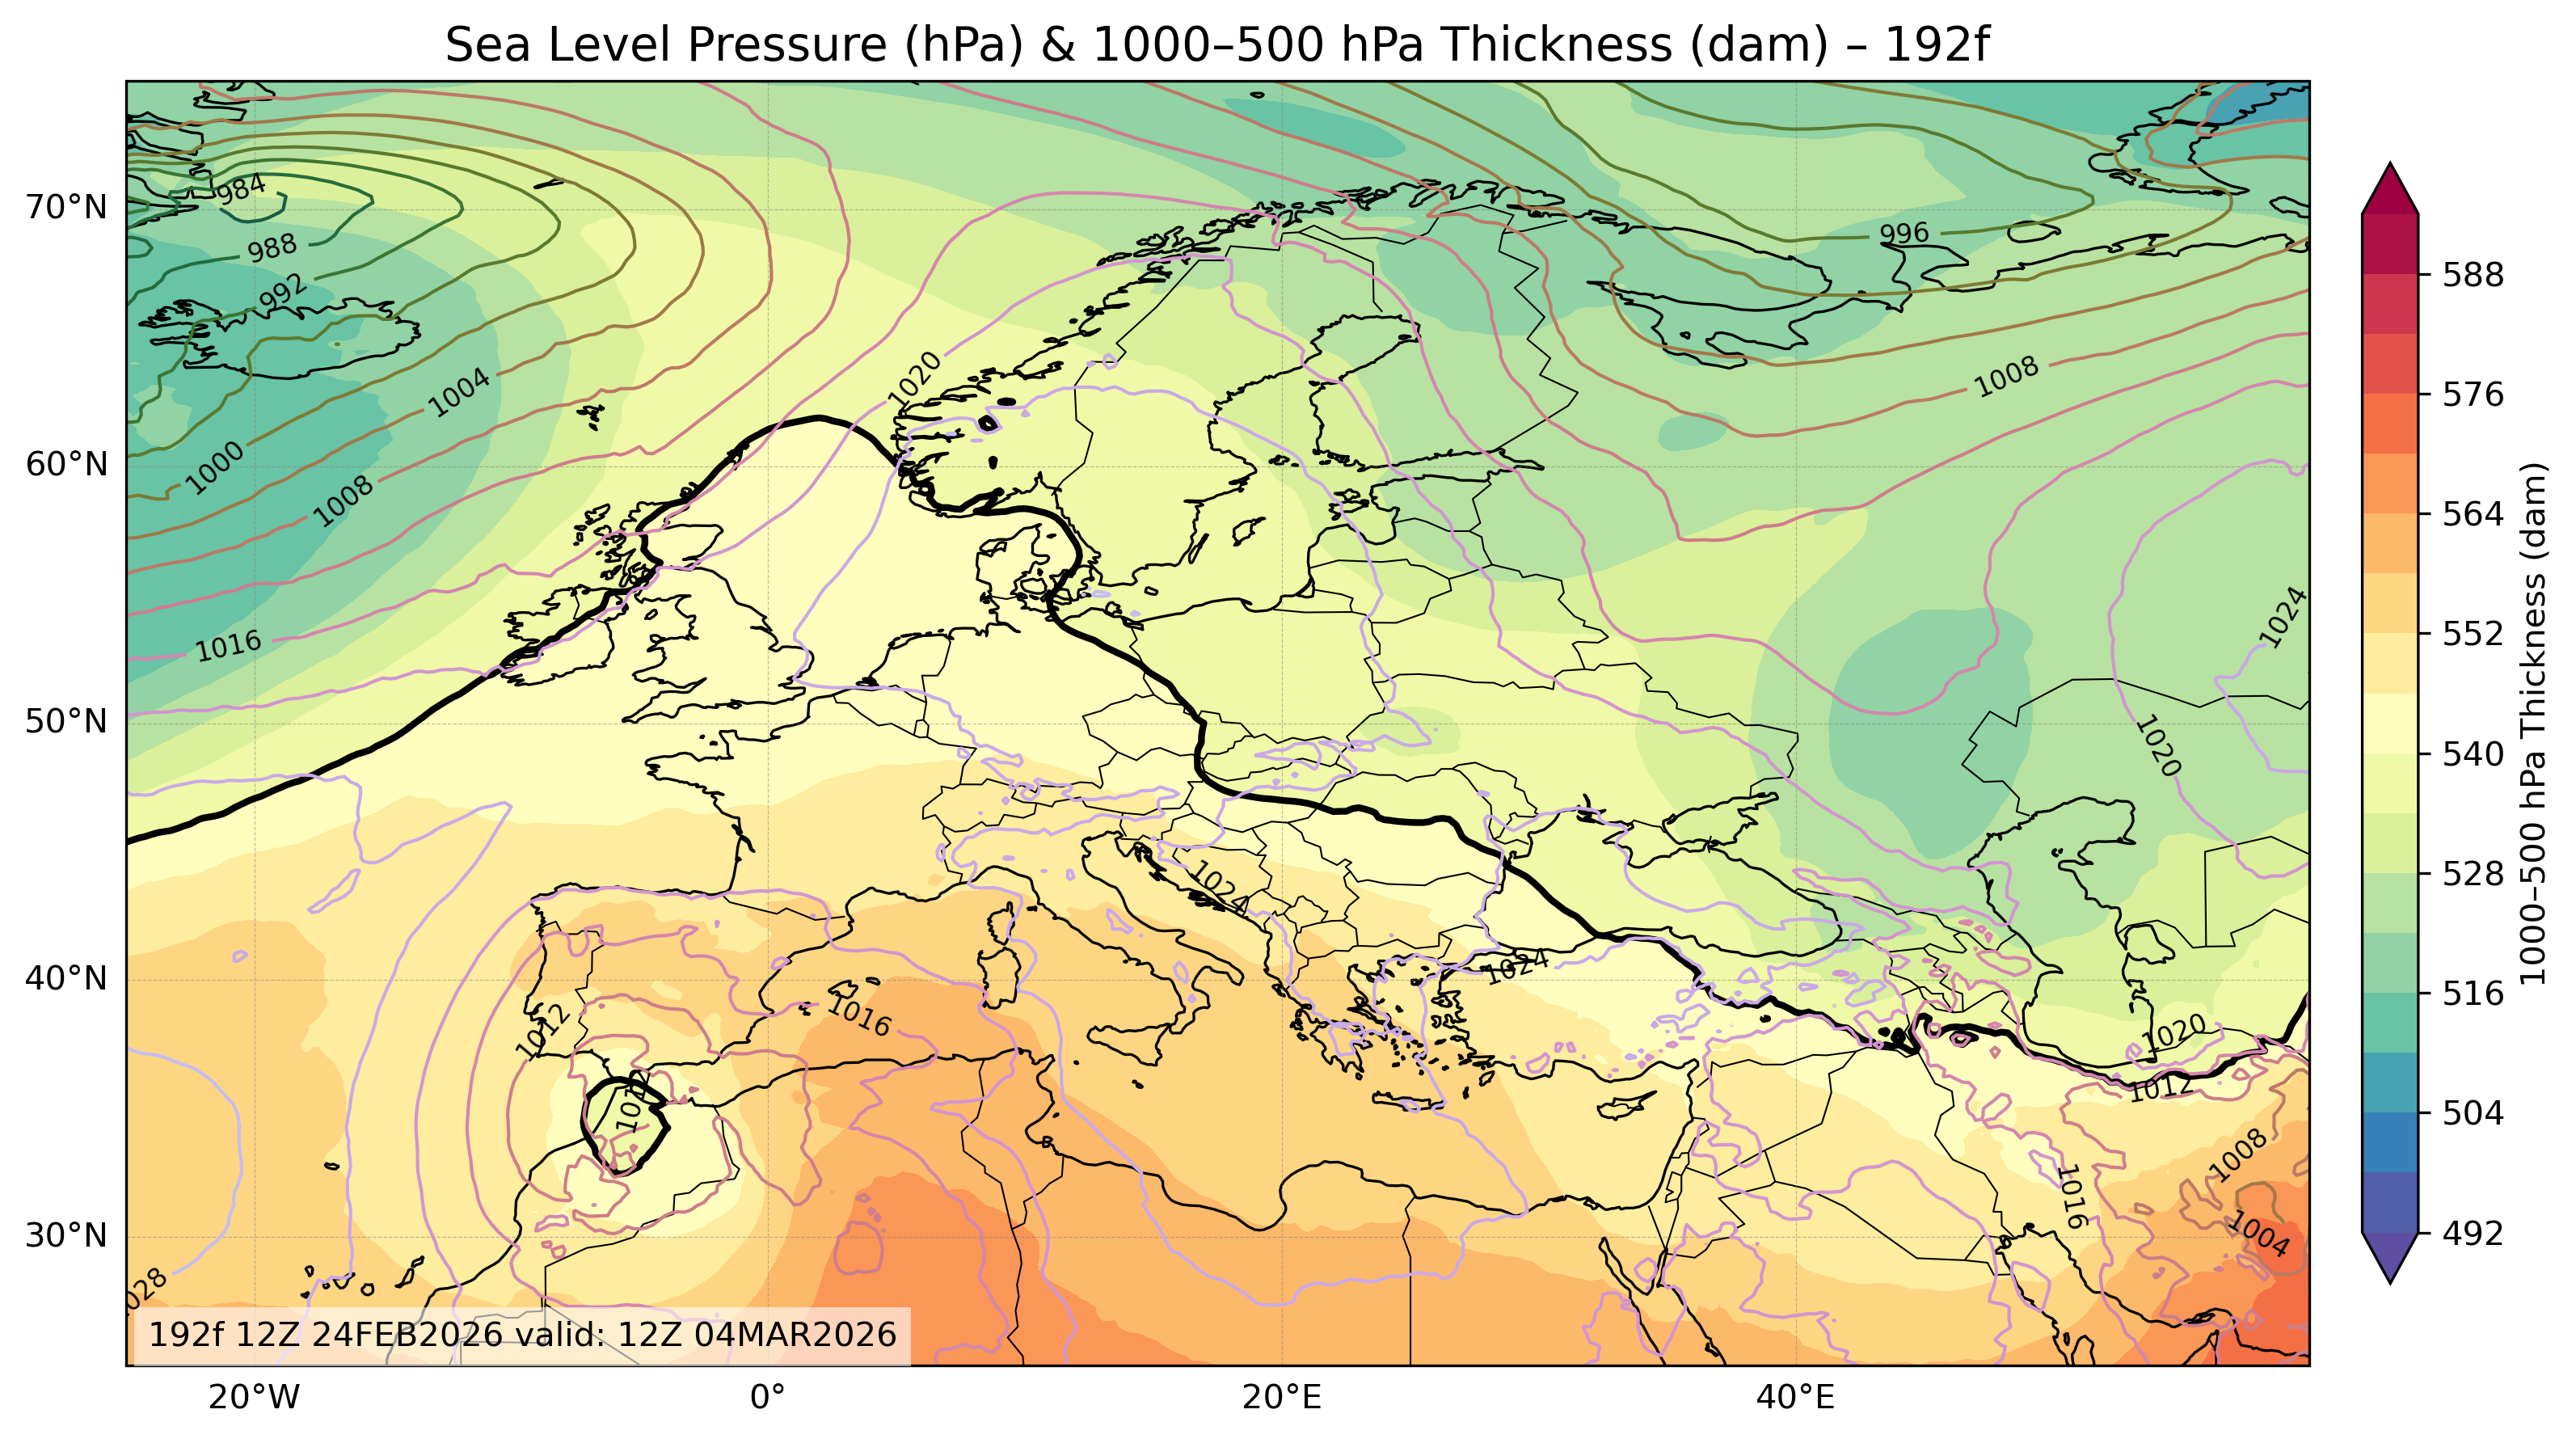
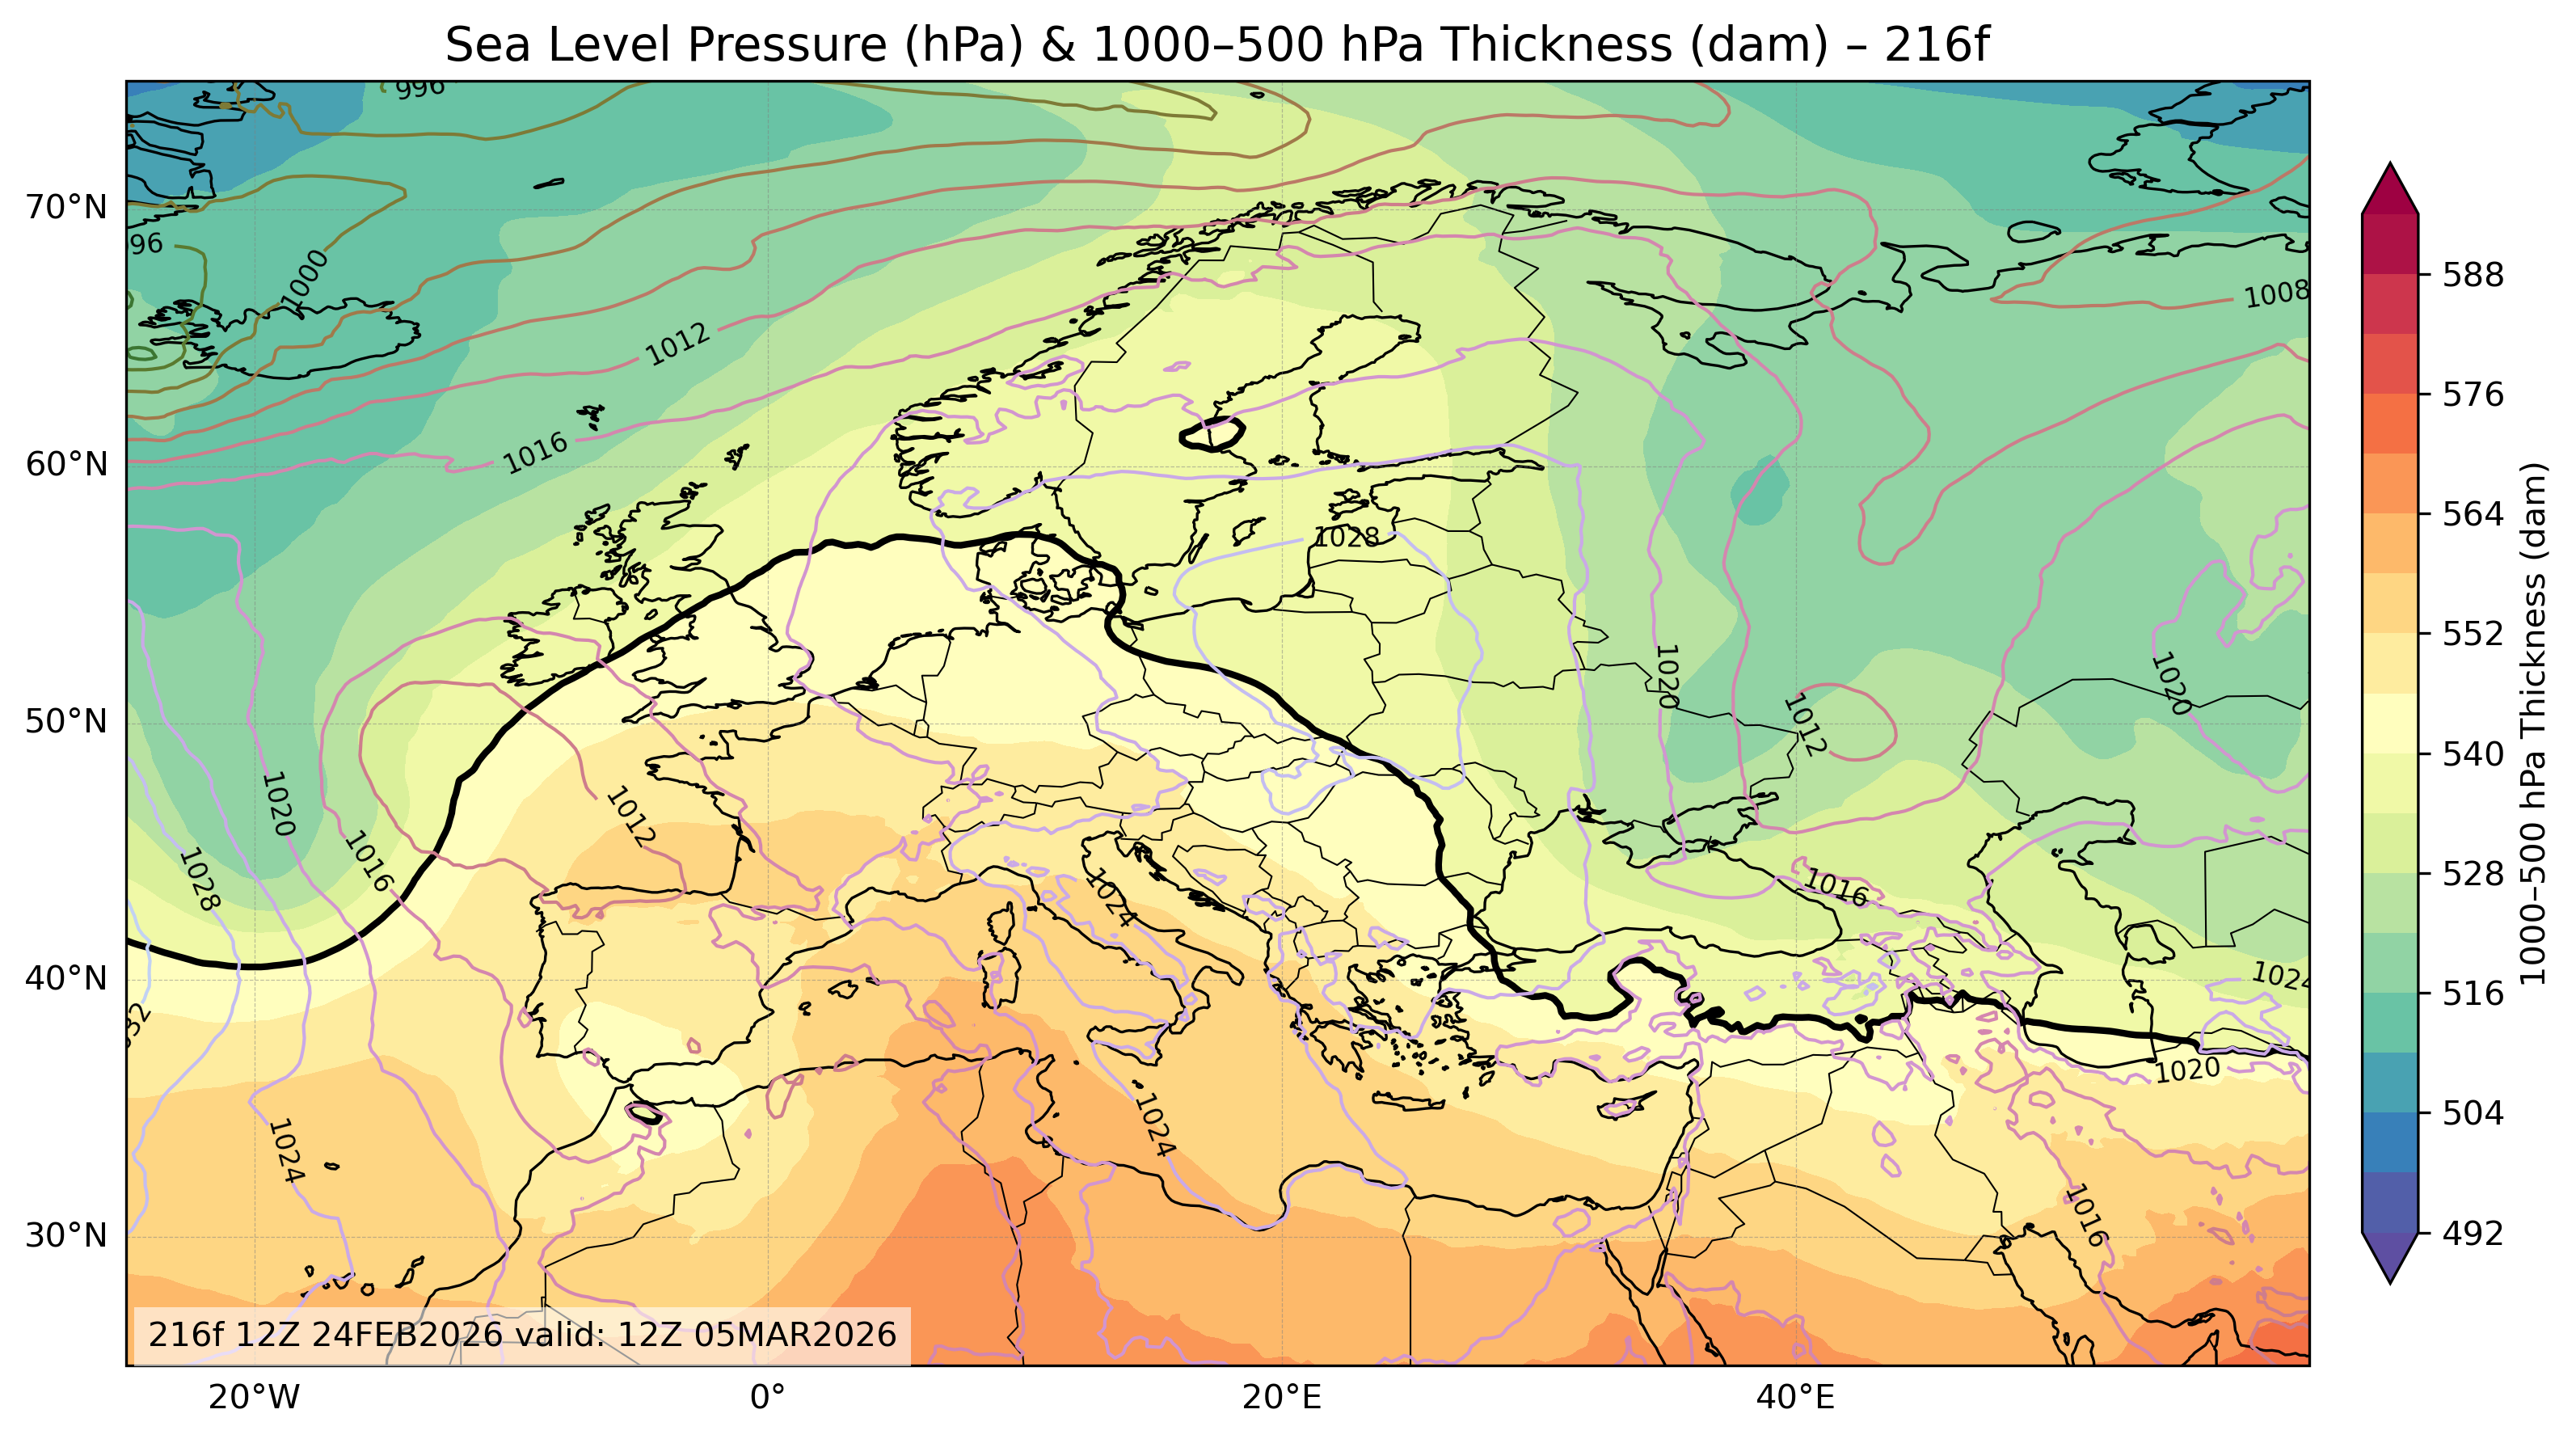
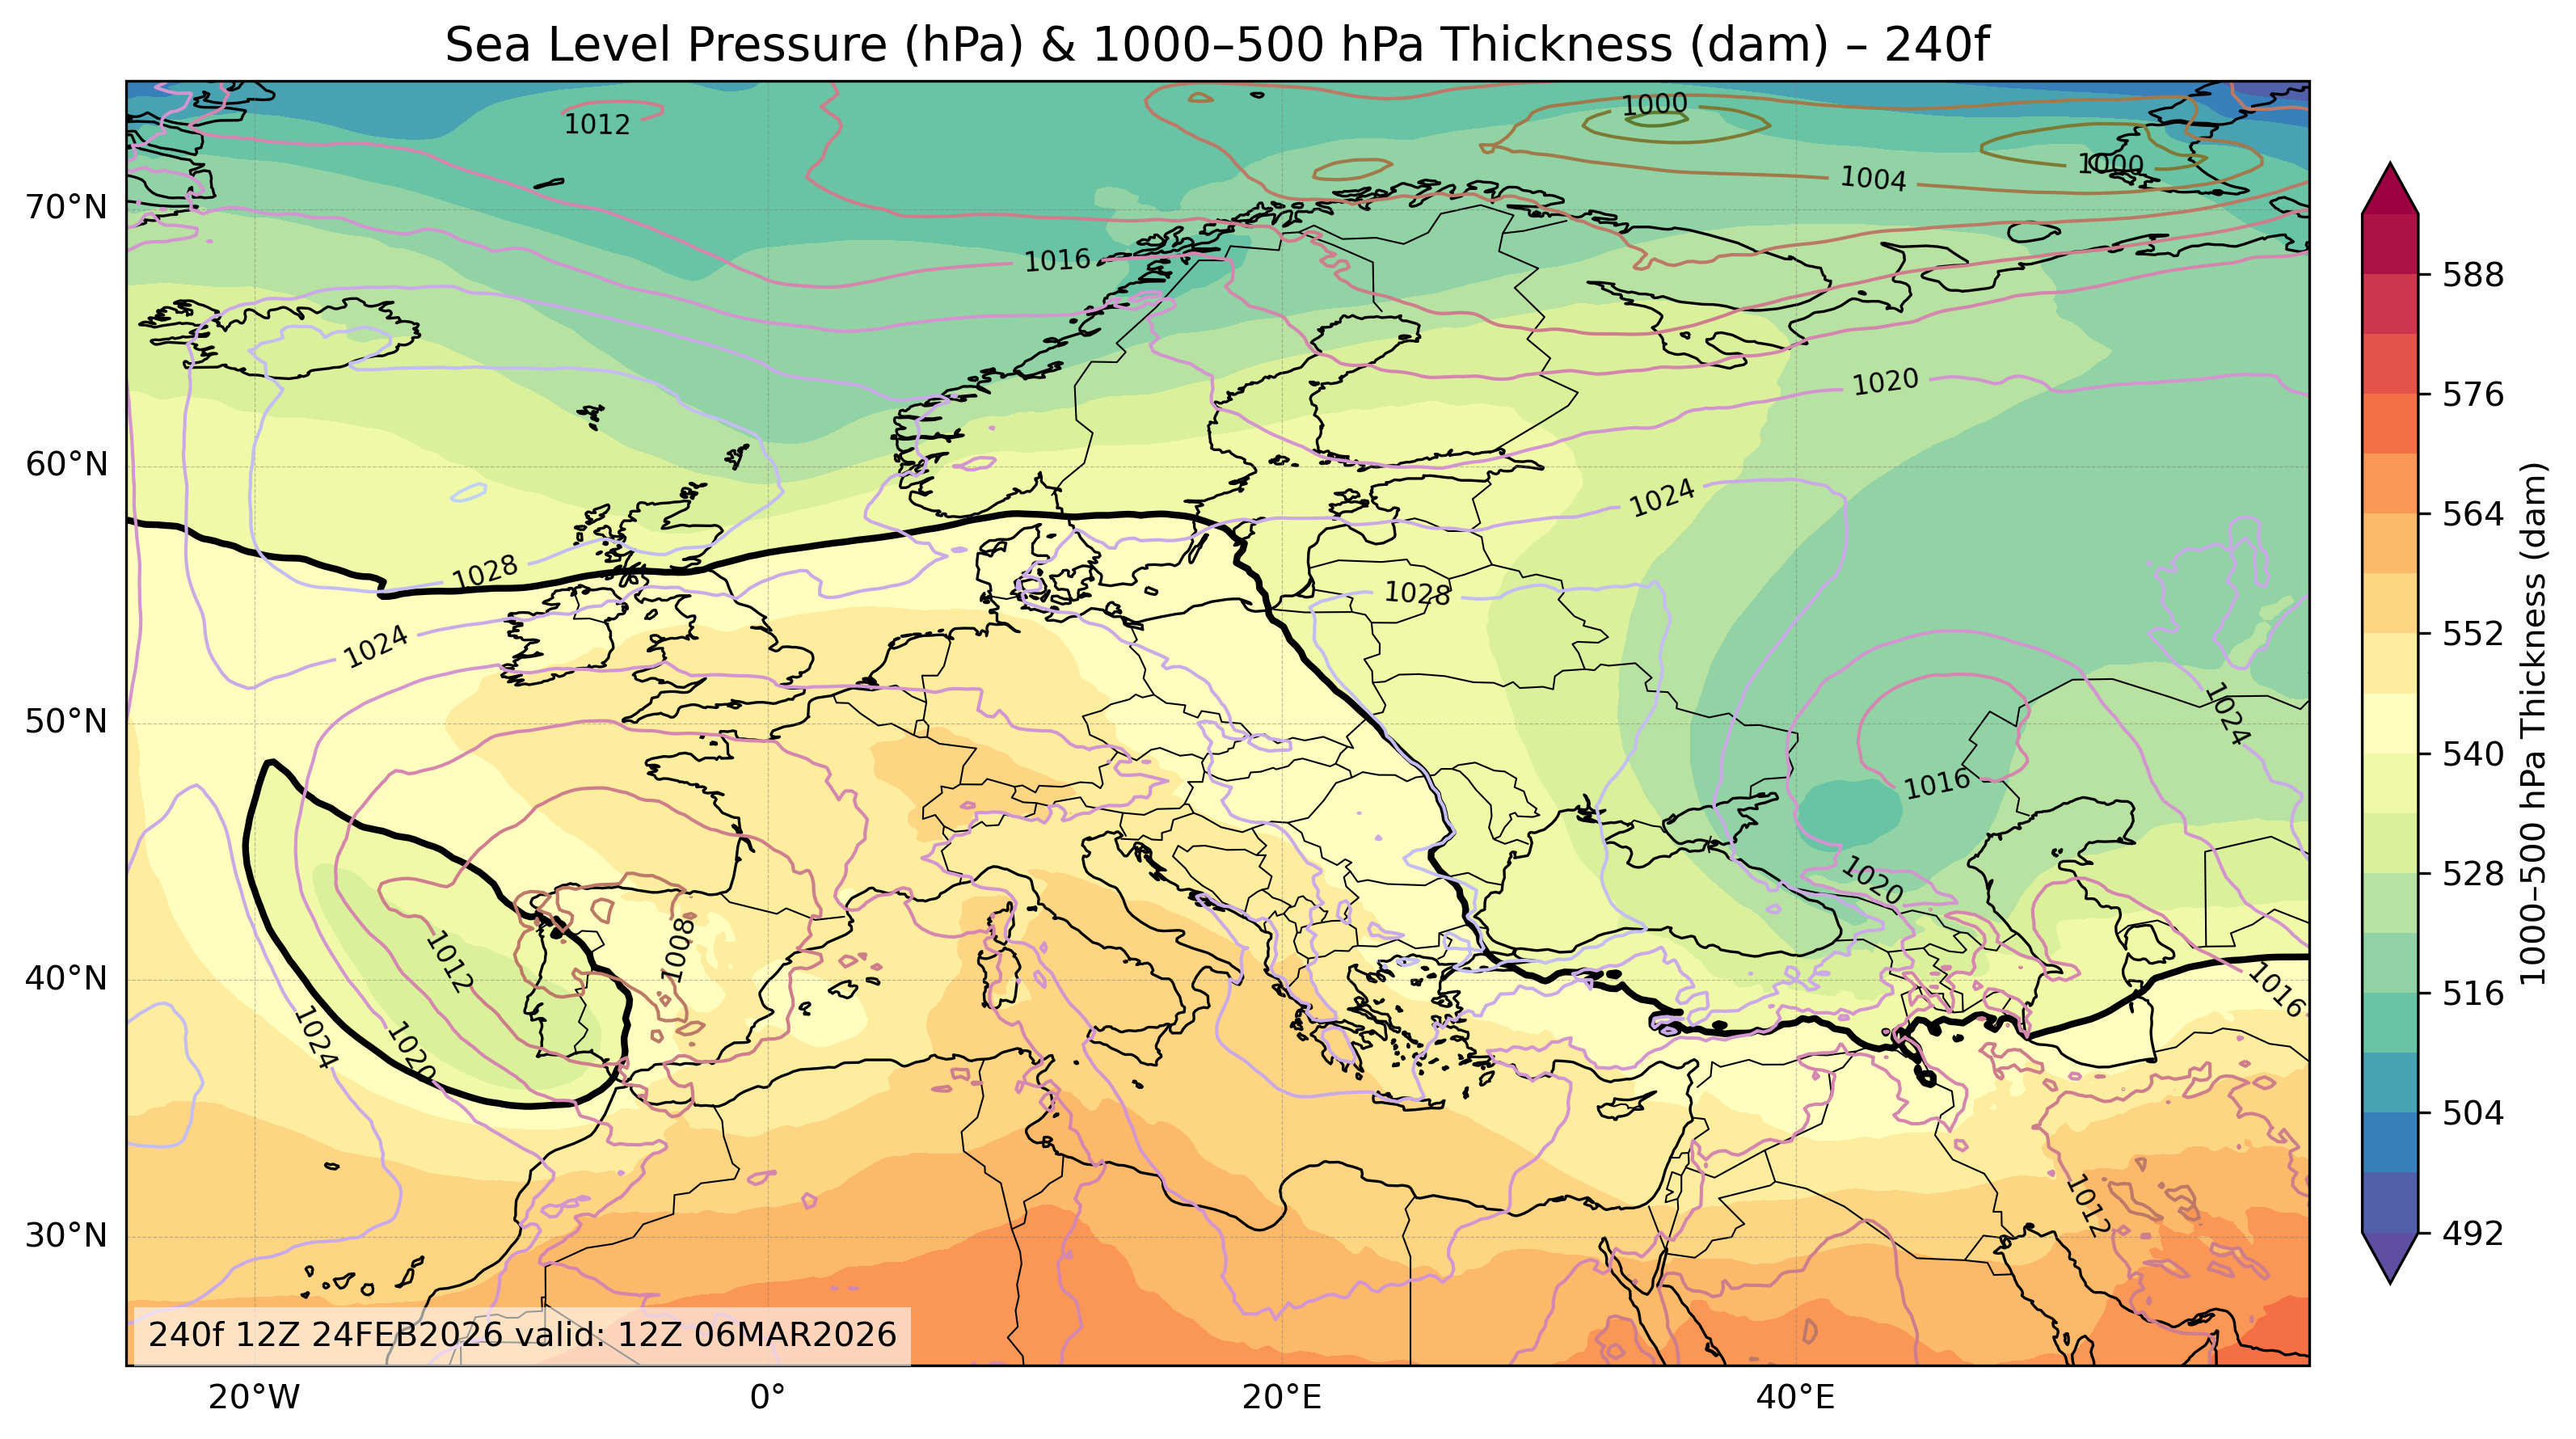
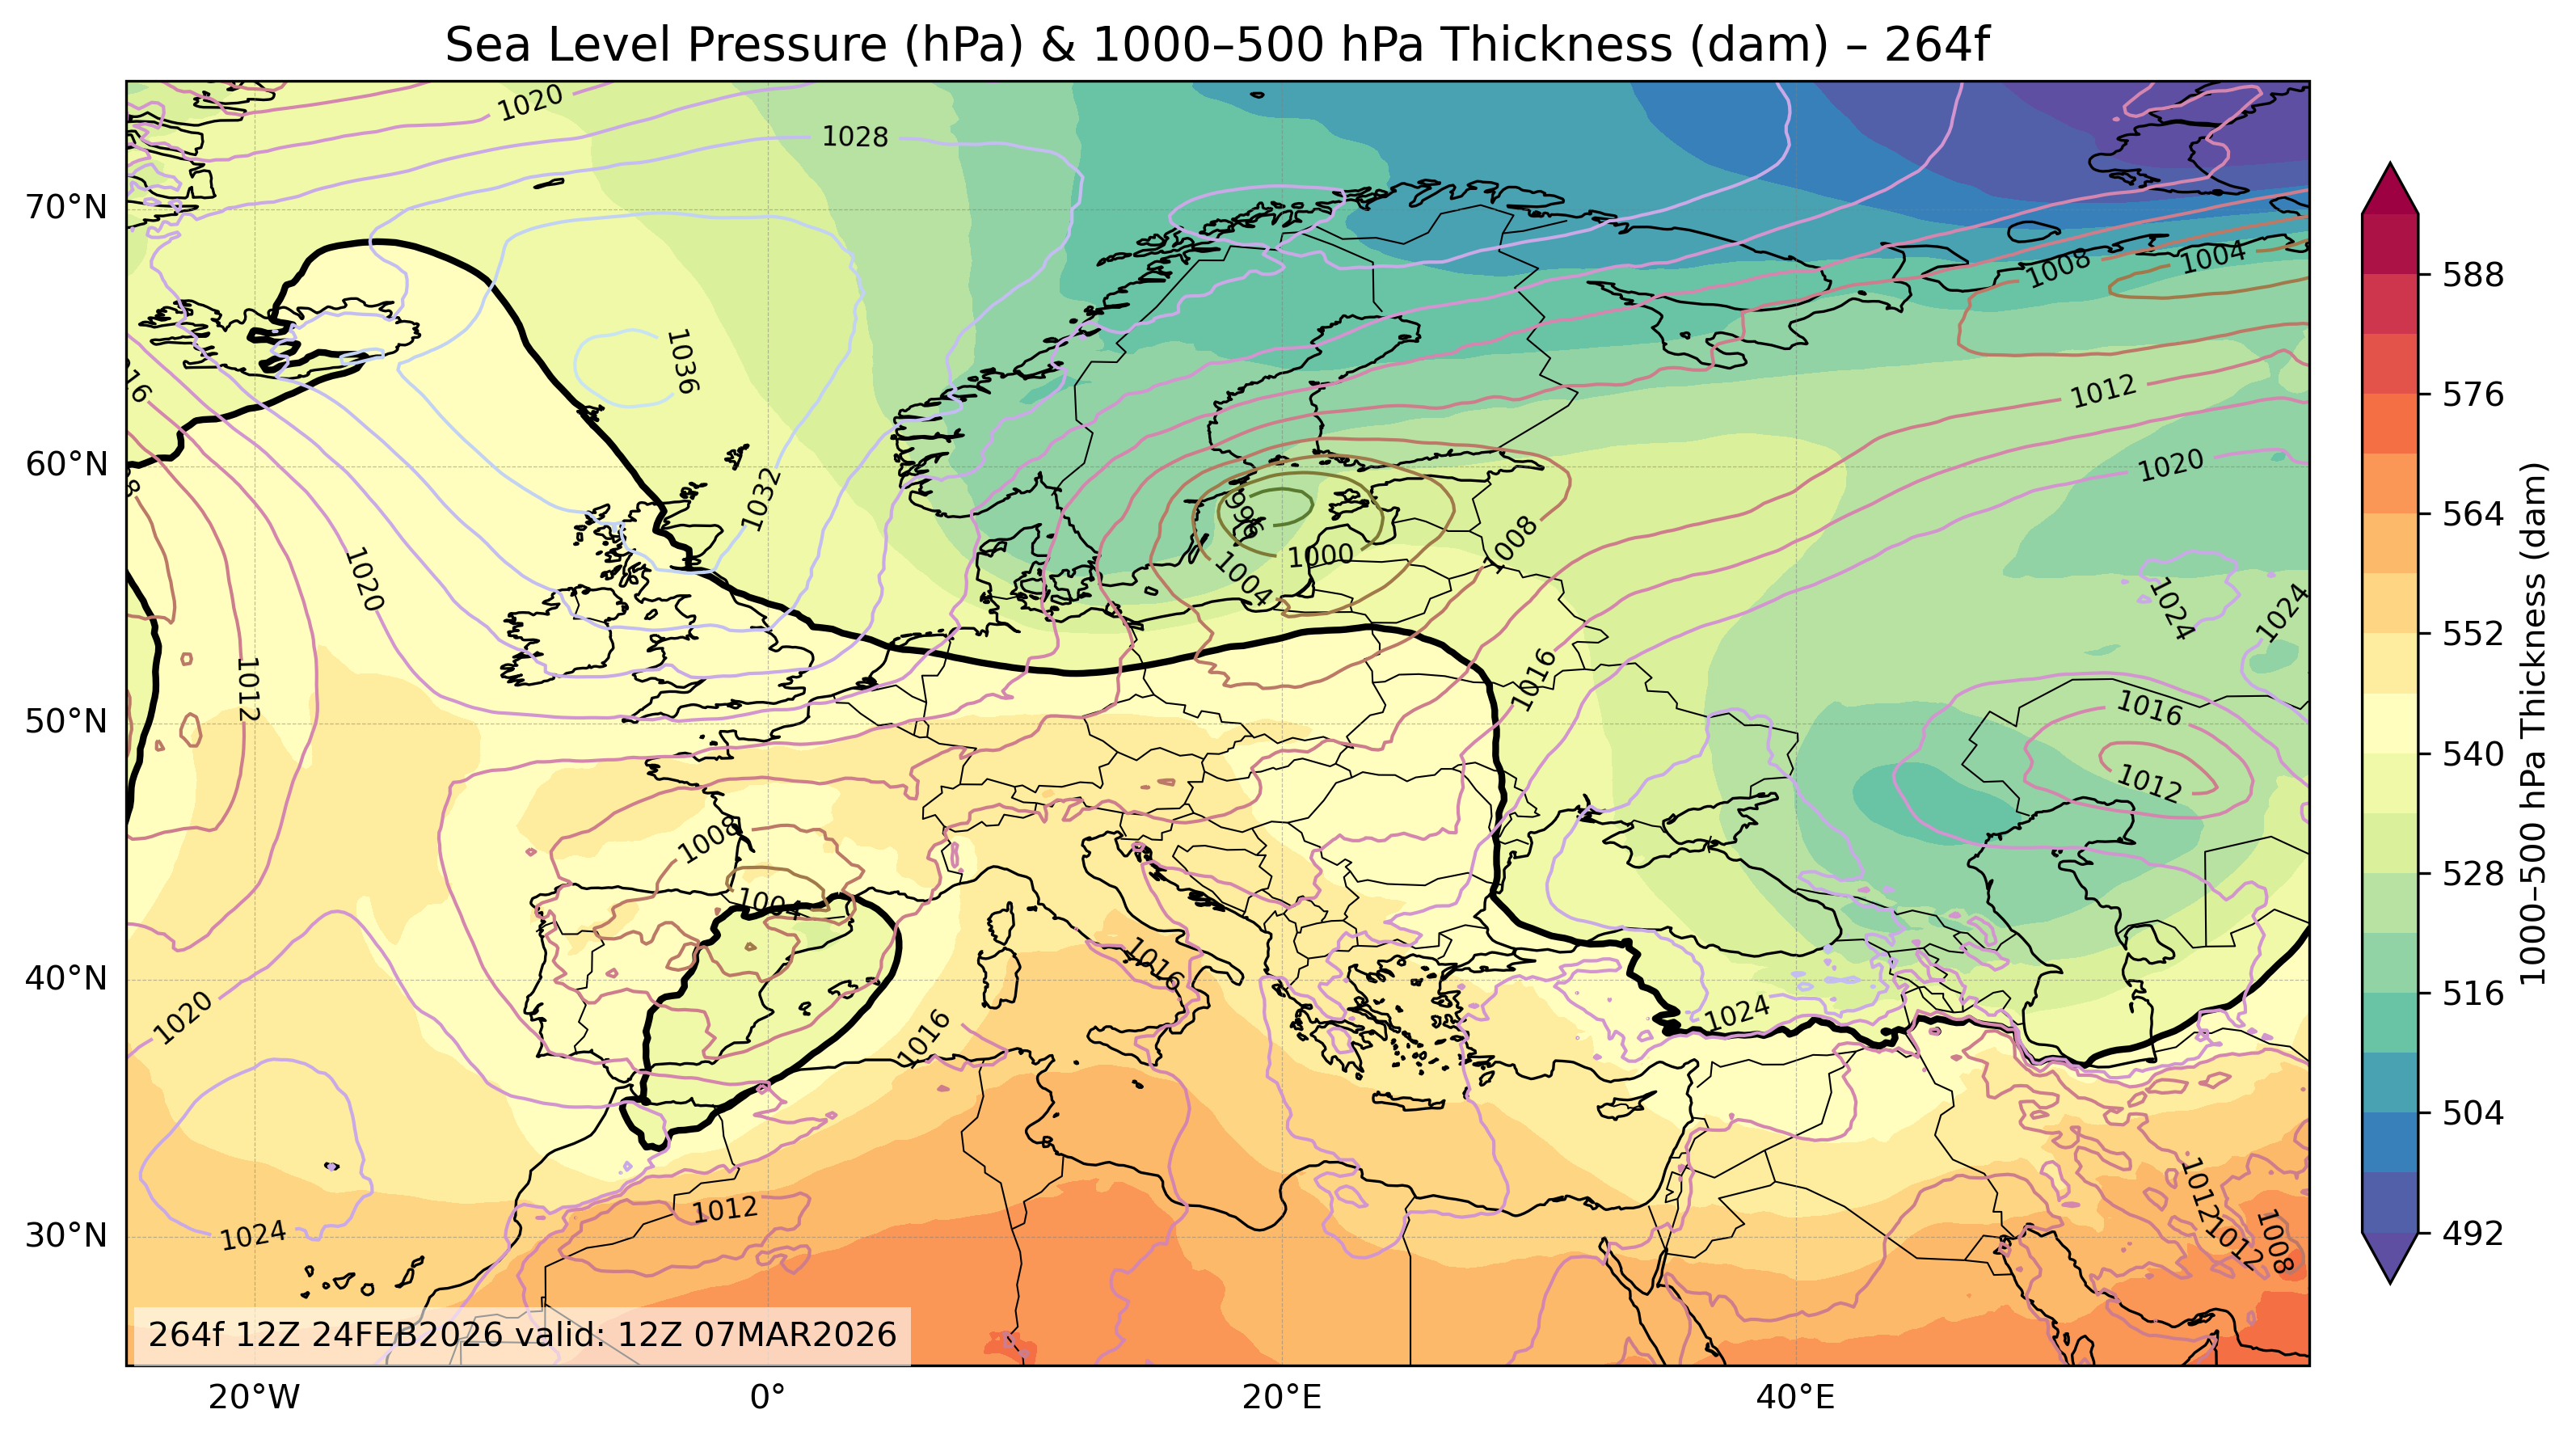
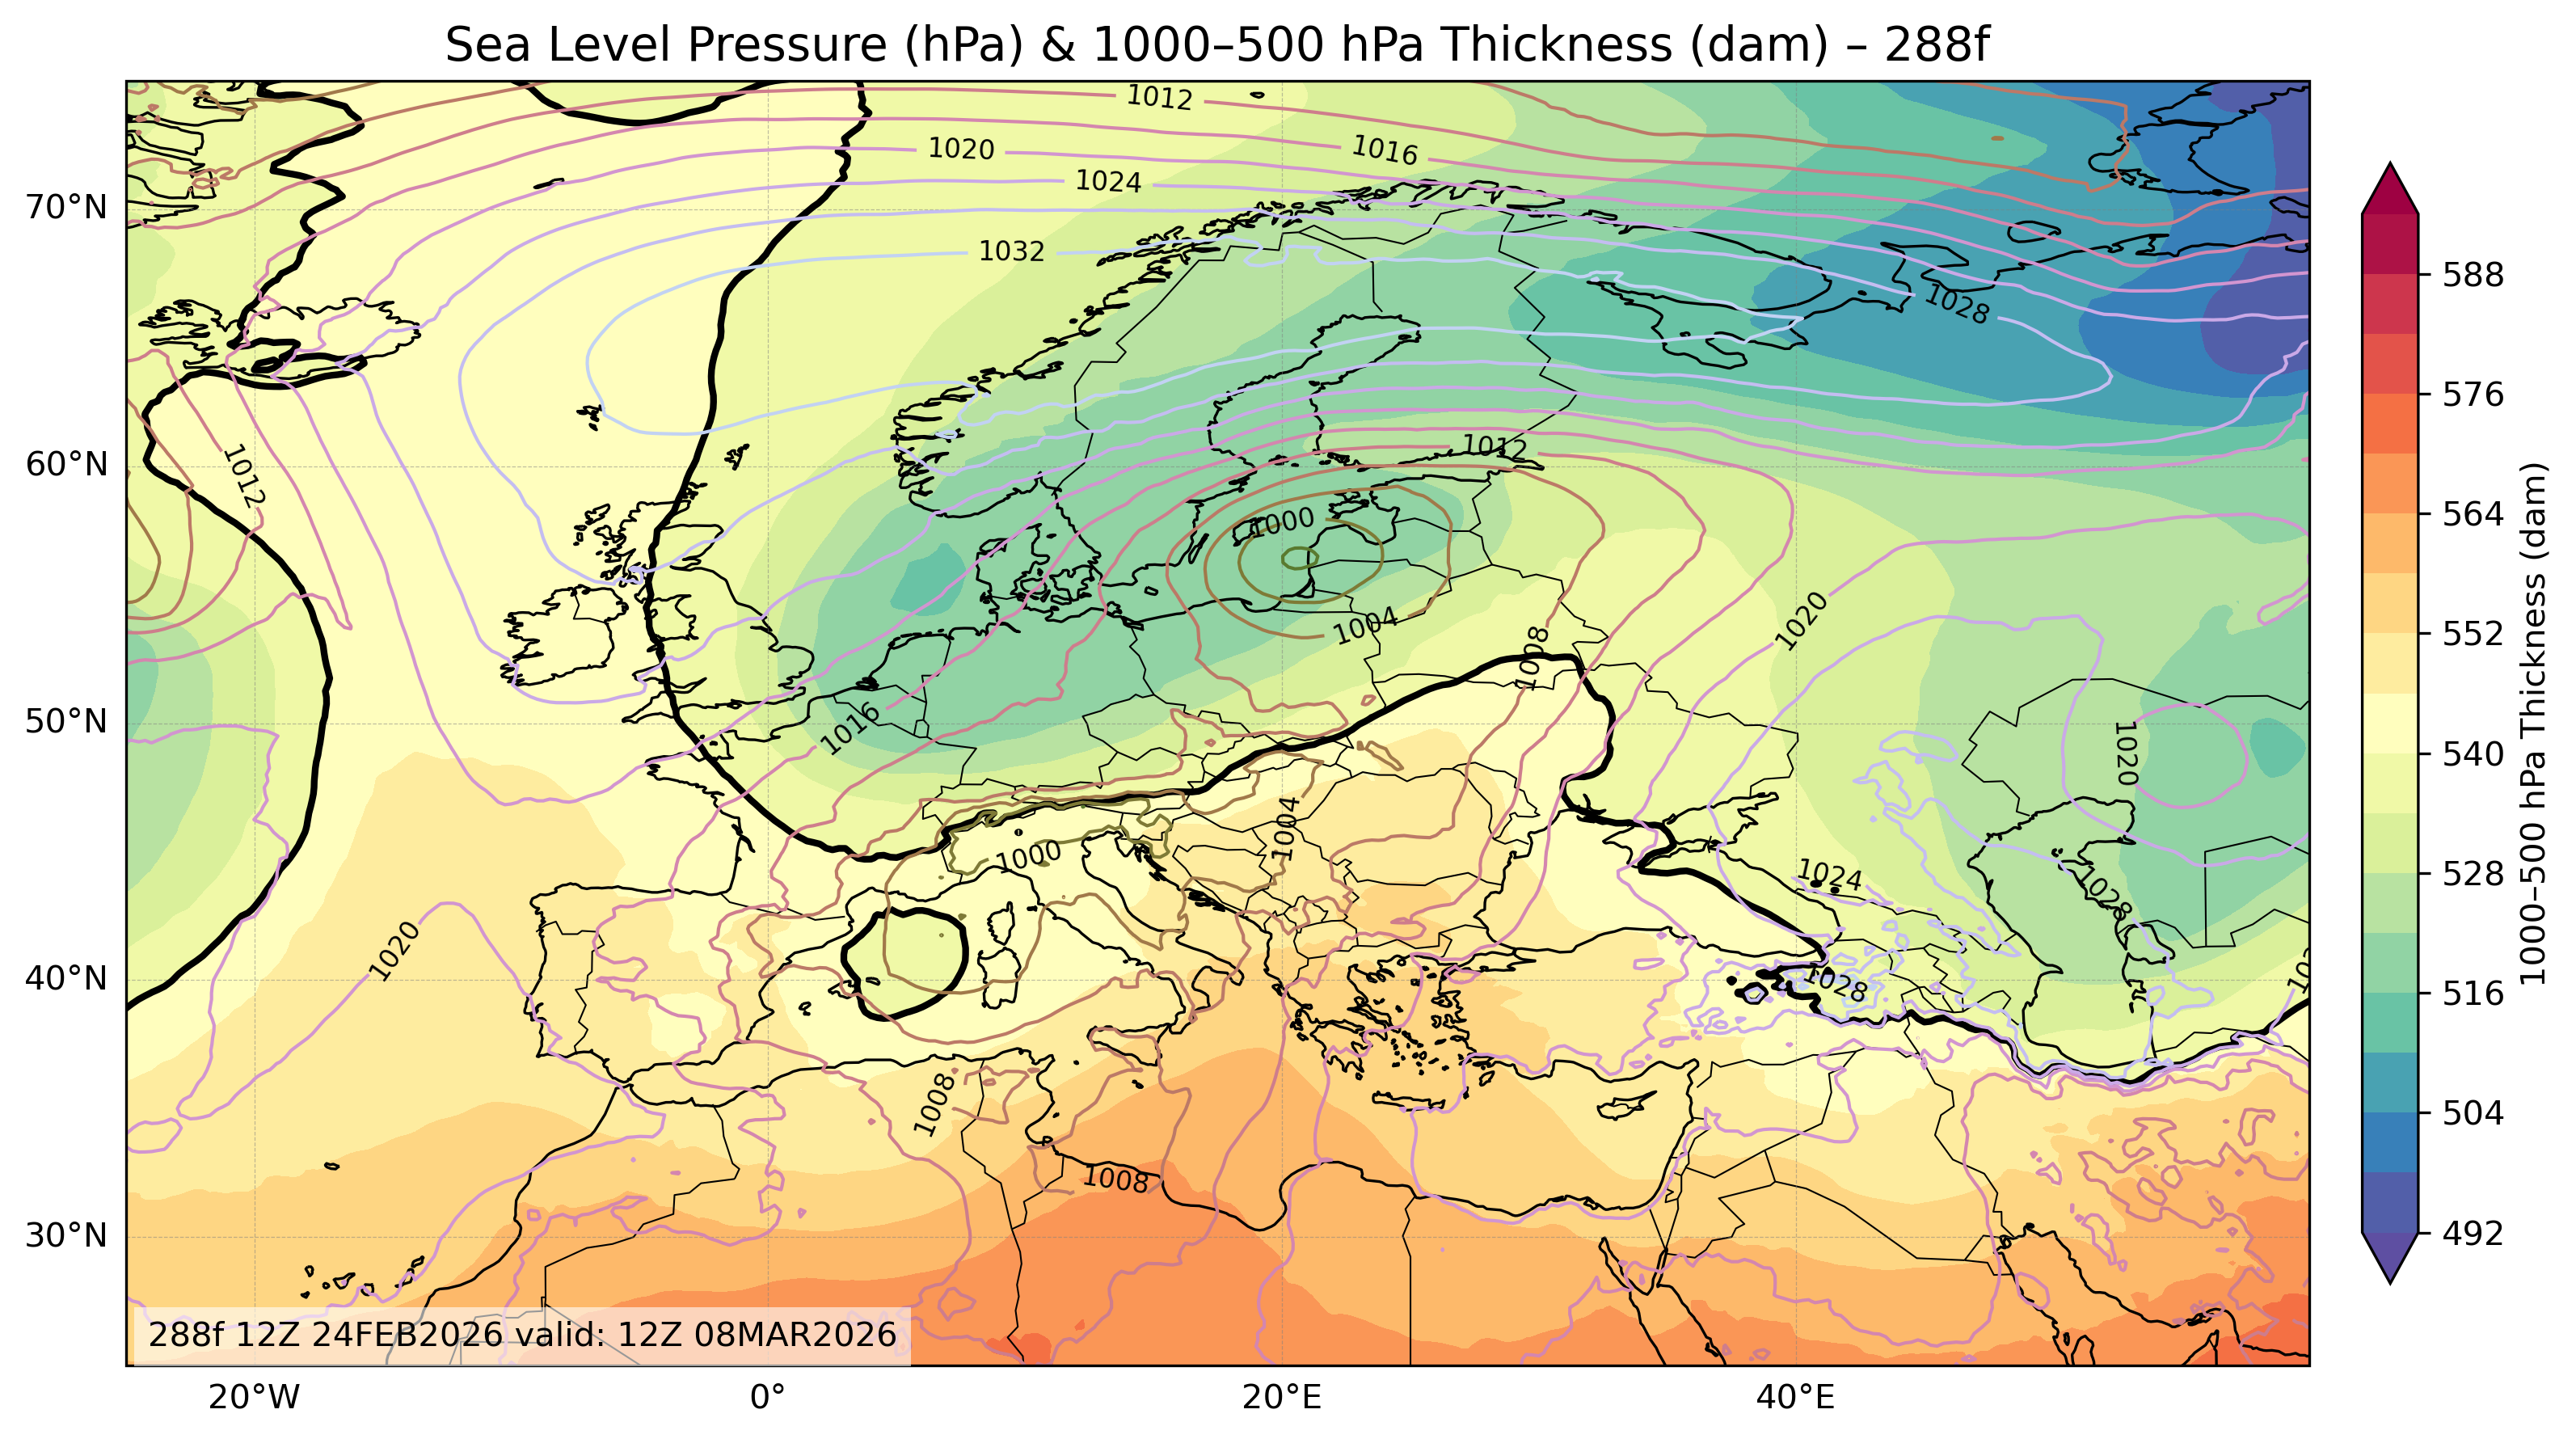
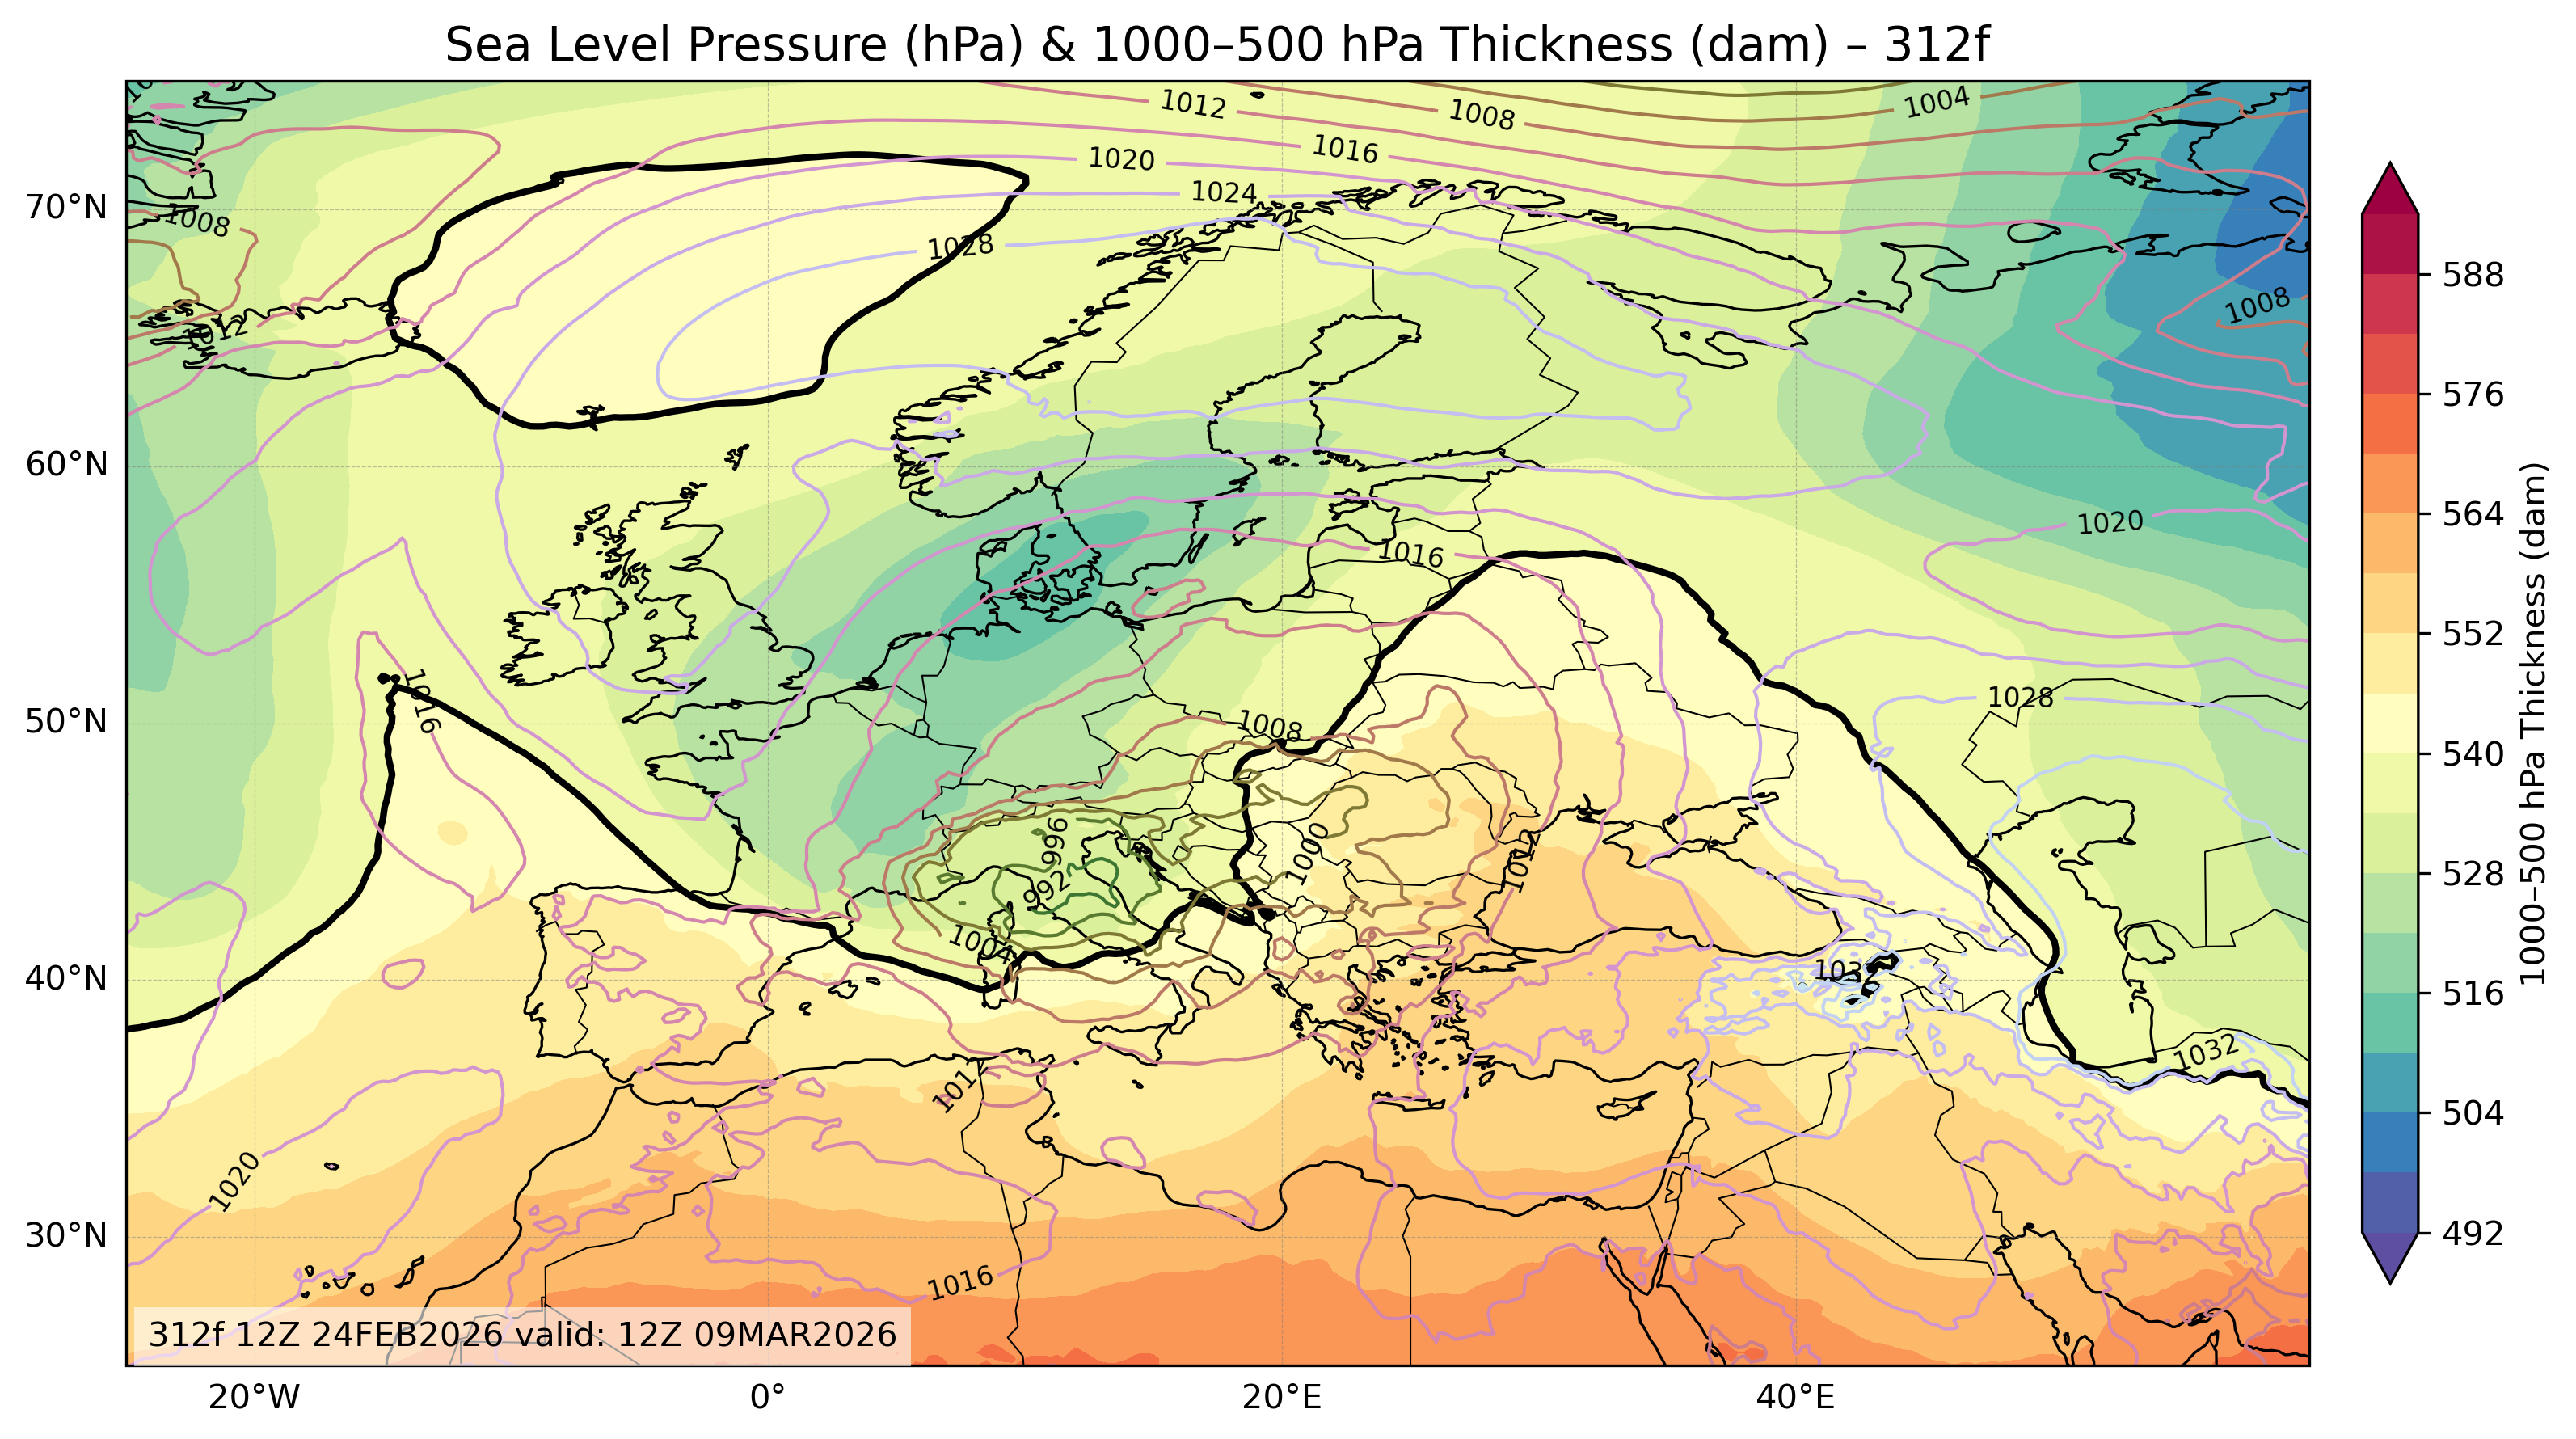
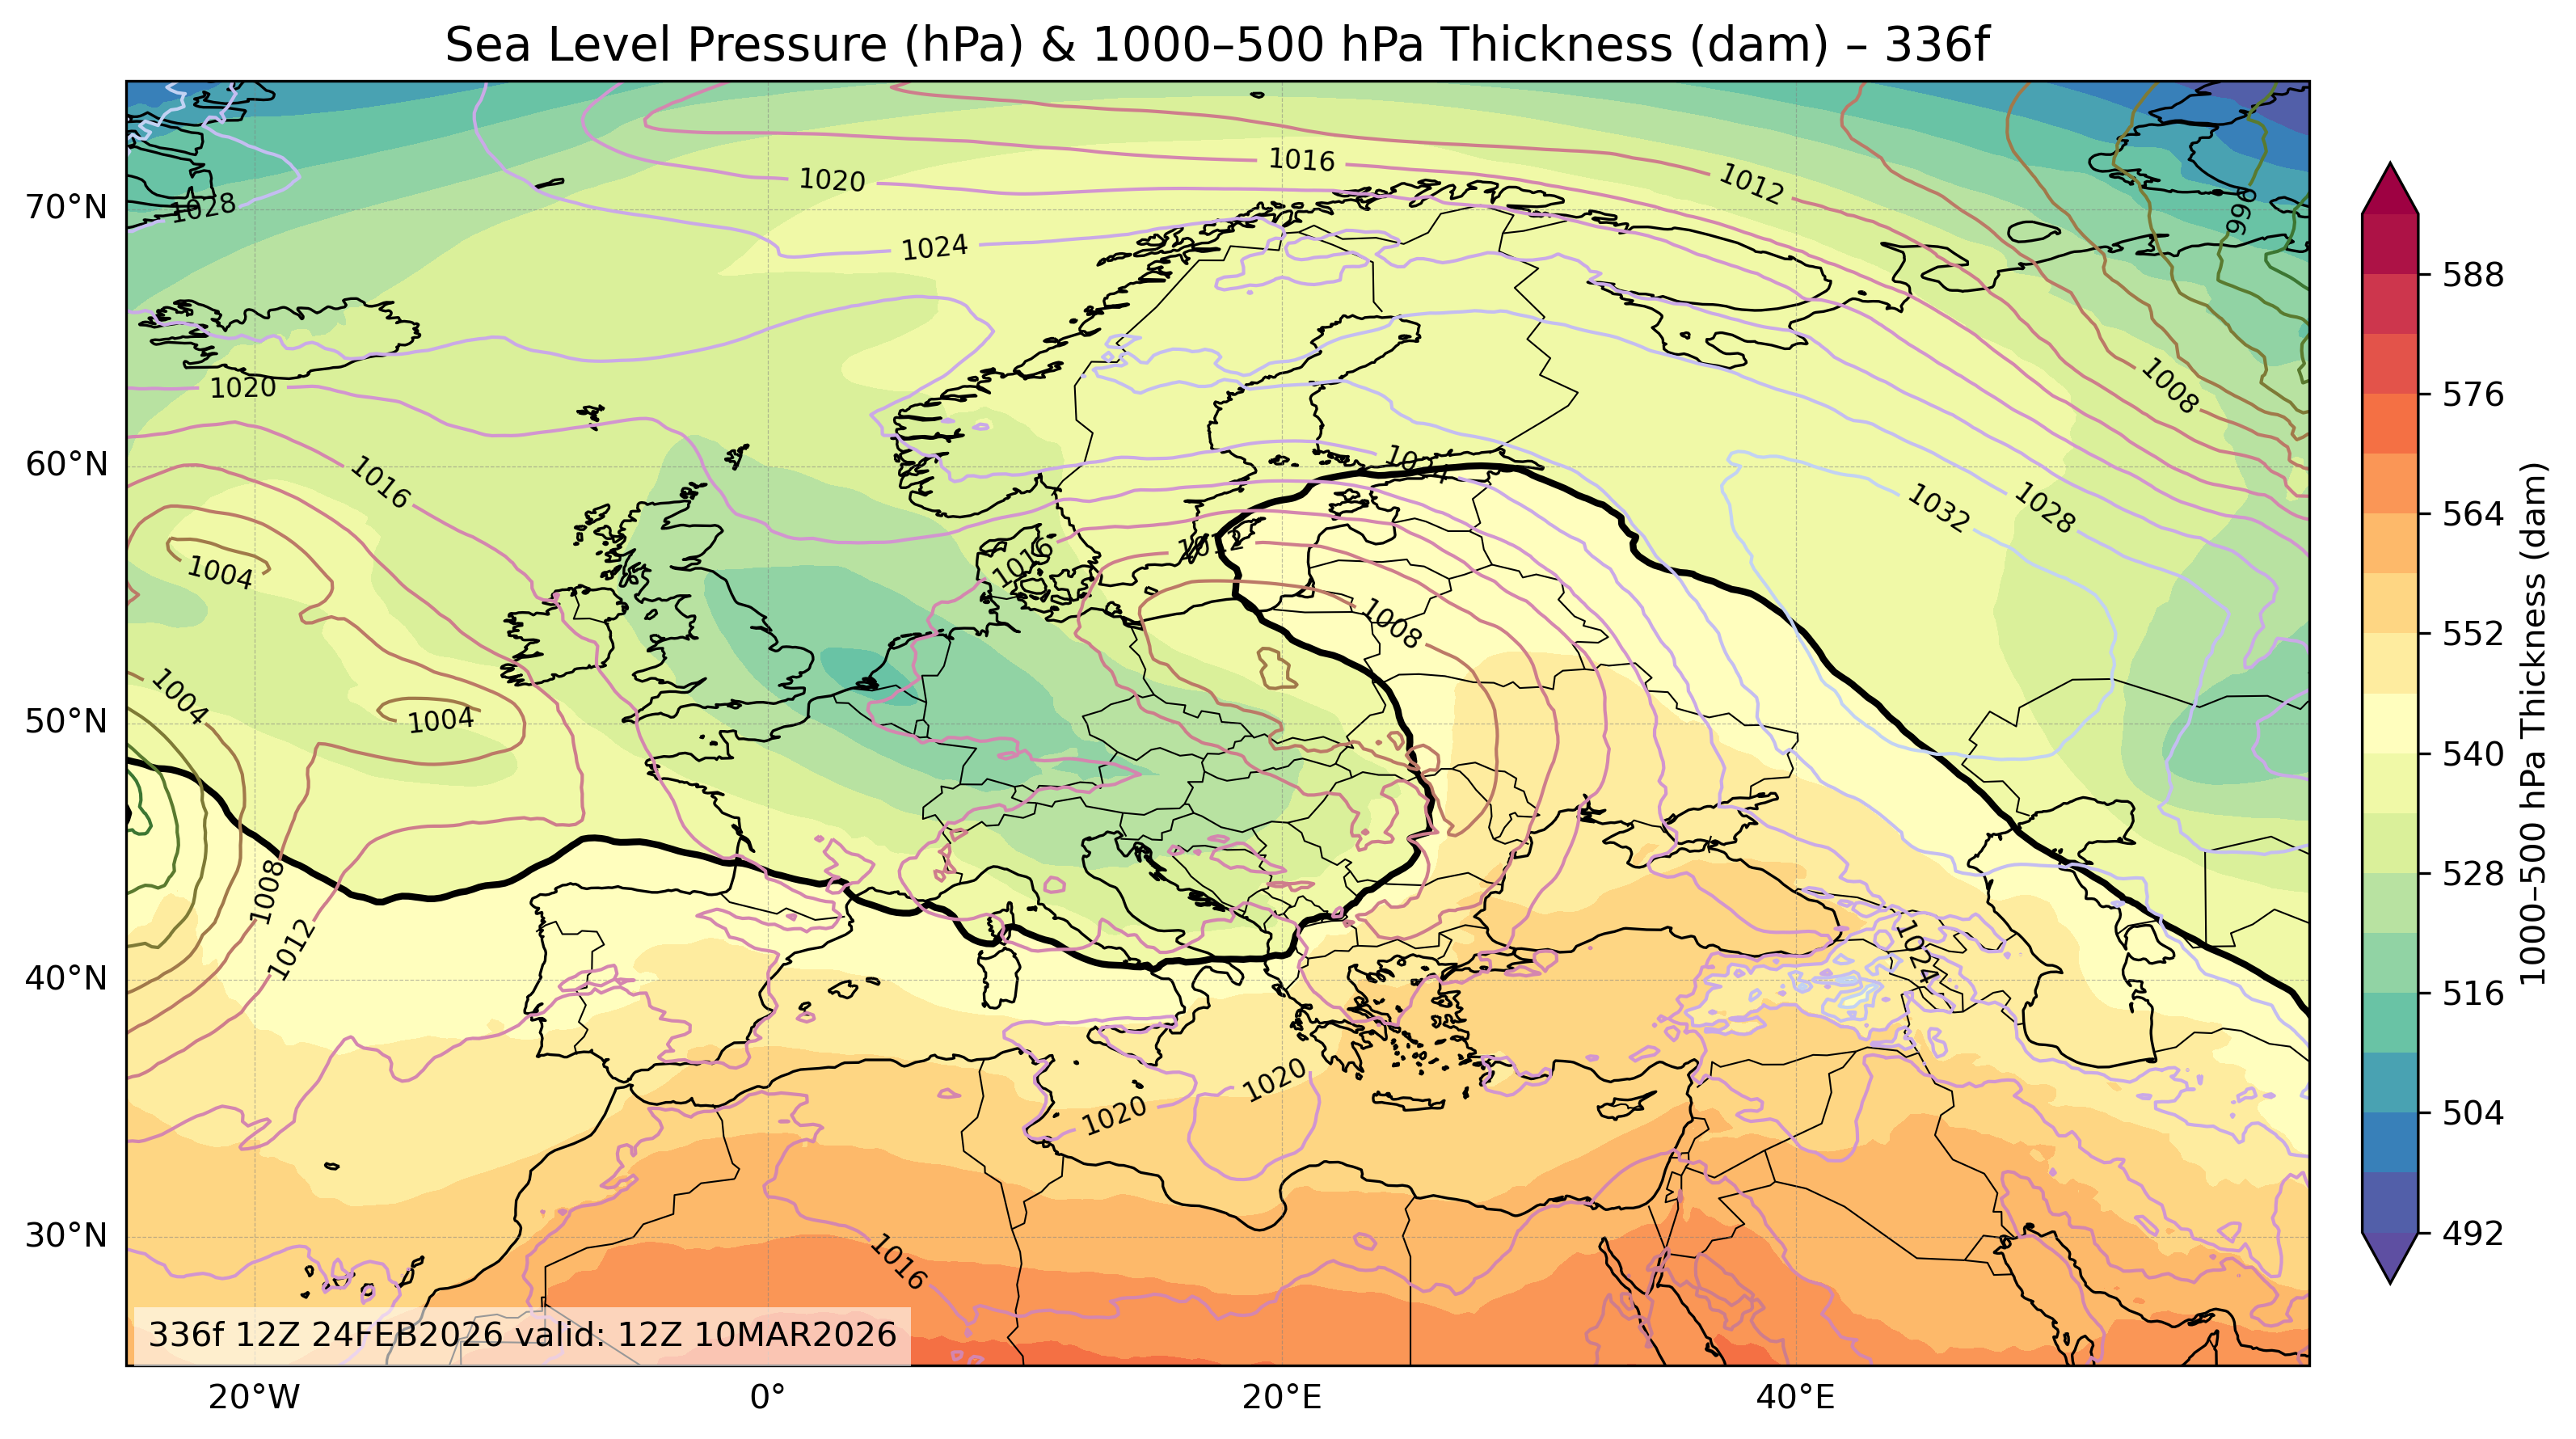
Sea Level Pressure & 1000-500mb Thickness
The Sea Level Pressure & 1000-500mb Thickness charts reveal surface pressure systems and temperature gradients. These fields are key for detecting frontal zones and estimating precipitation potential. A narrowing of the thickness lines often indicates the approach of a cold front, while widening suggests warmer air advection.
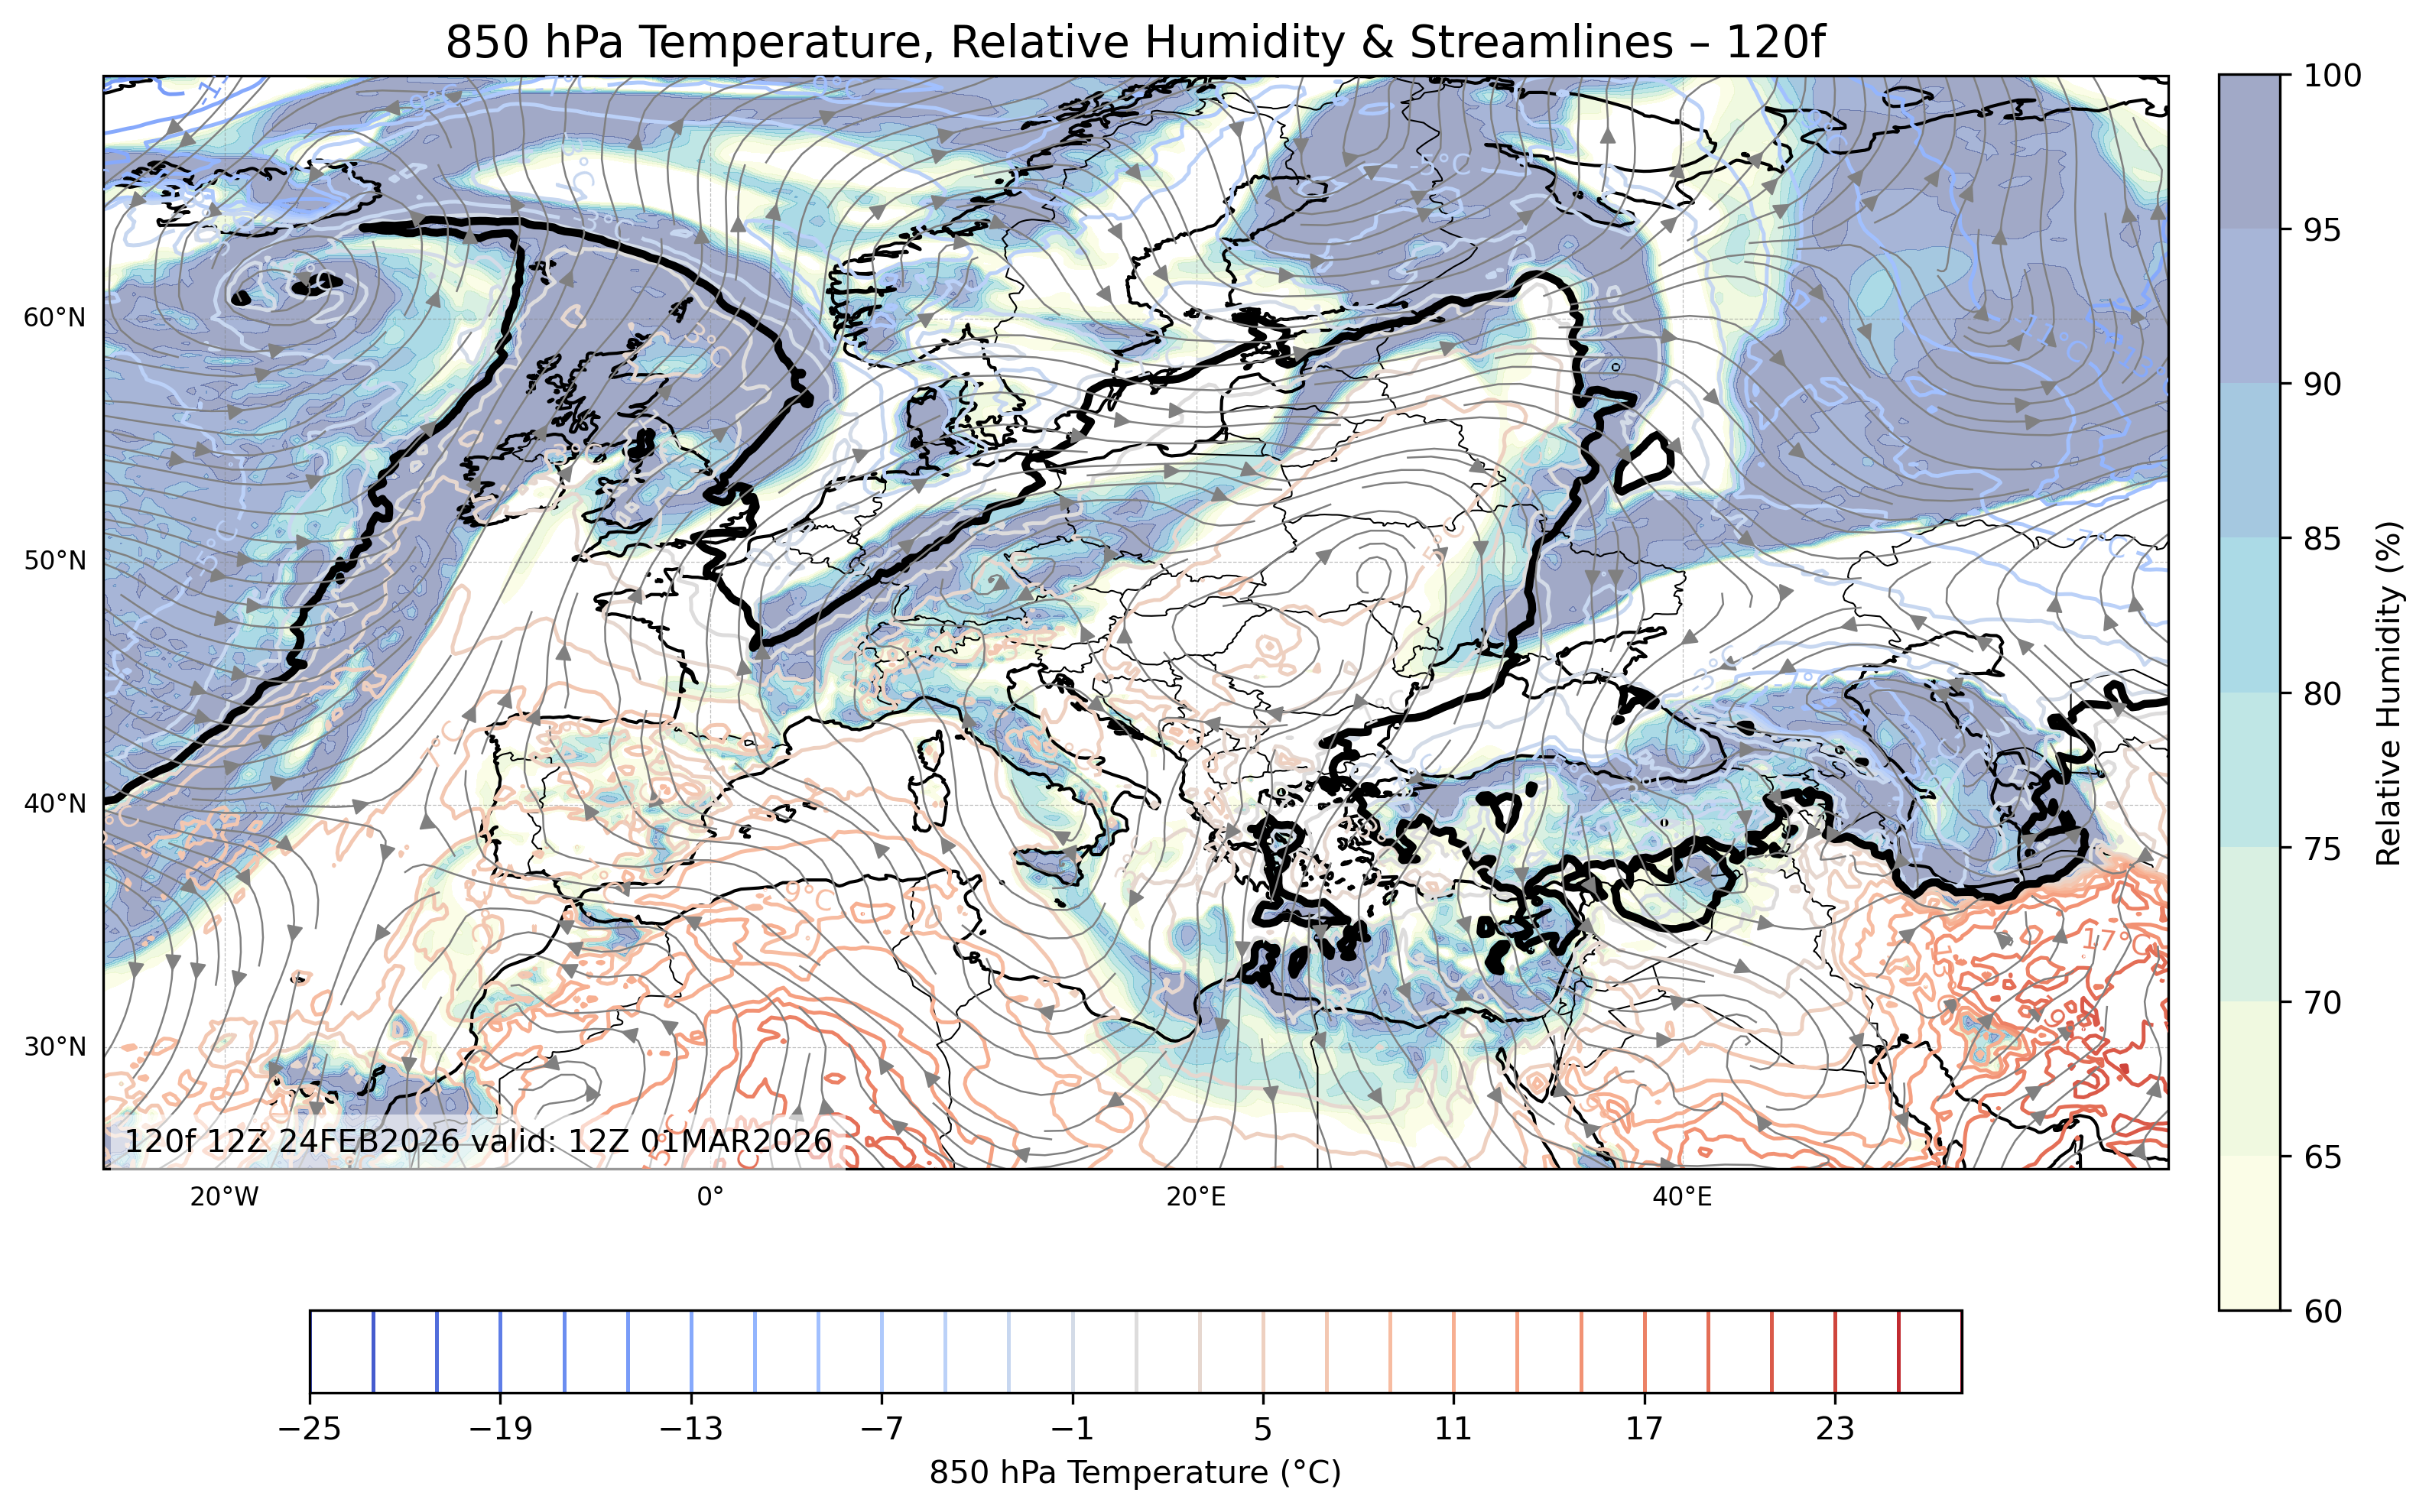
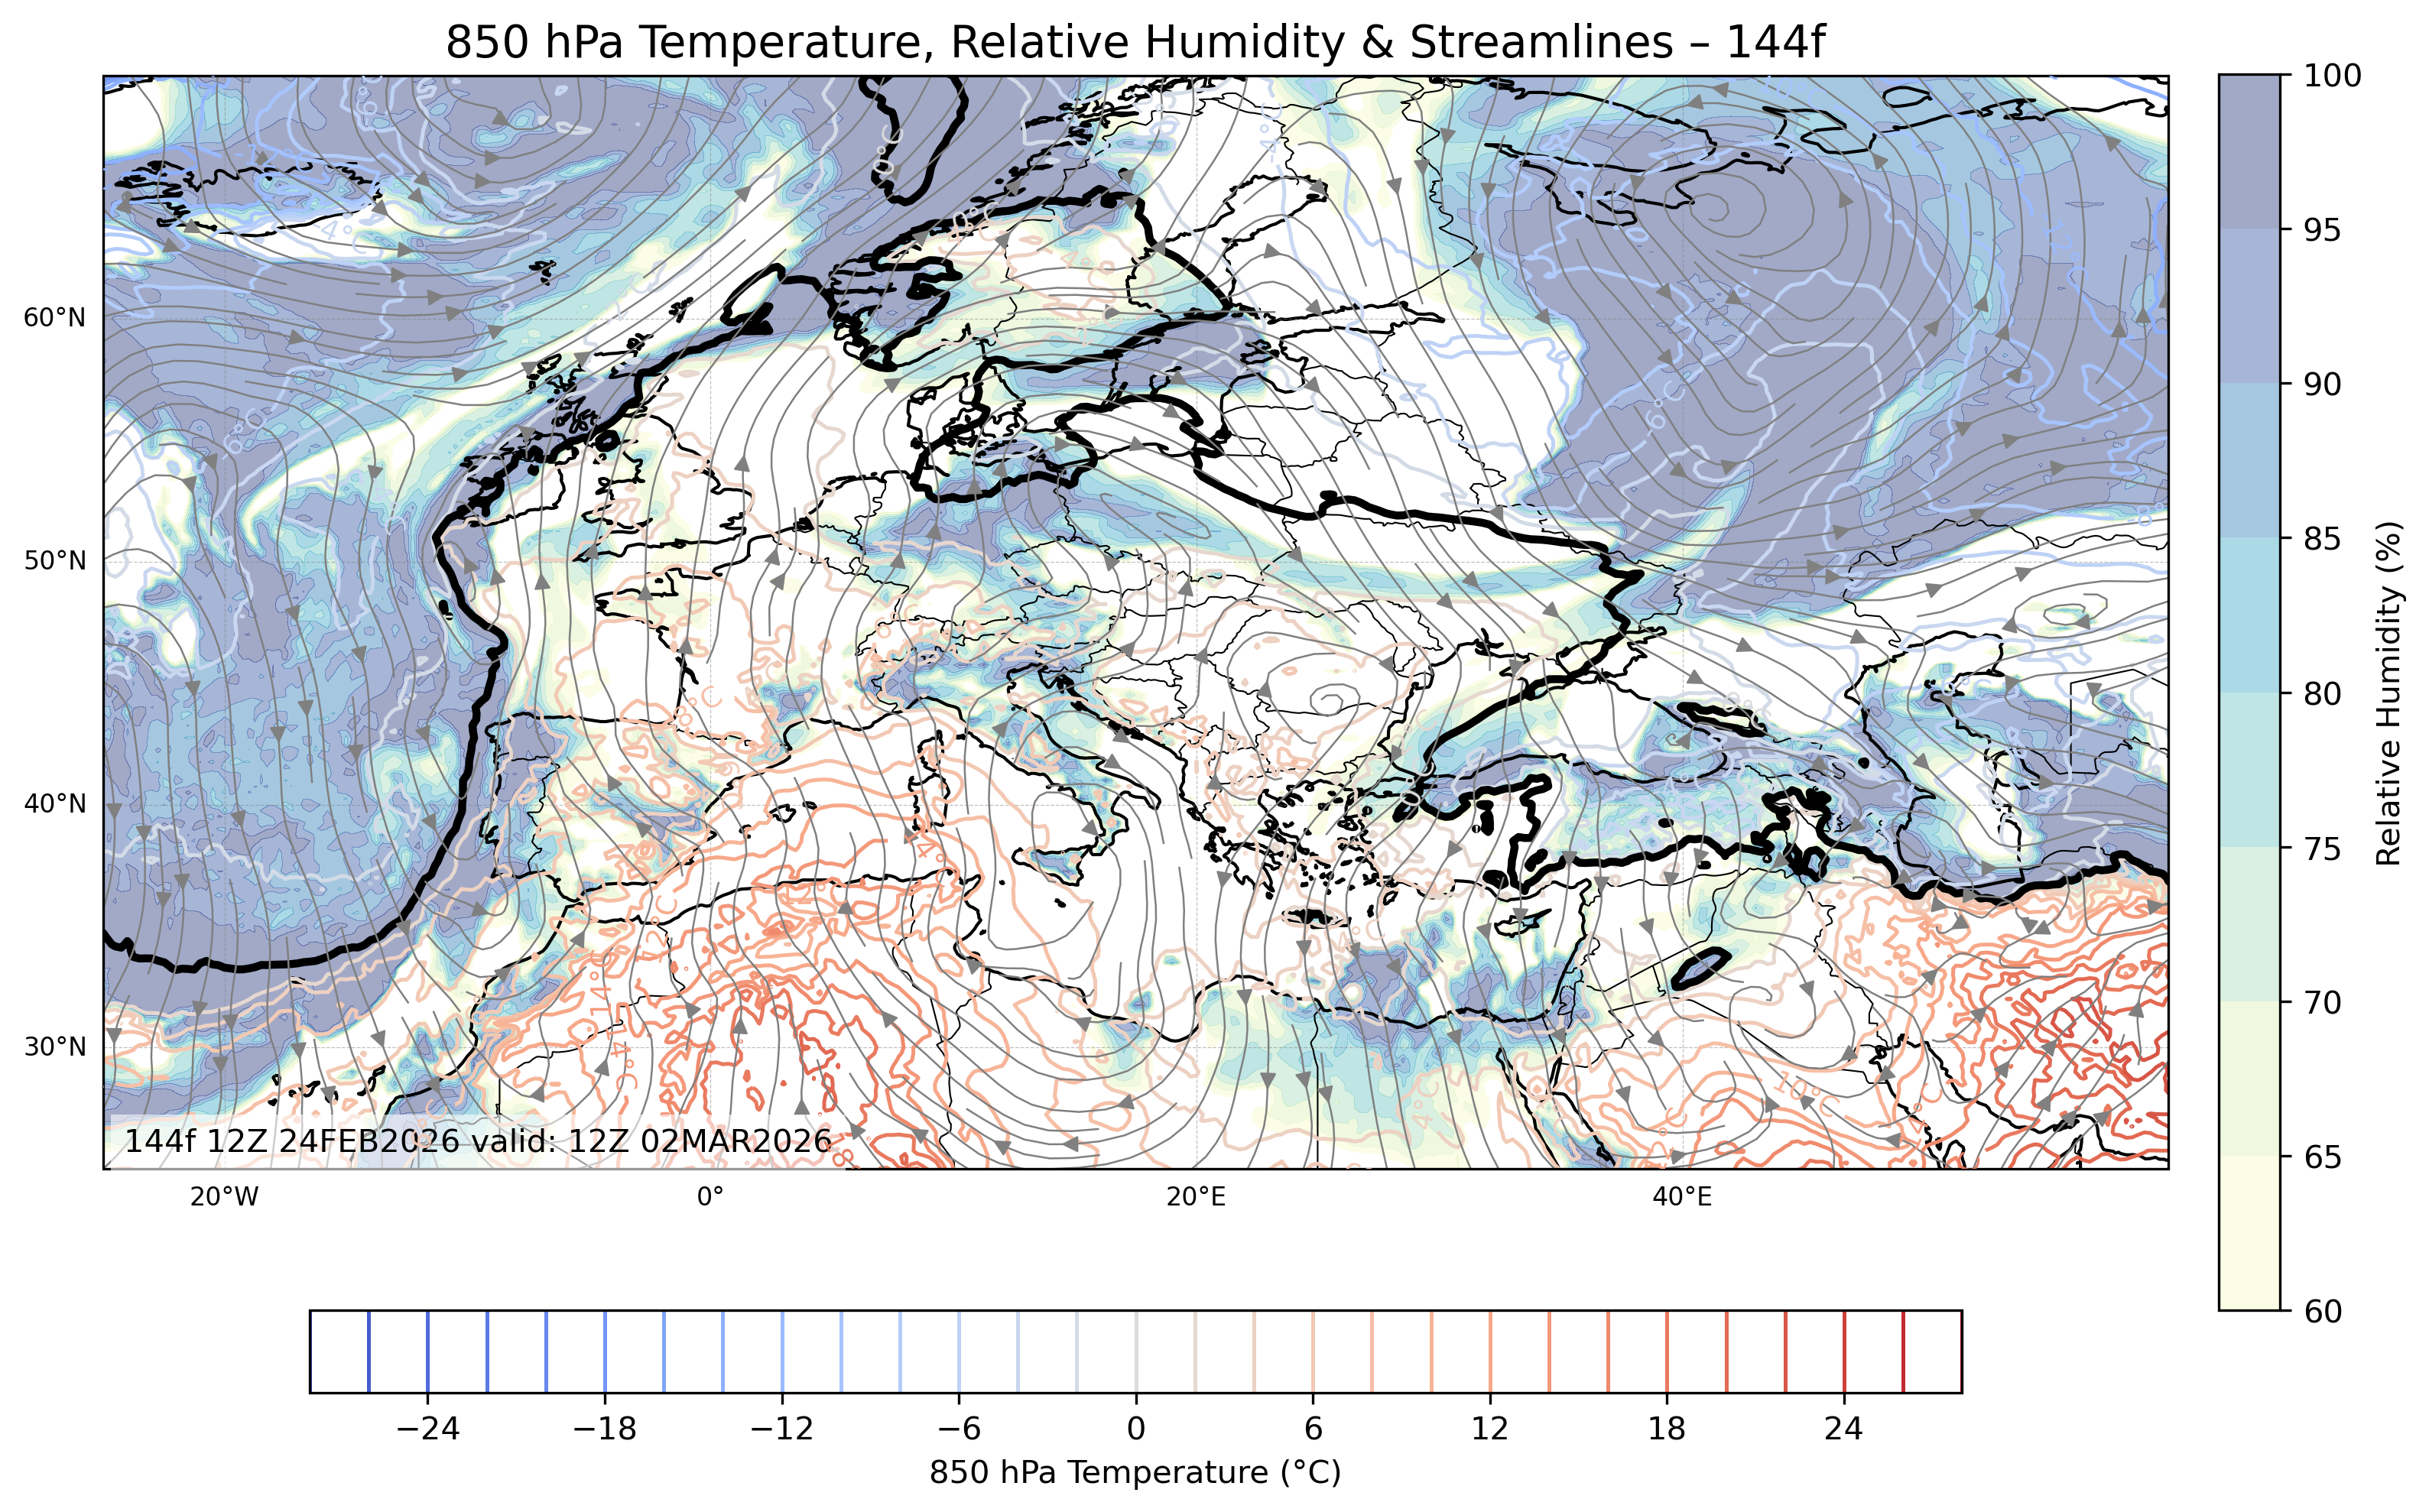
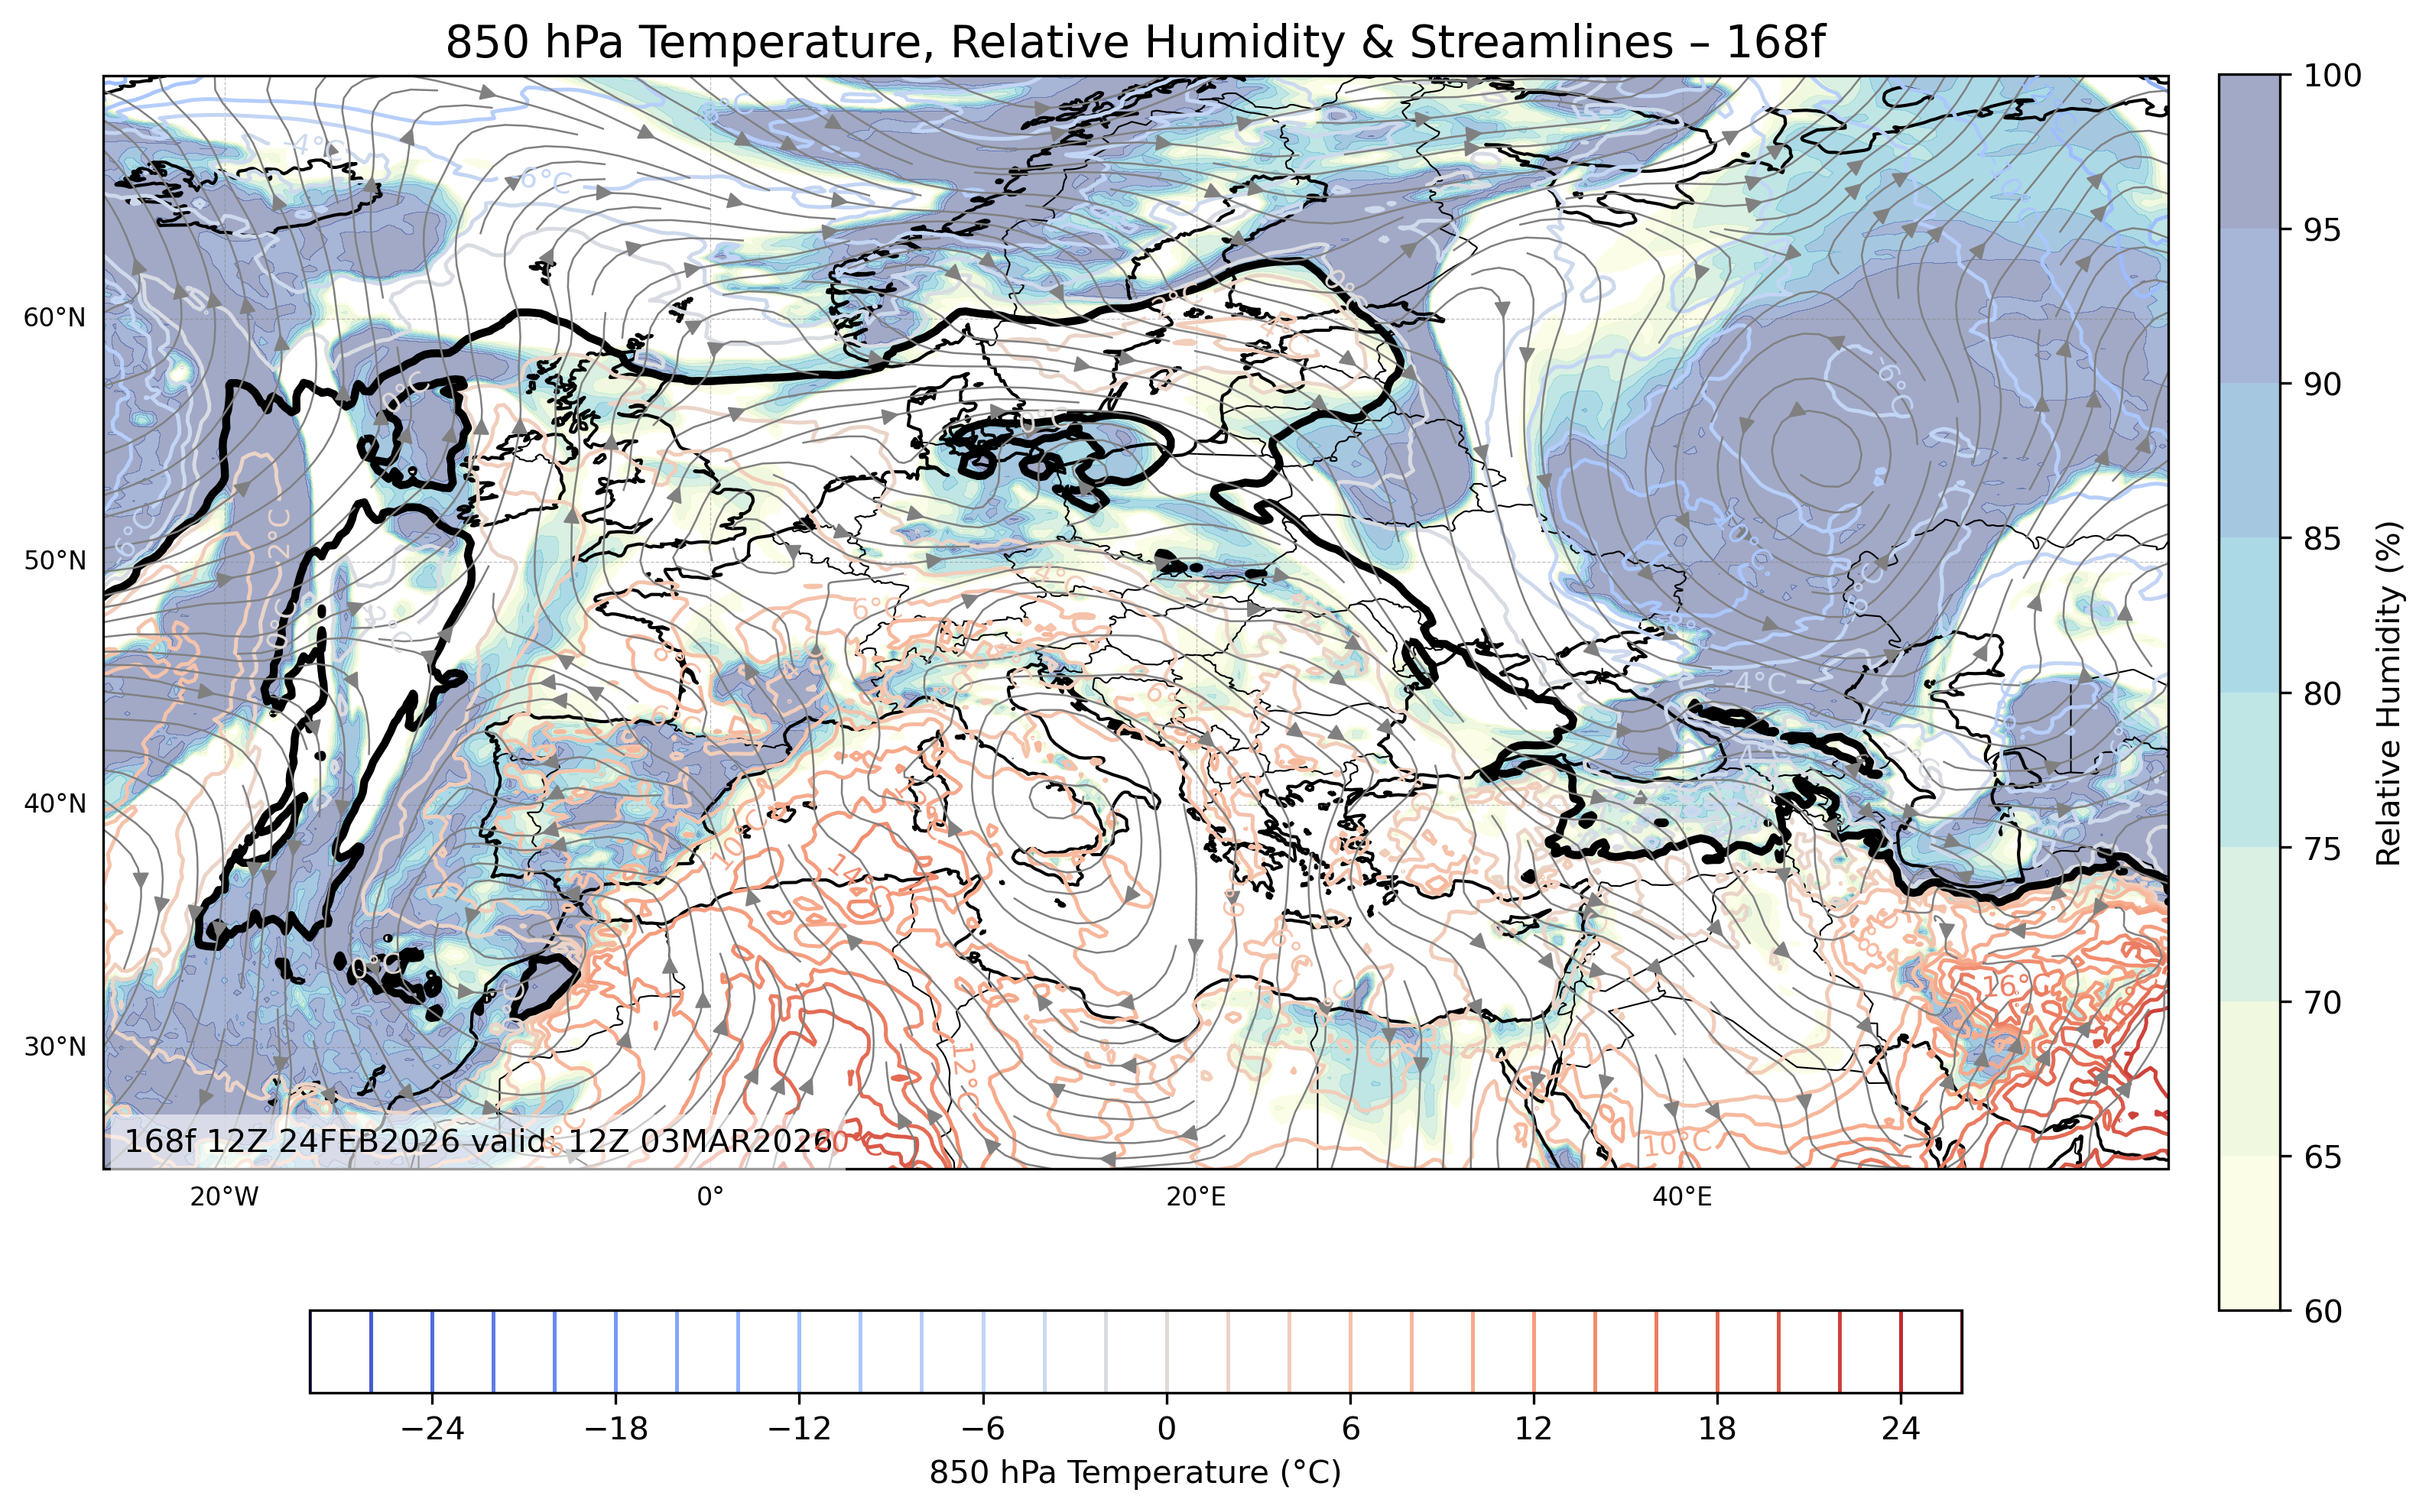
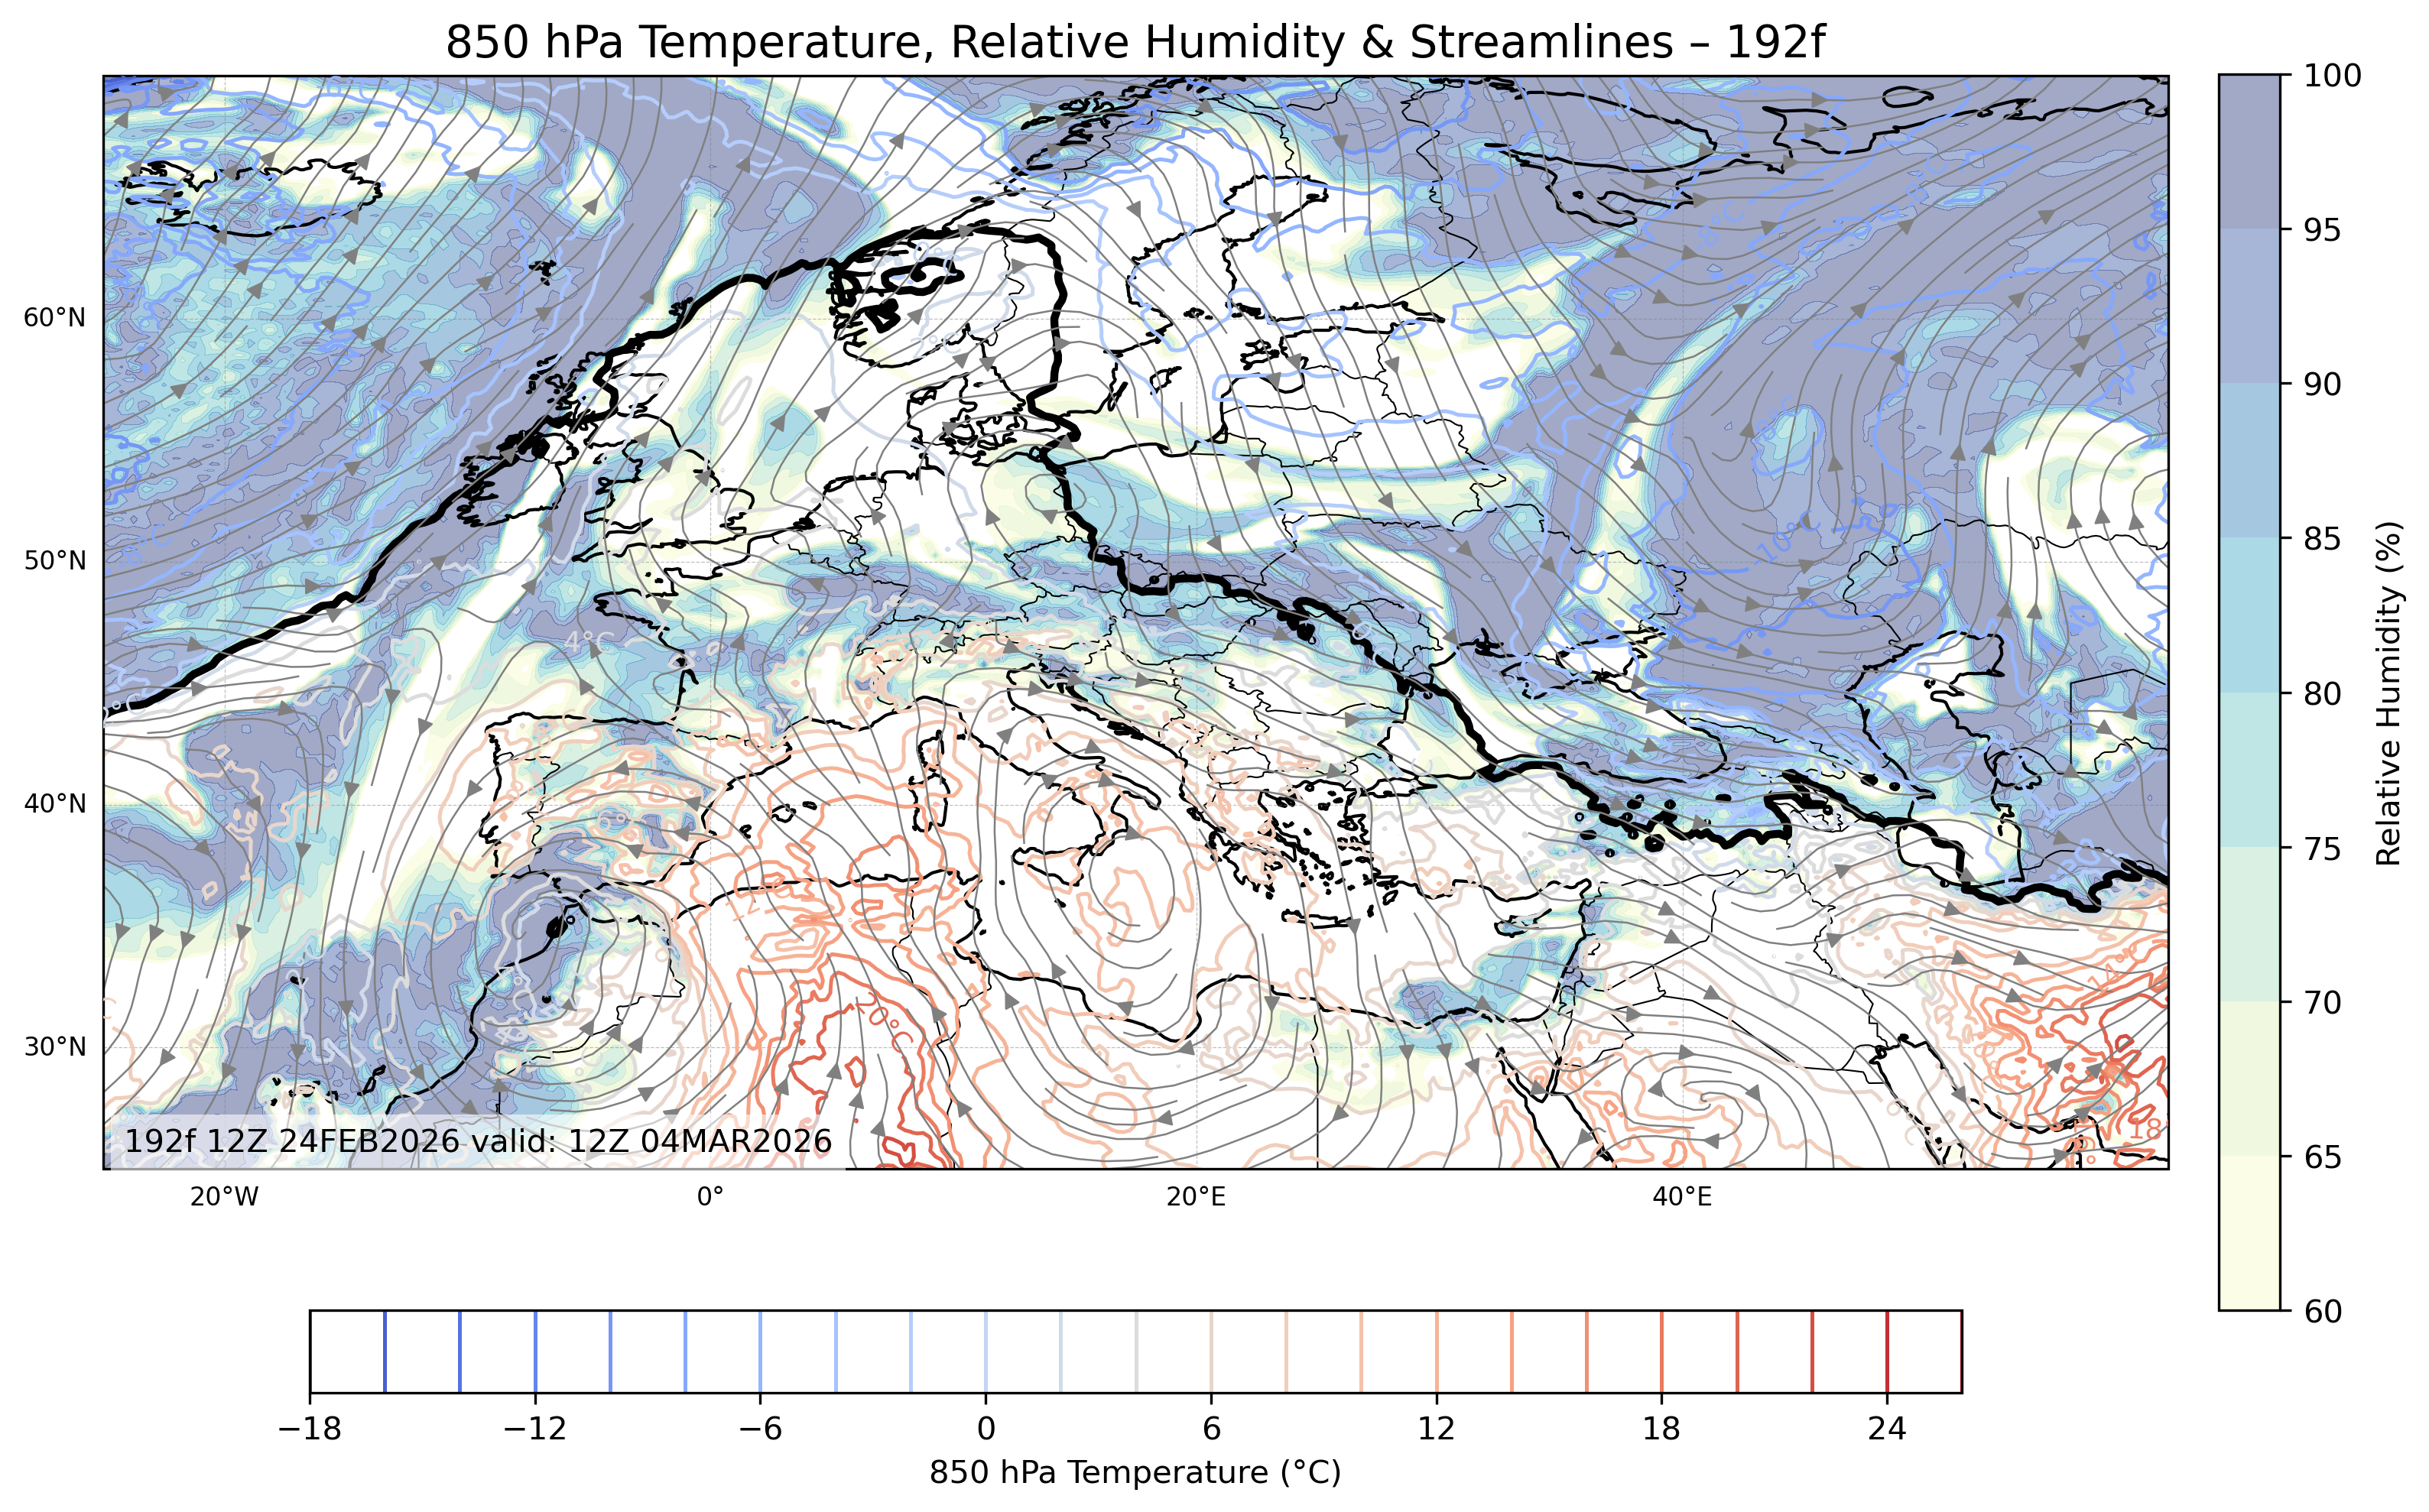
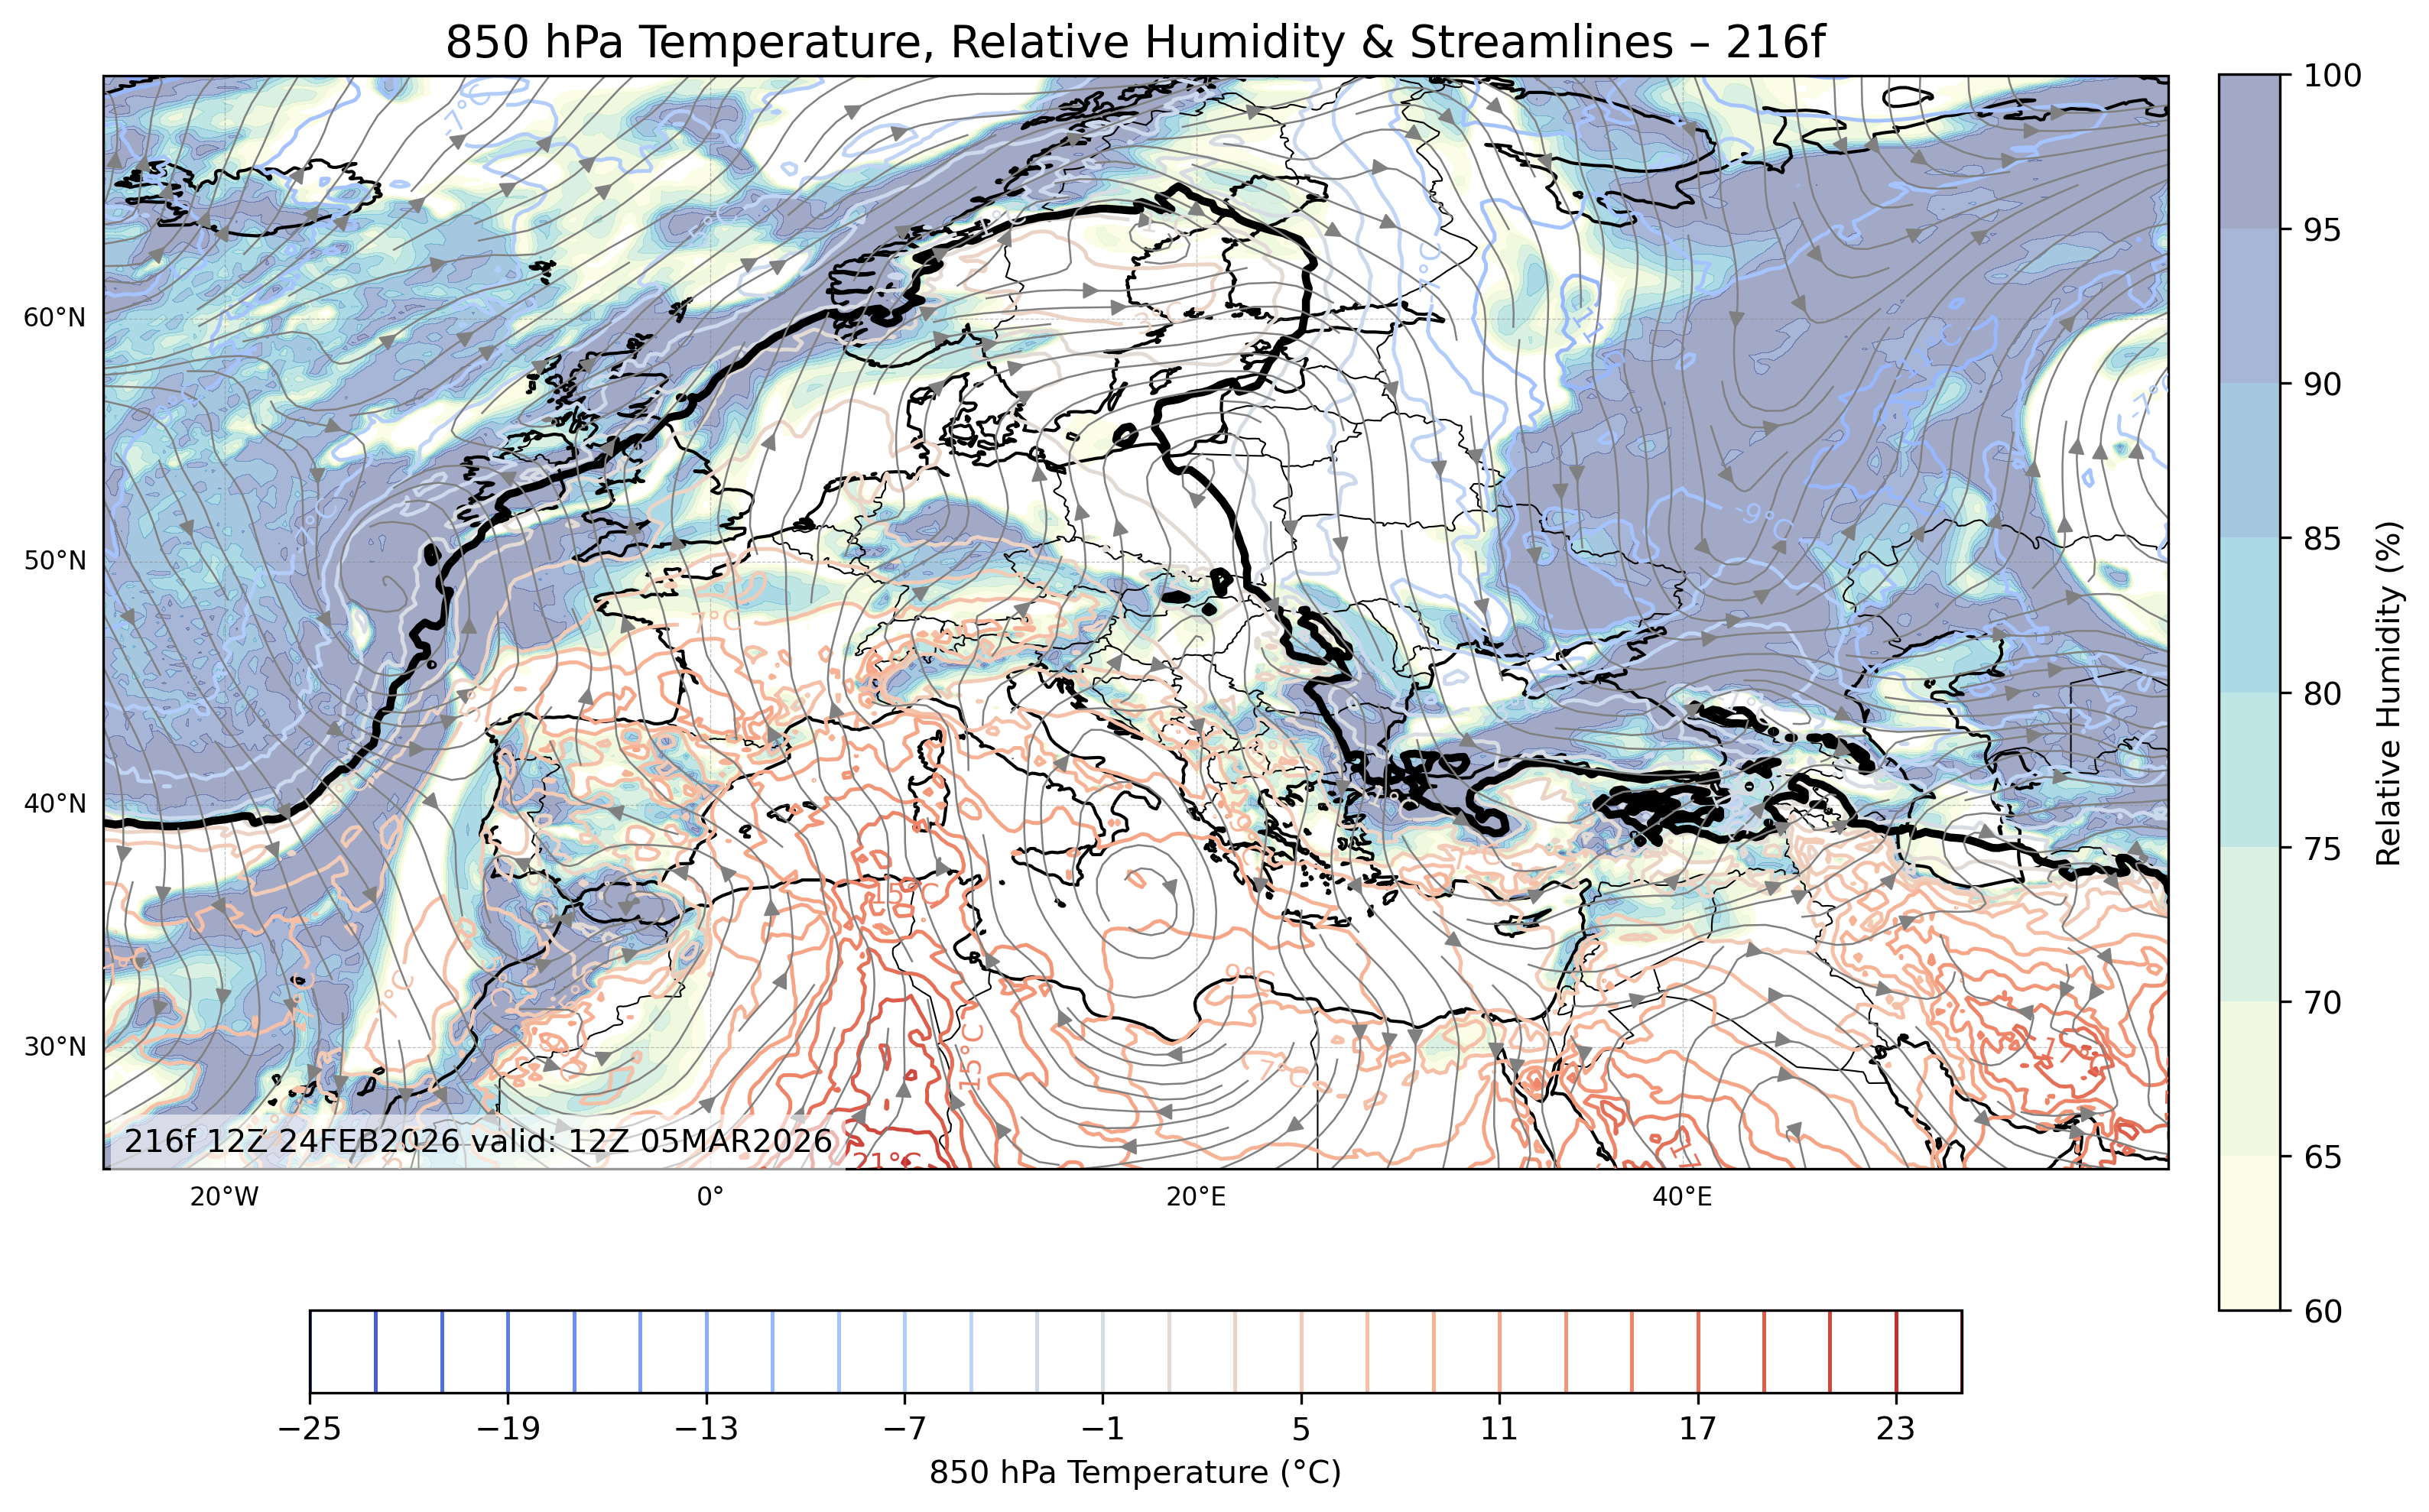
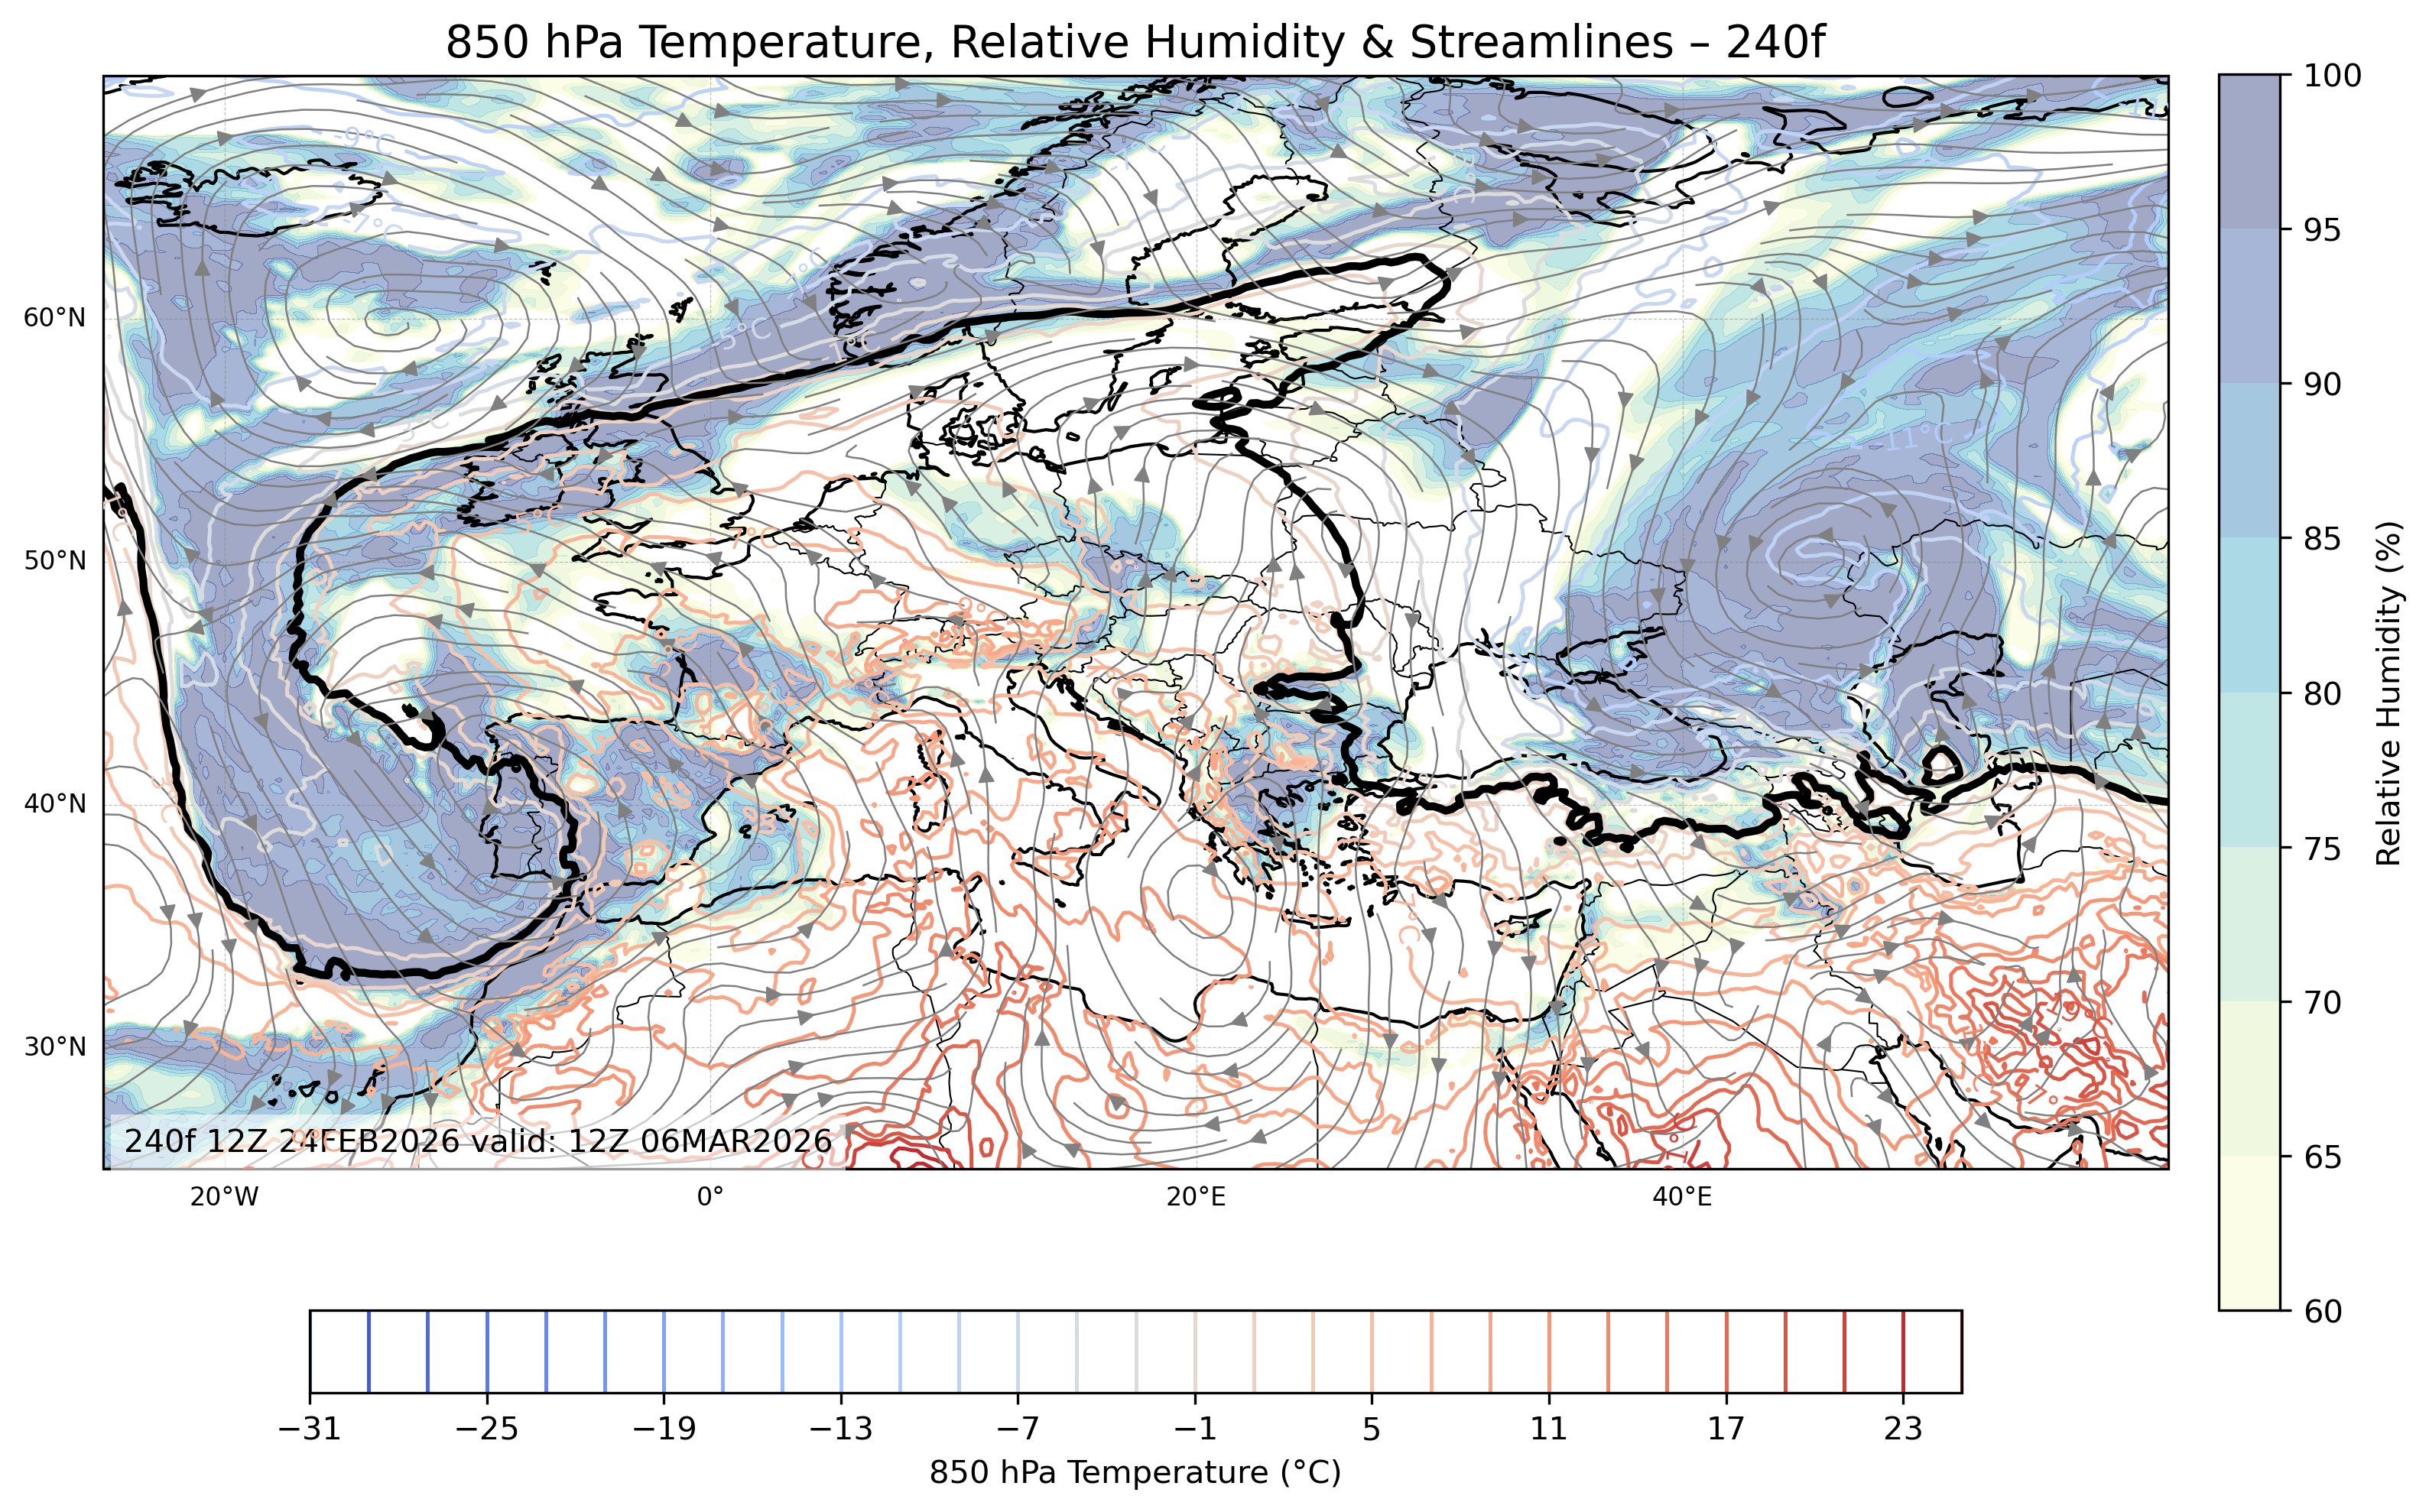
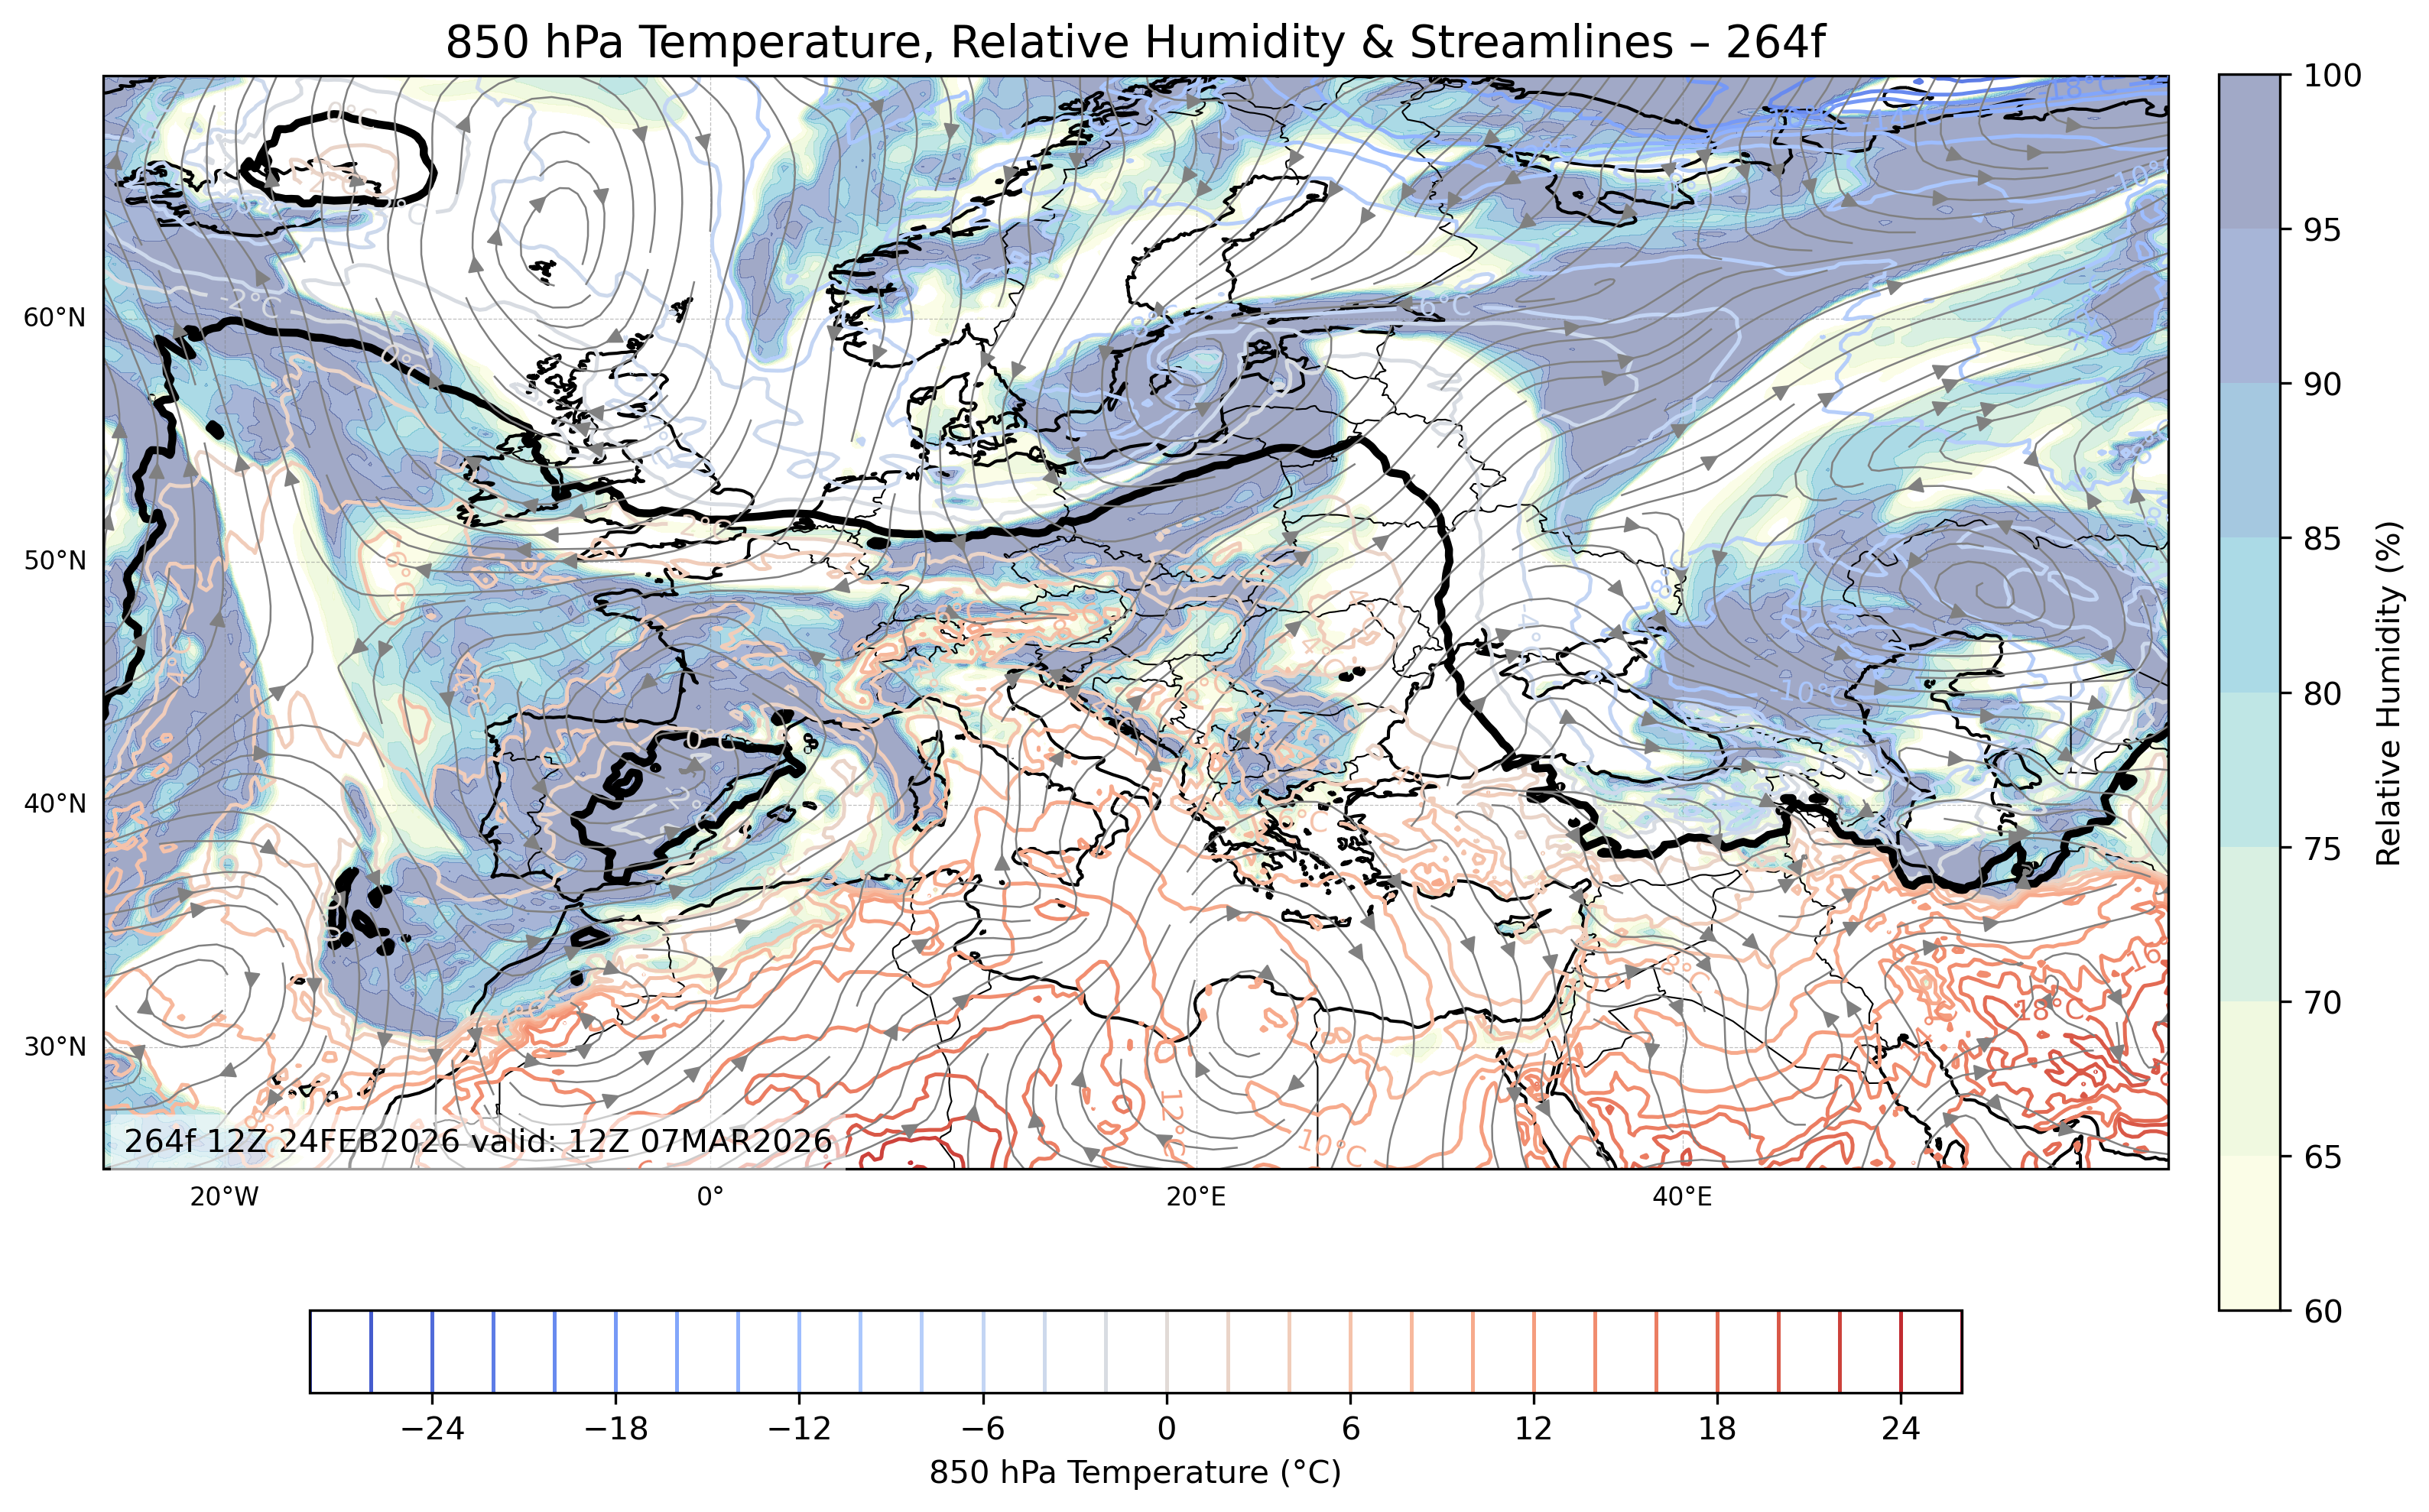
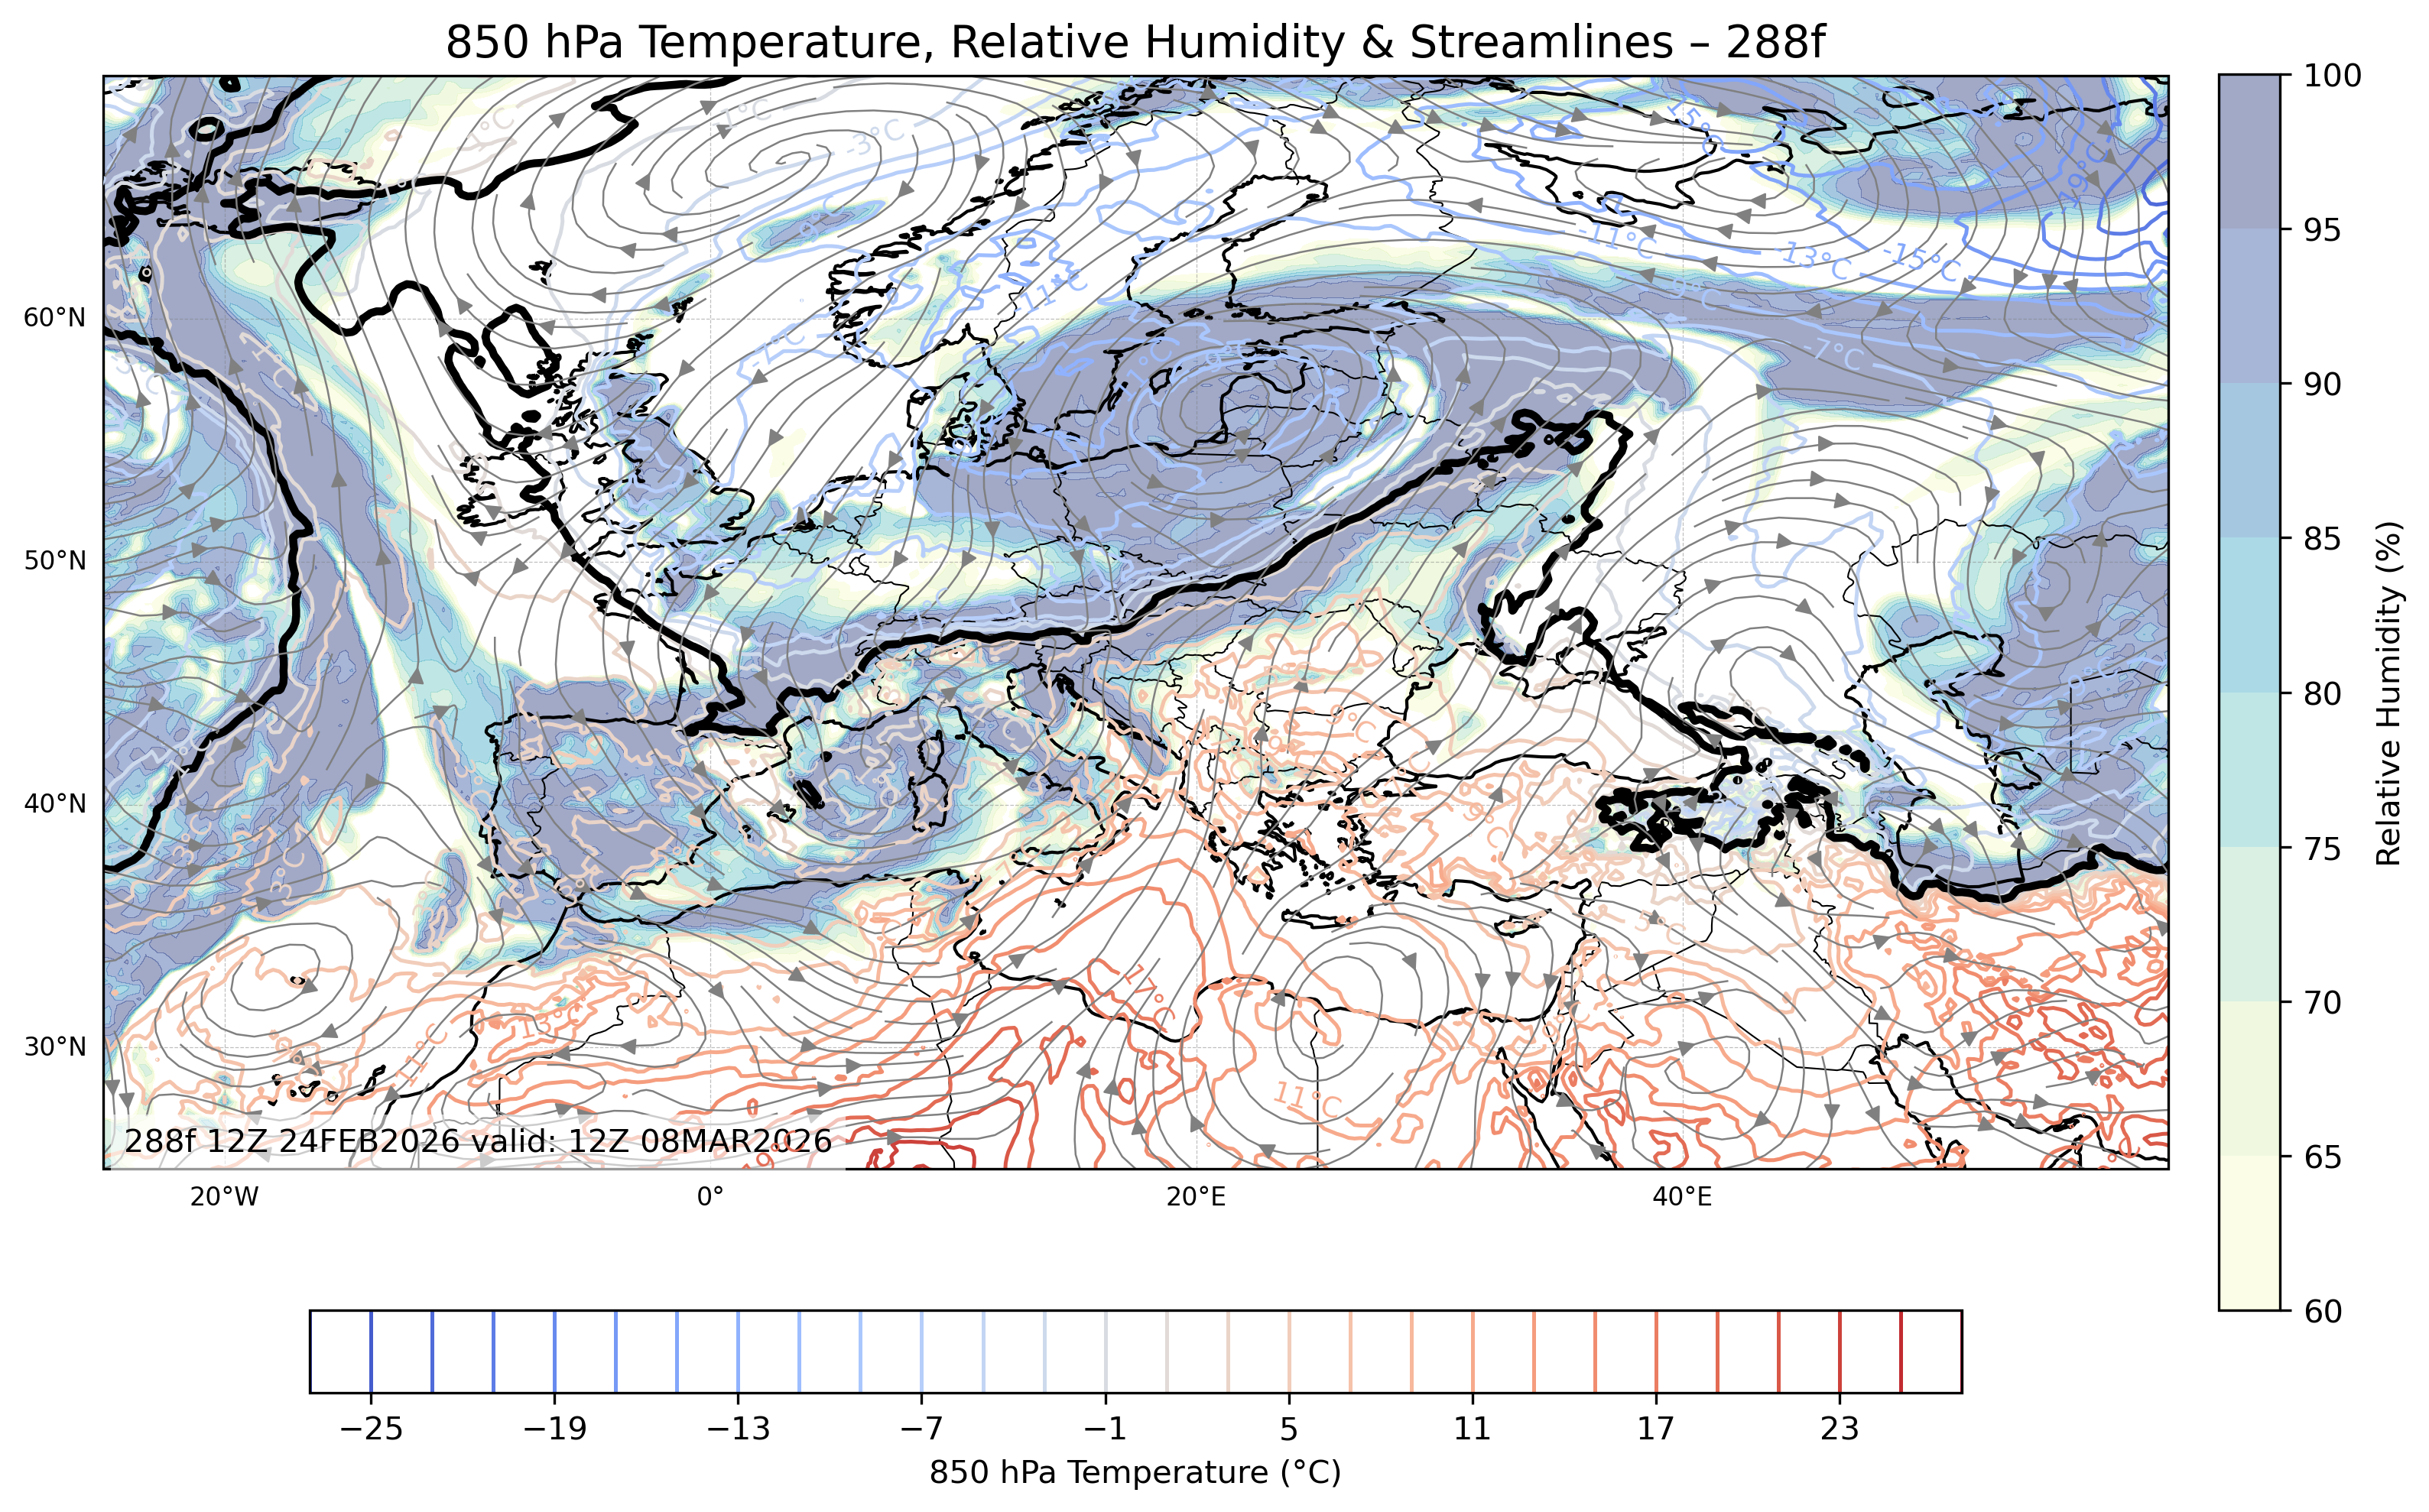
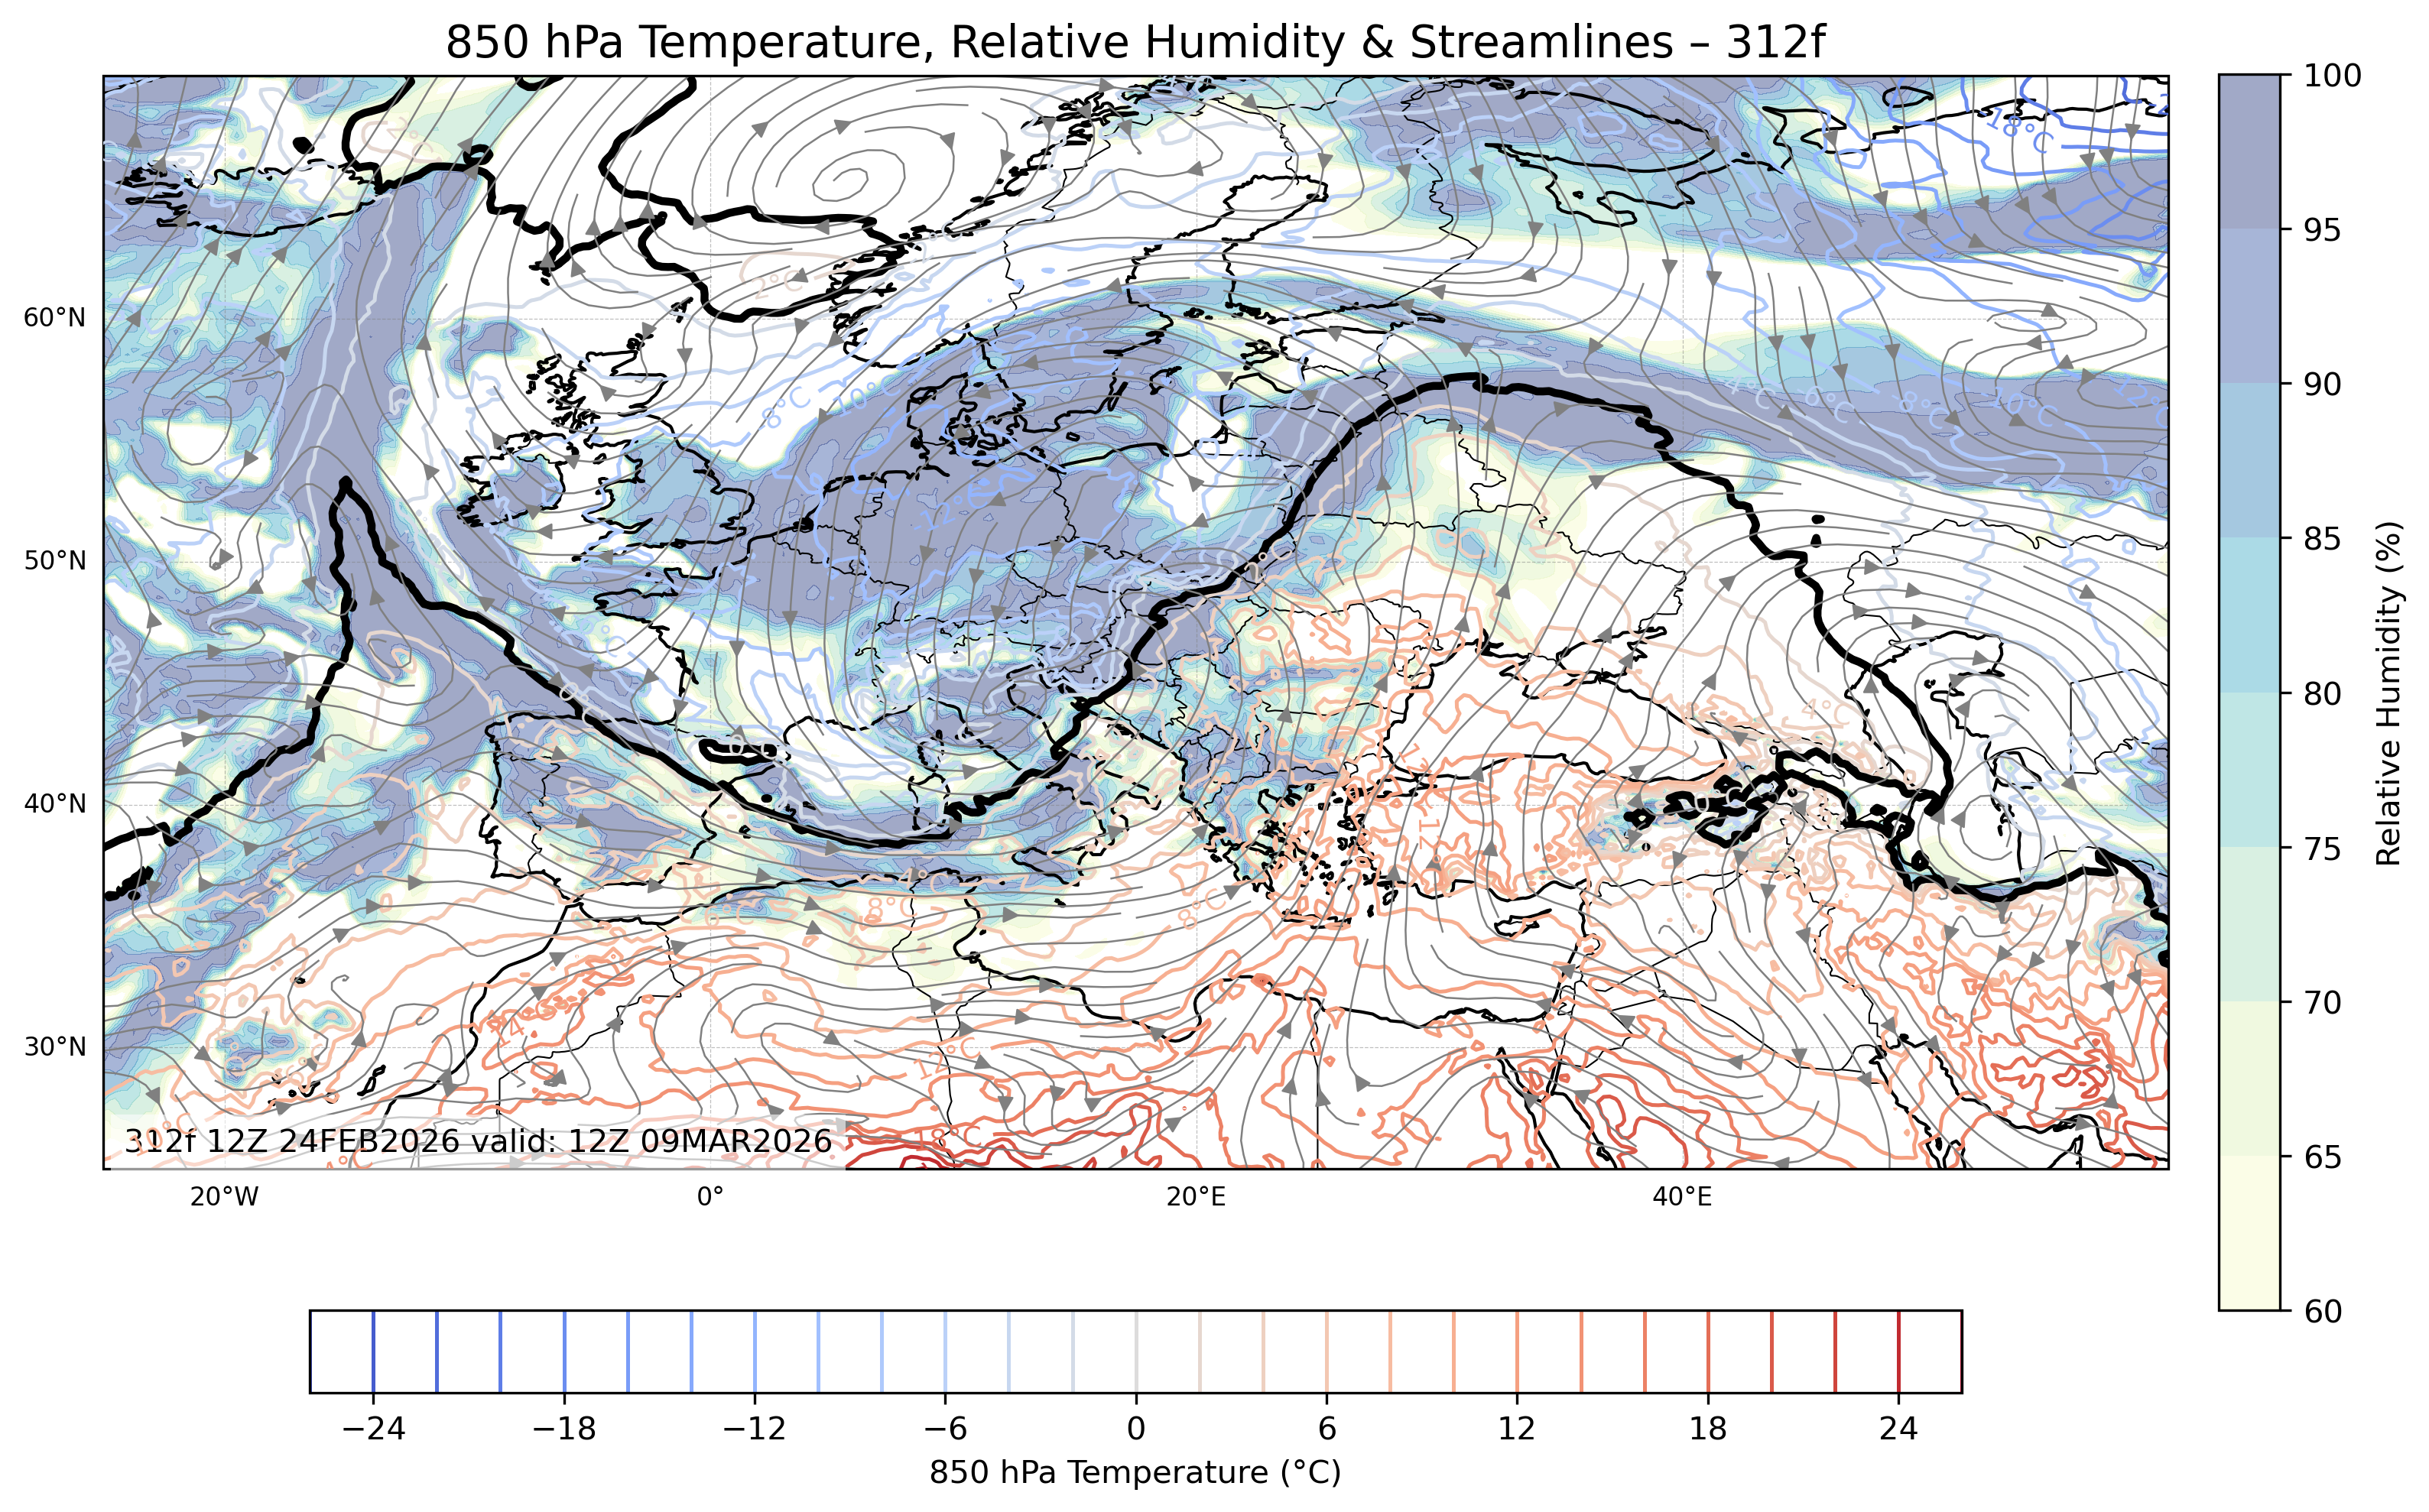
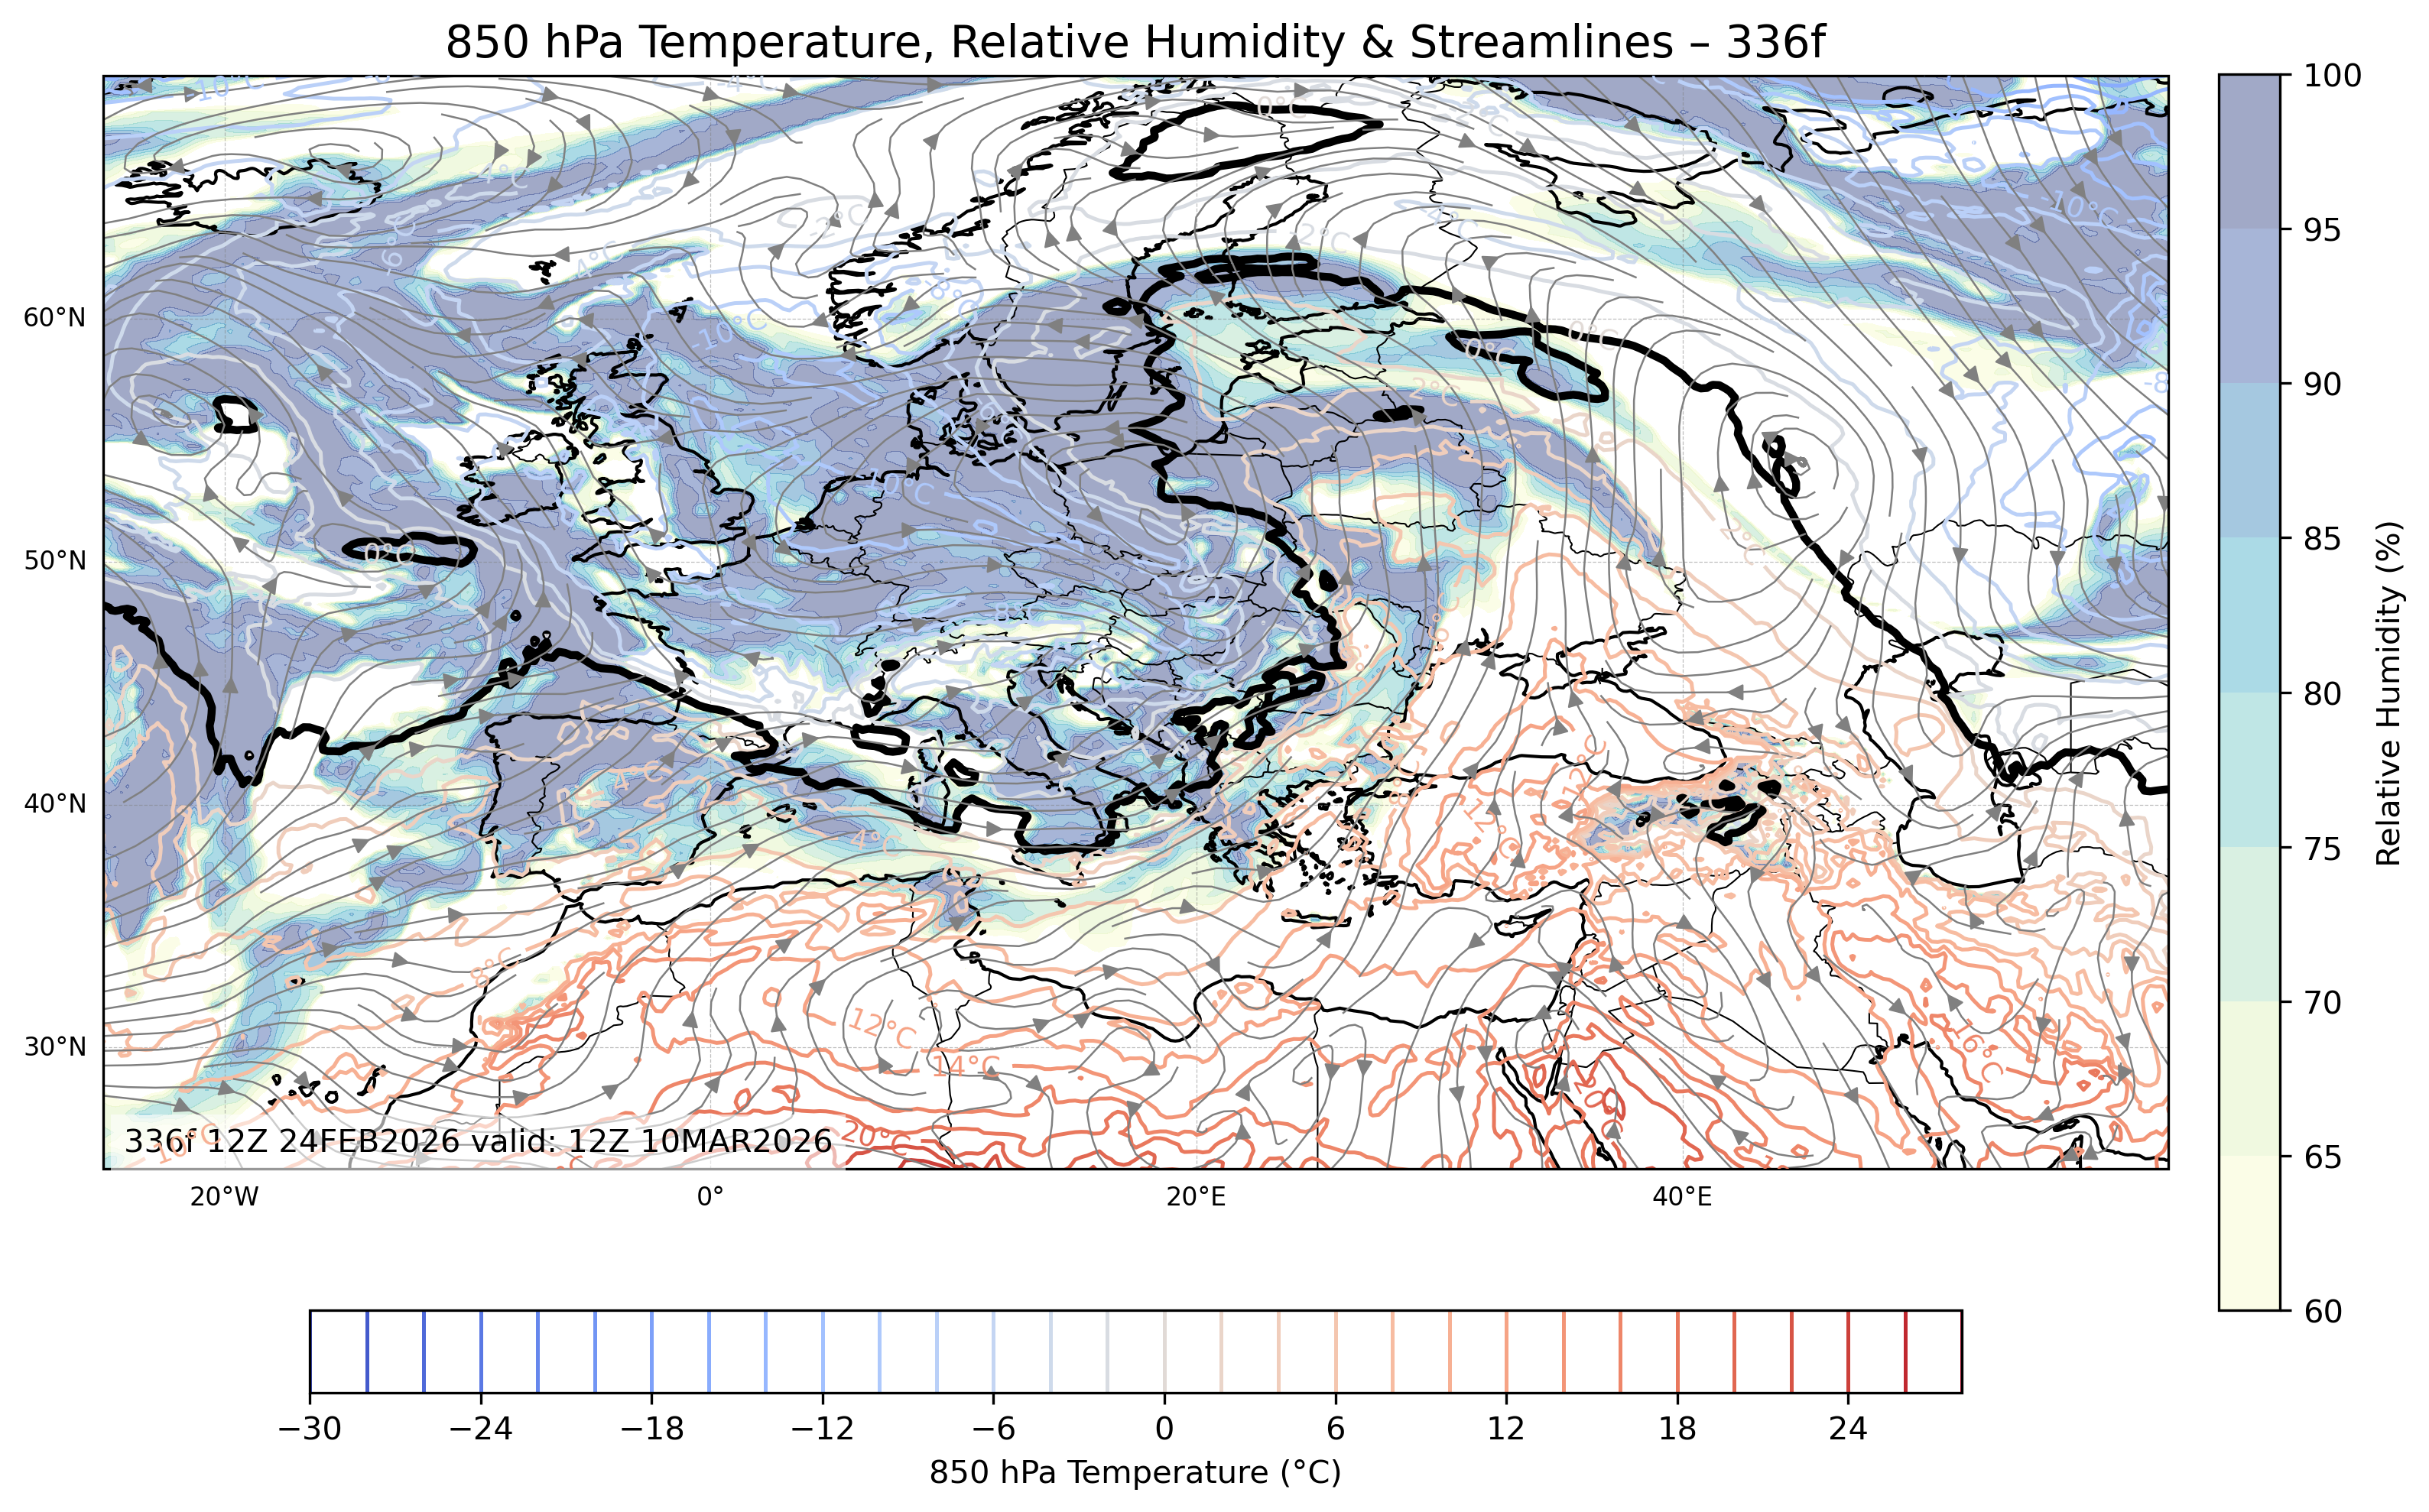
850mb Temperature, Relative Humidity & Winds
At 850mb, meteorologists monitor temperature, relative humidity, and wind flow to assess low-level thermodynamic conditions. This layer provides critical information about warm air advection, moisture transport, and instability that can trigger convective activity. The 24h to 72h forecast maps allow users to evaluate evolving weather patterns near the surface.
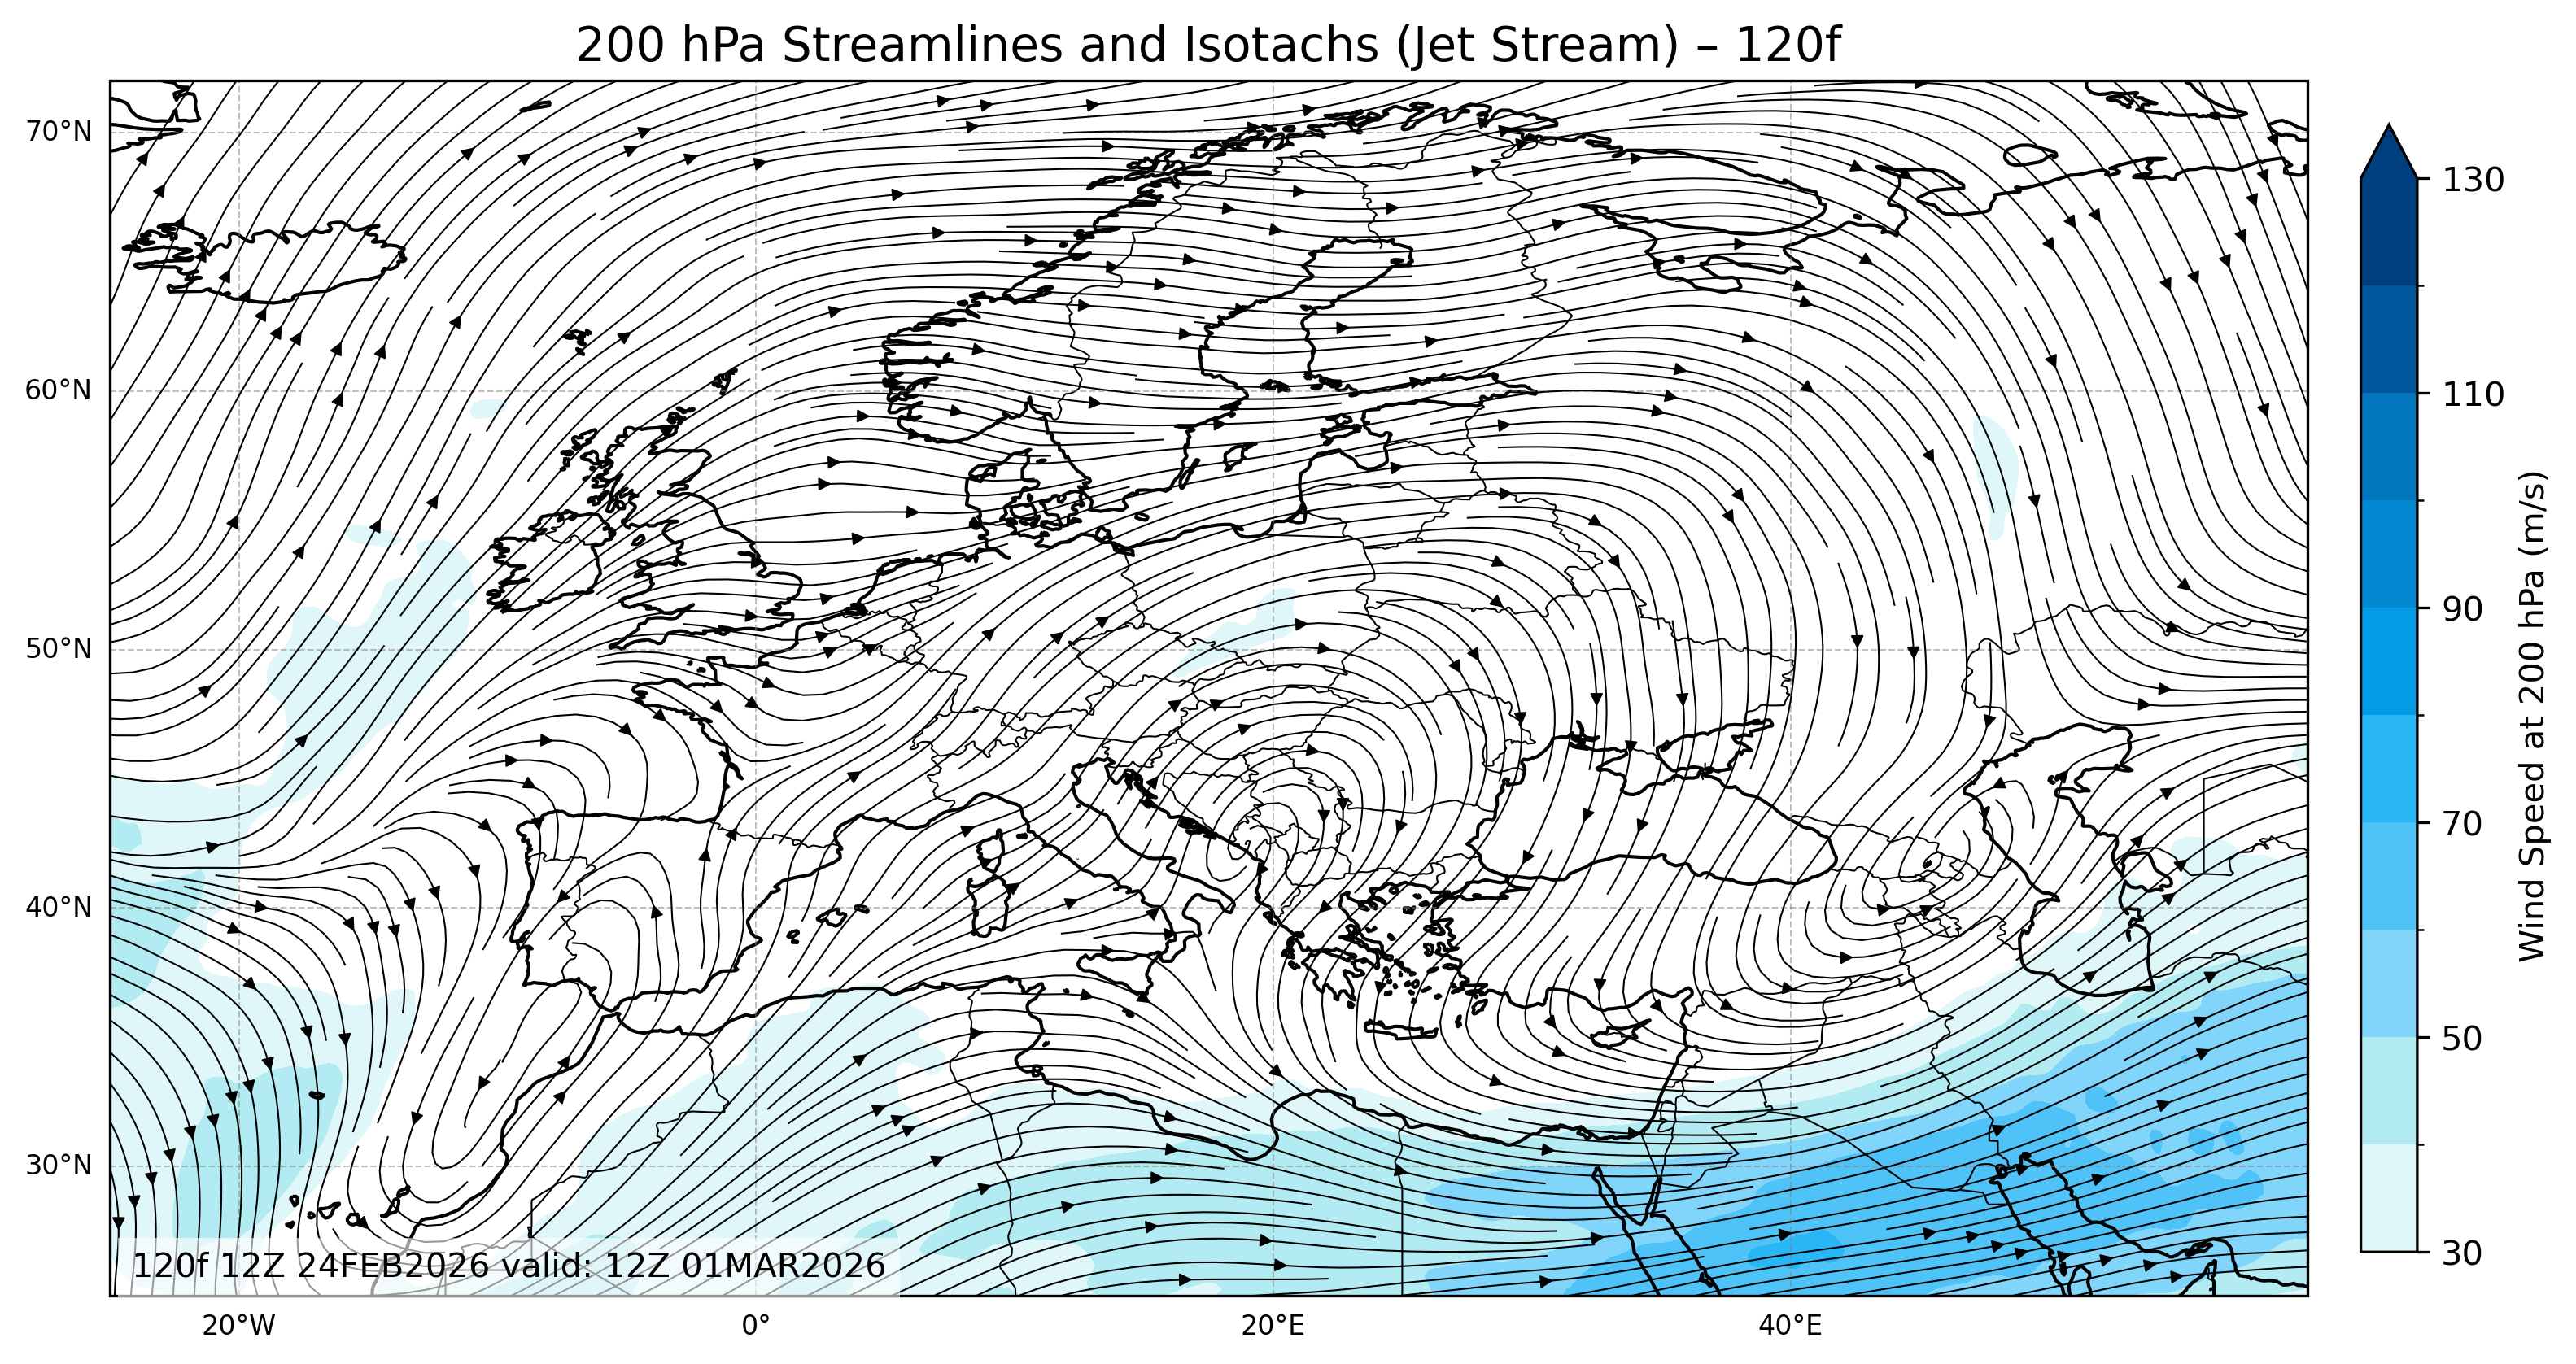
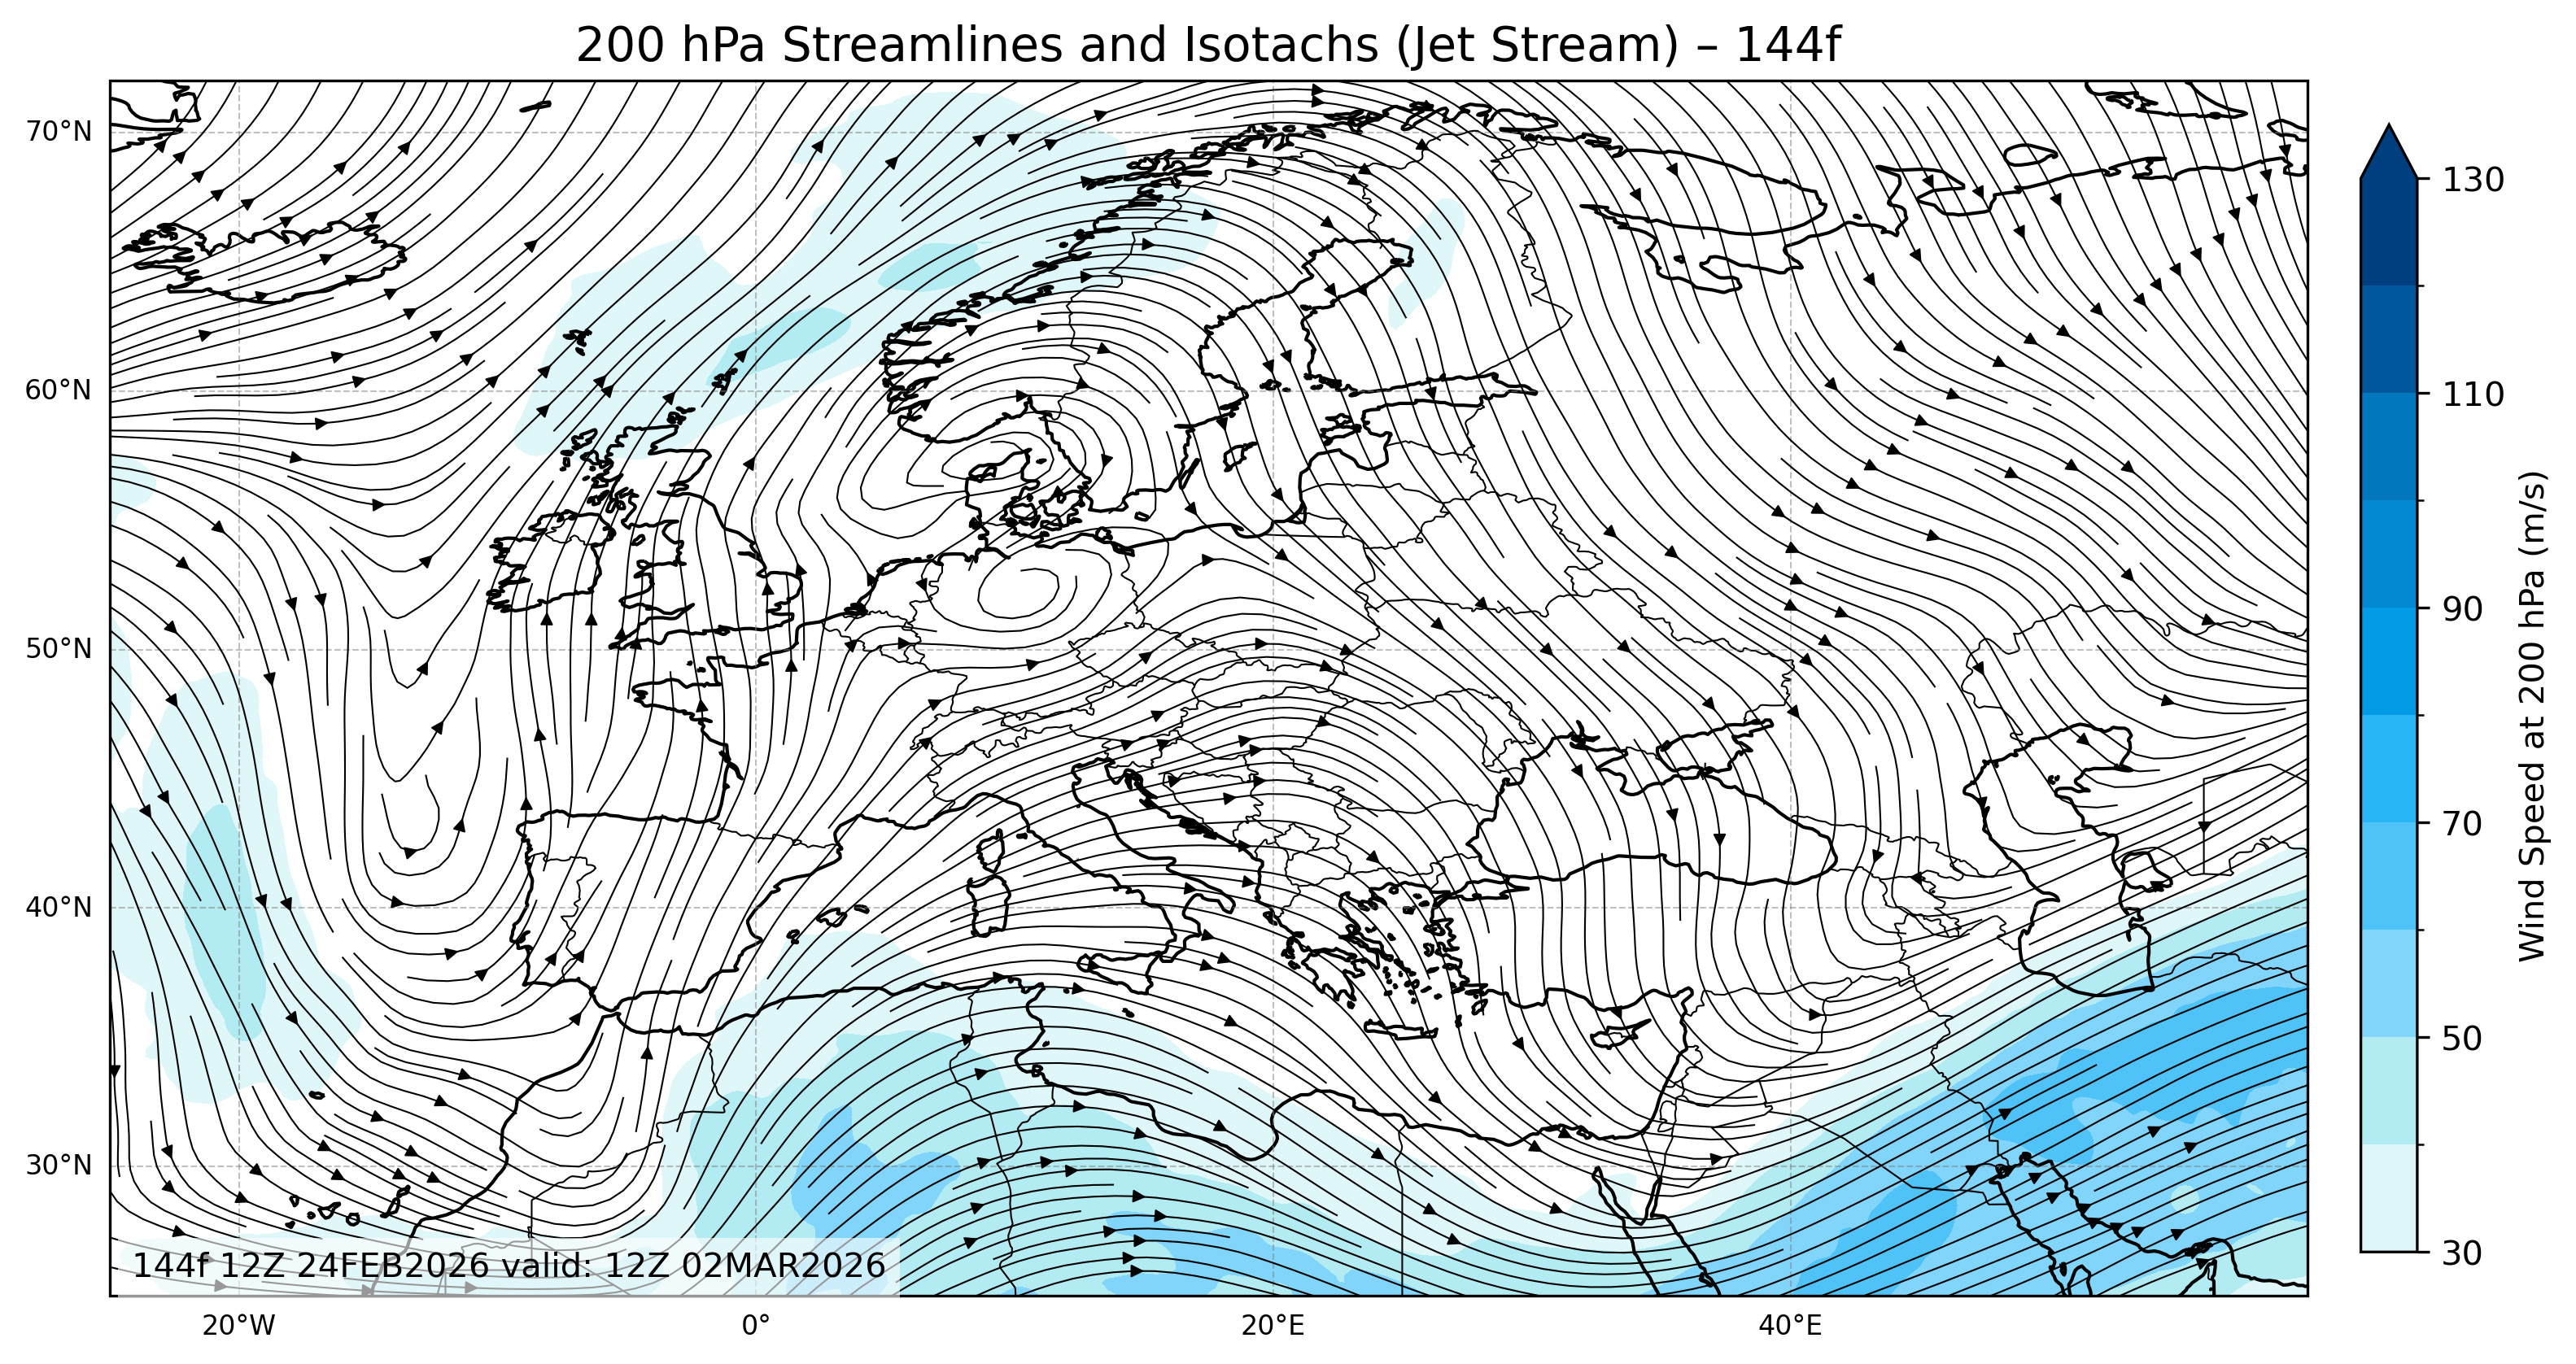
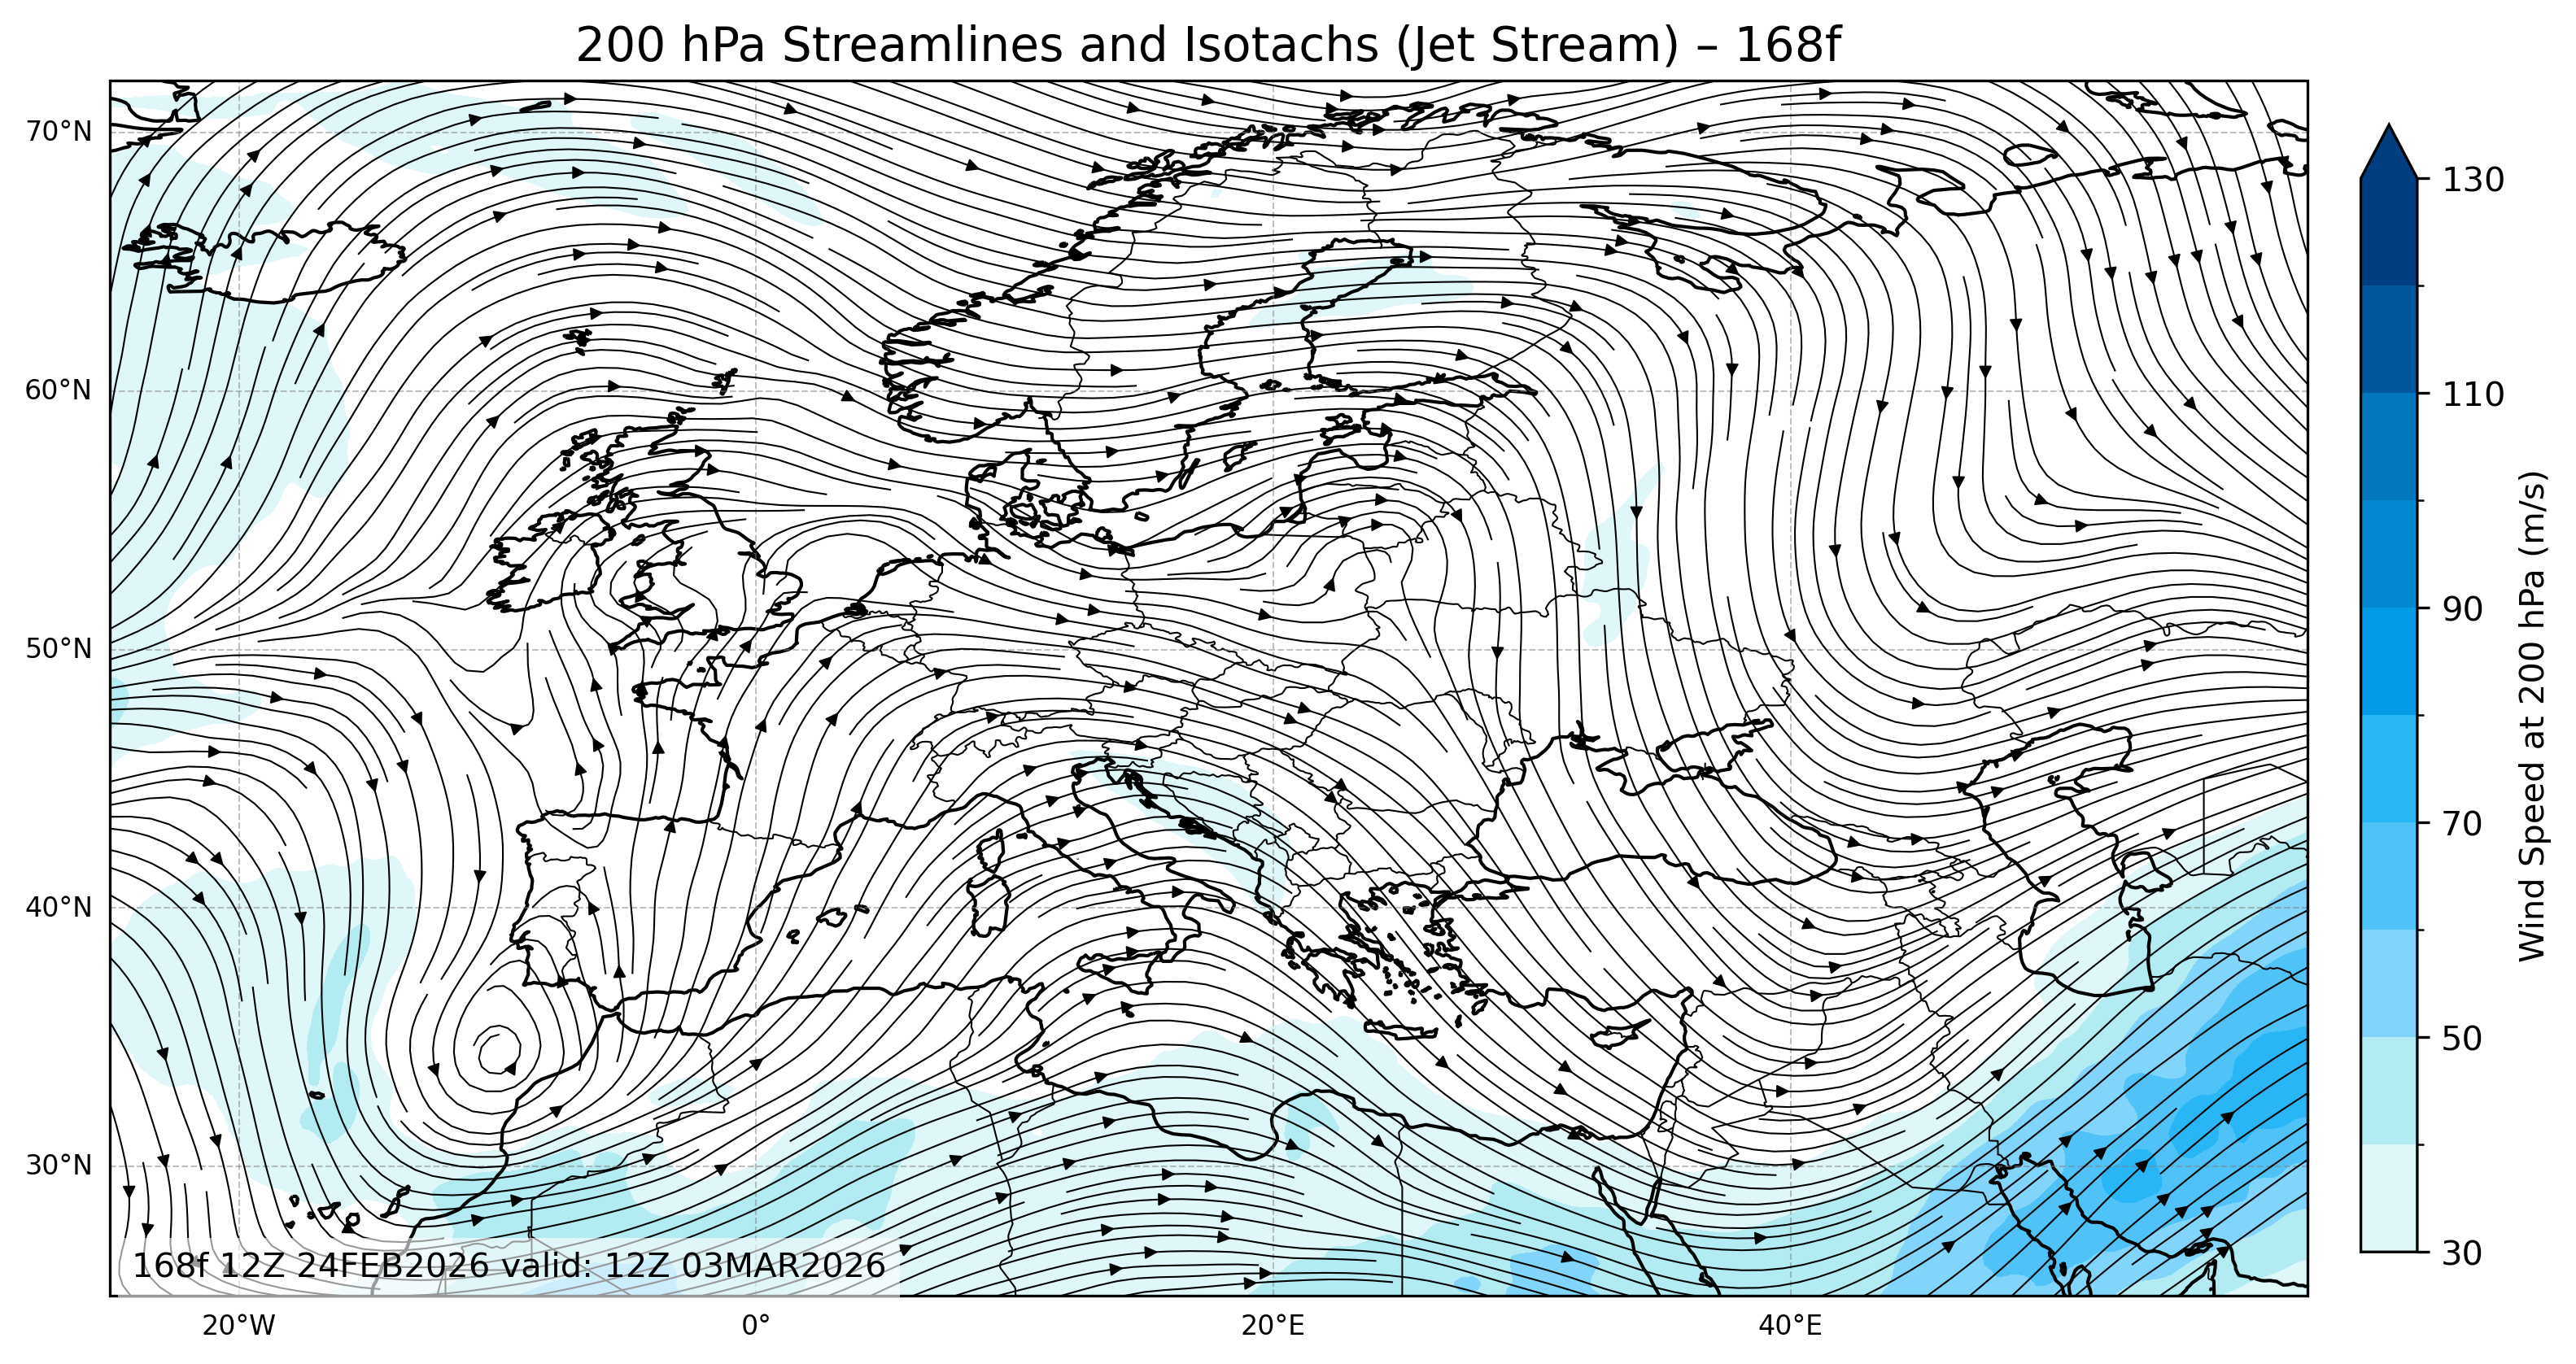
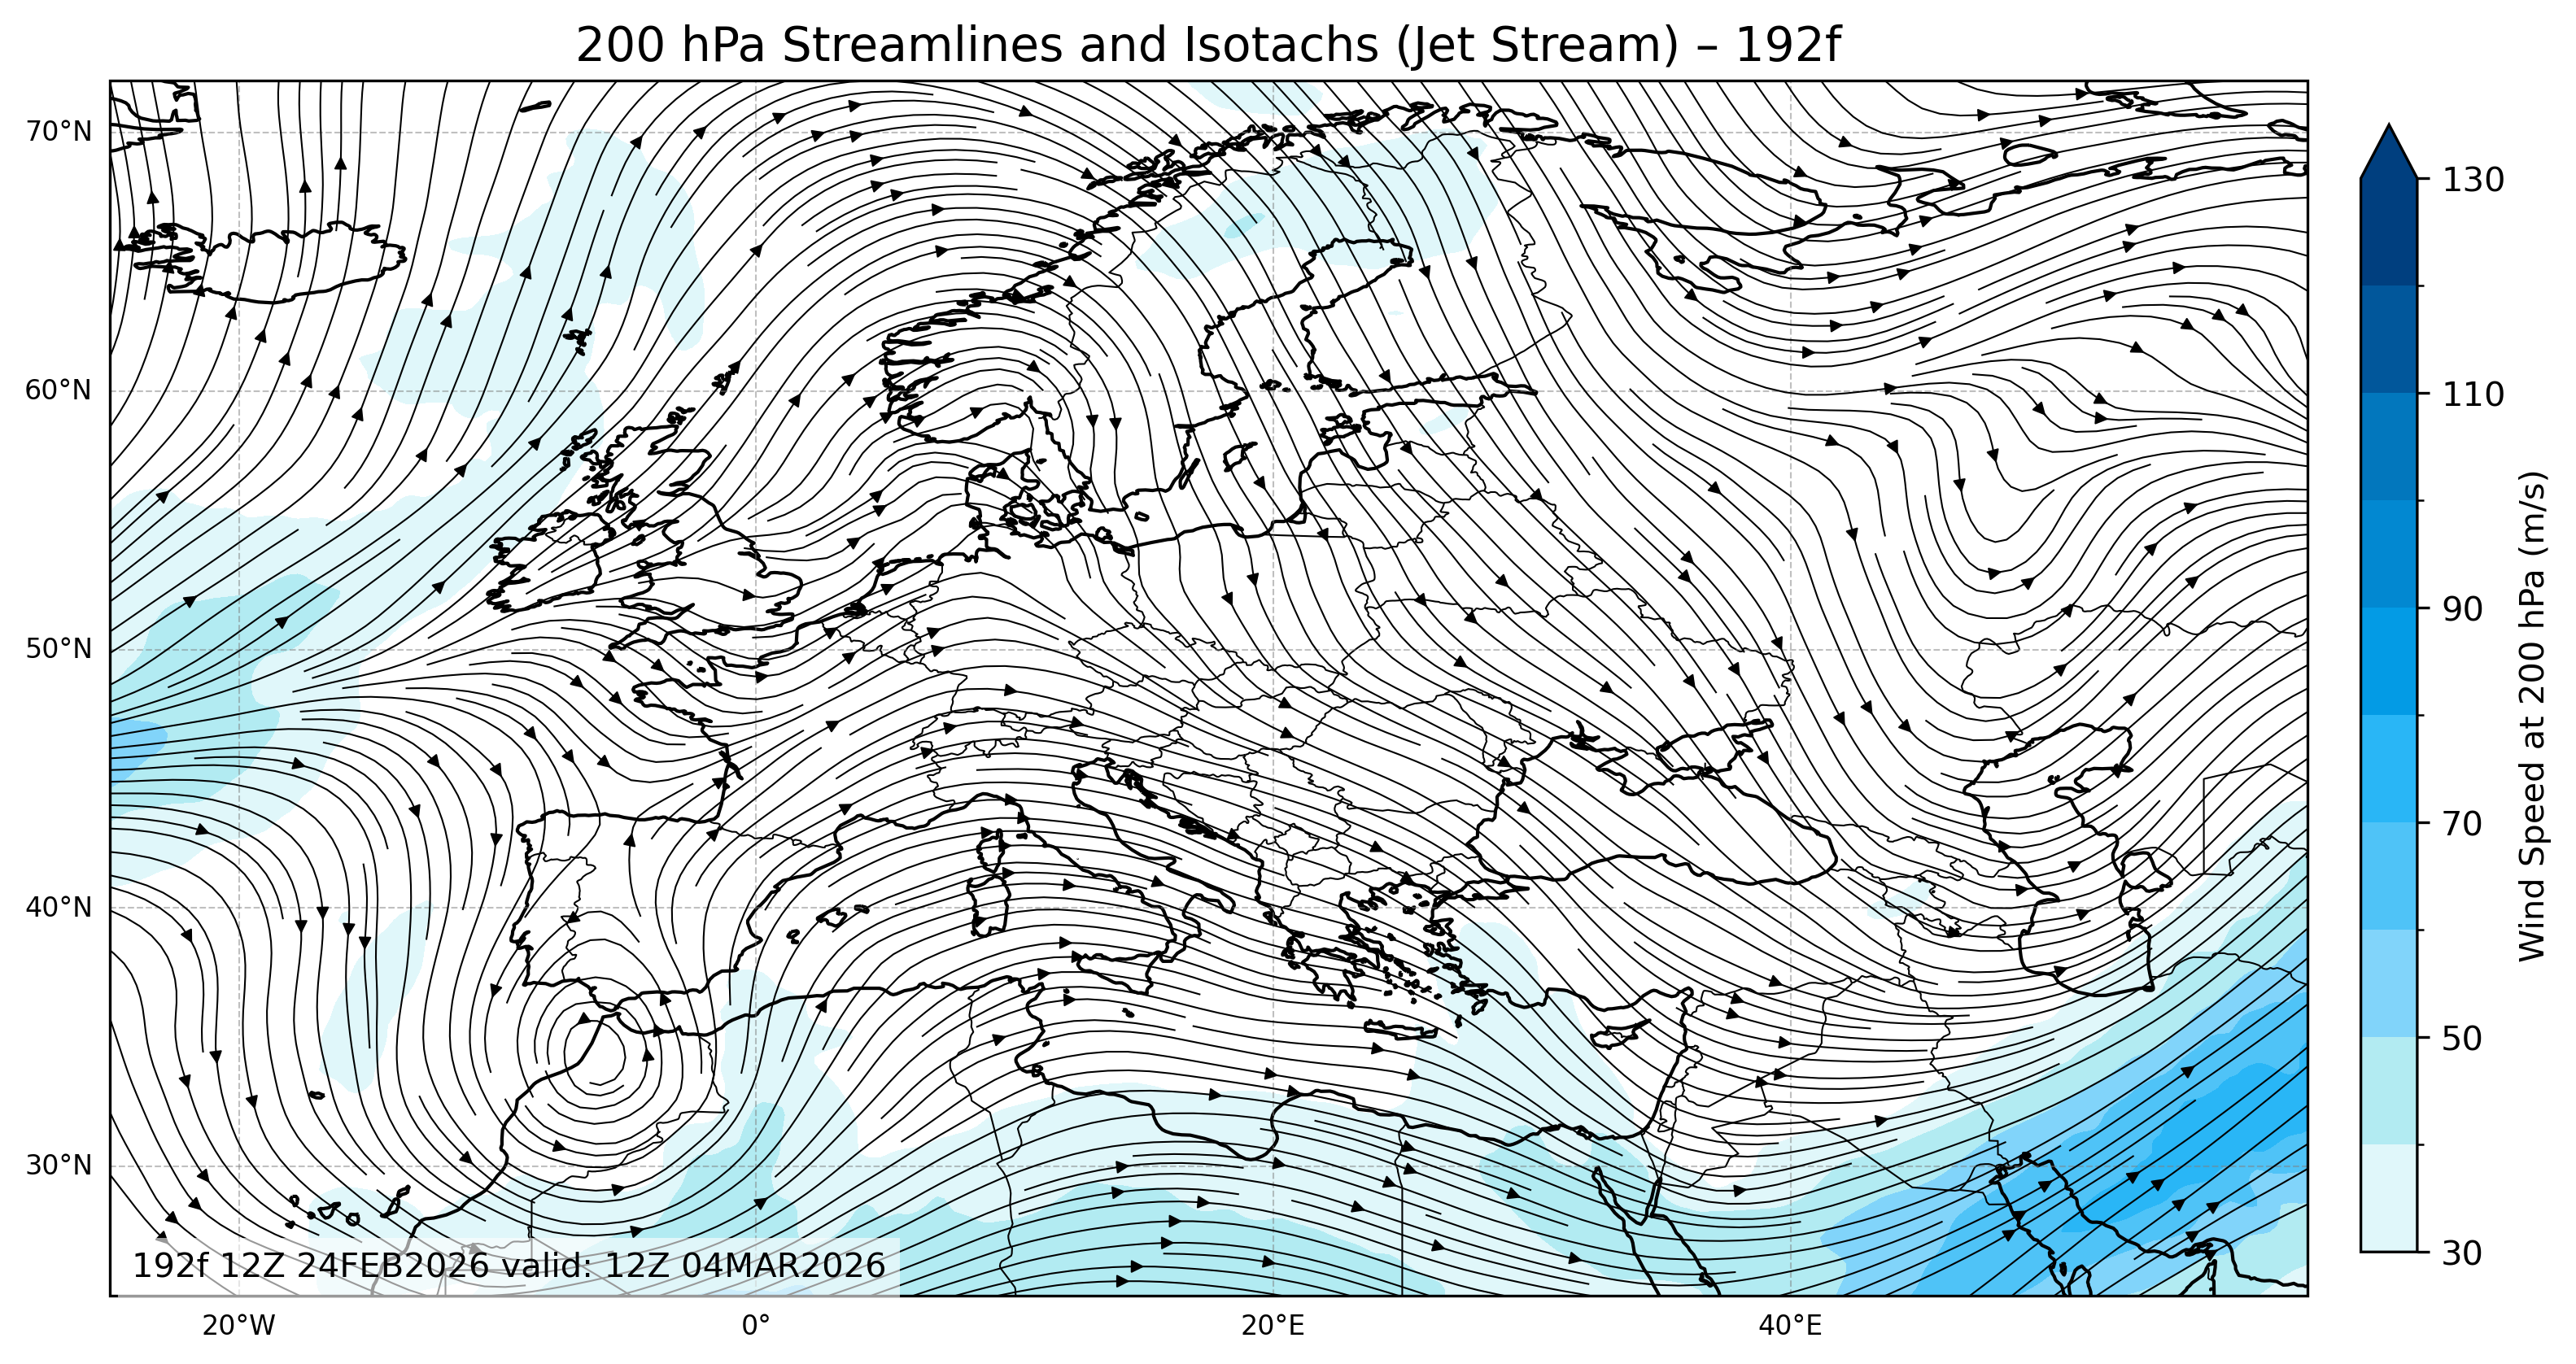
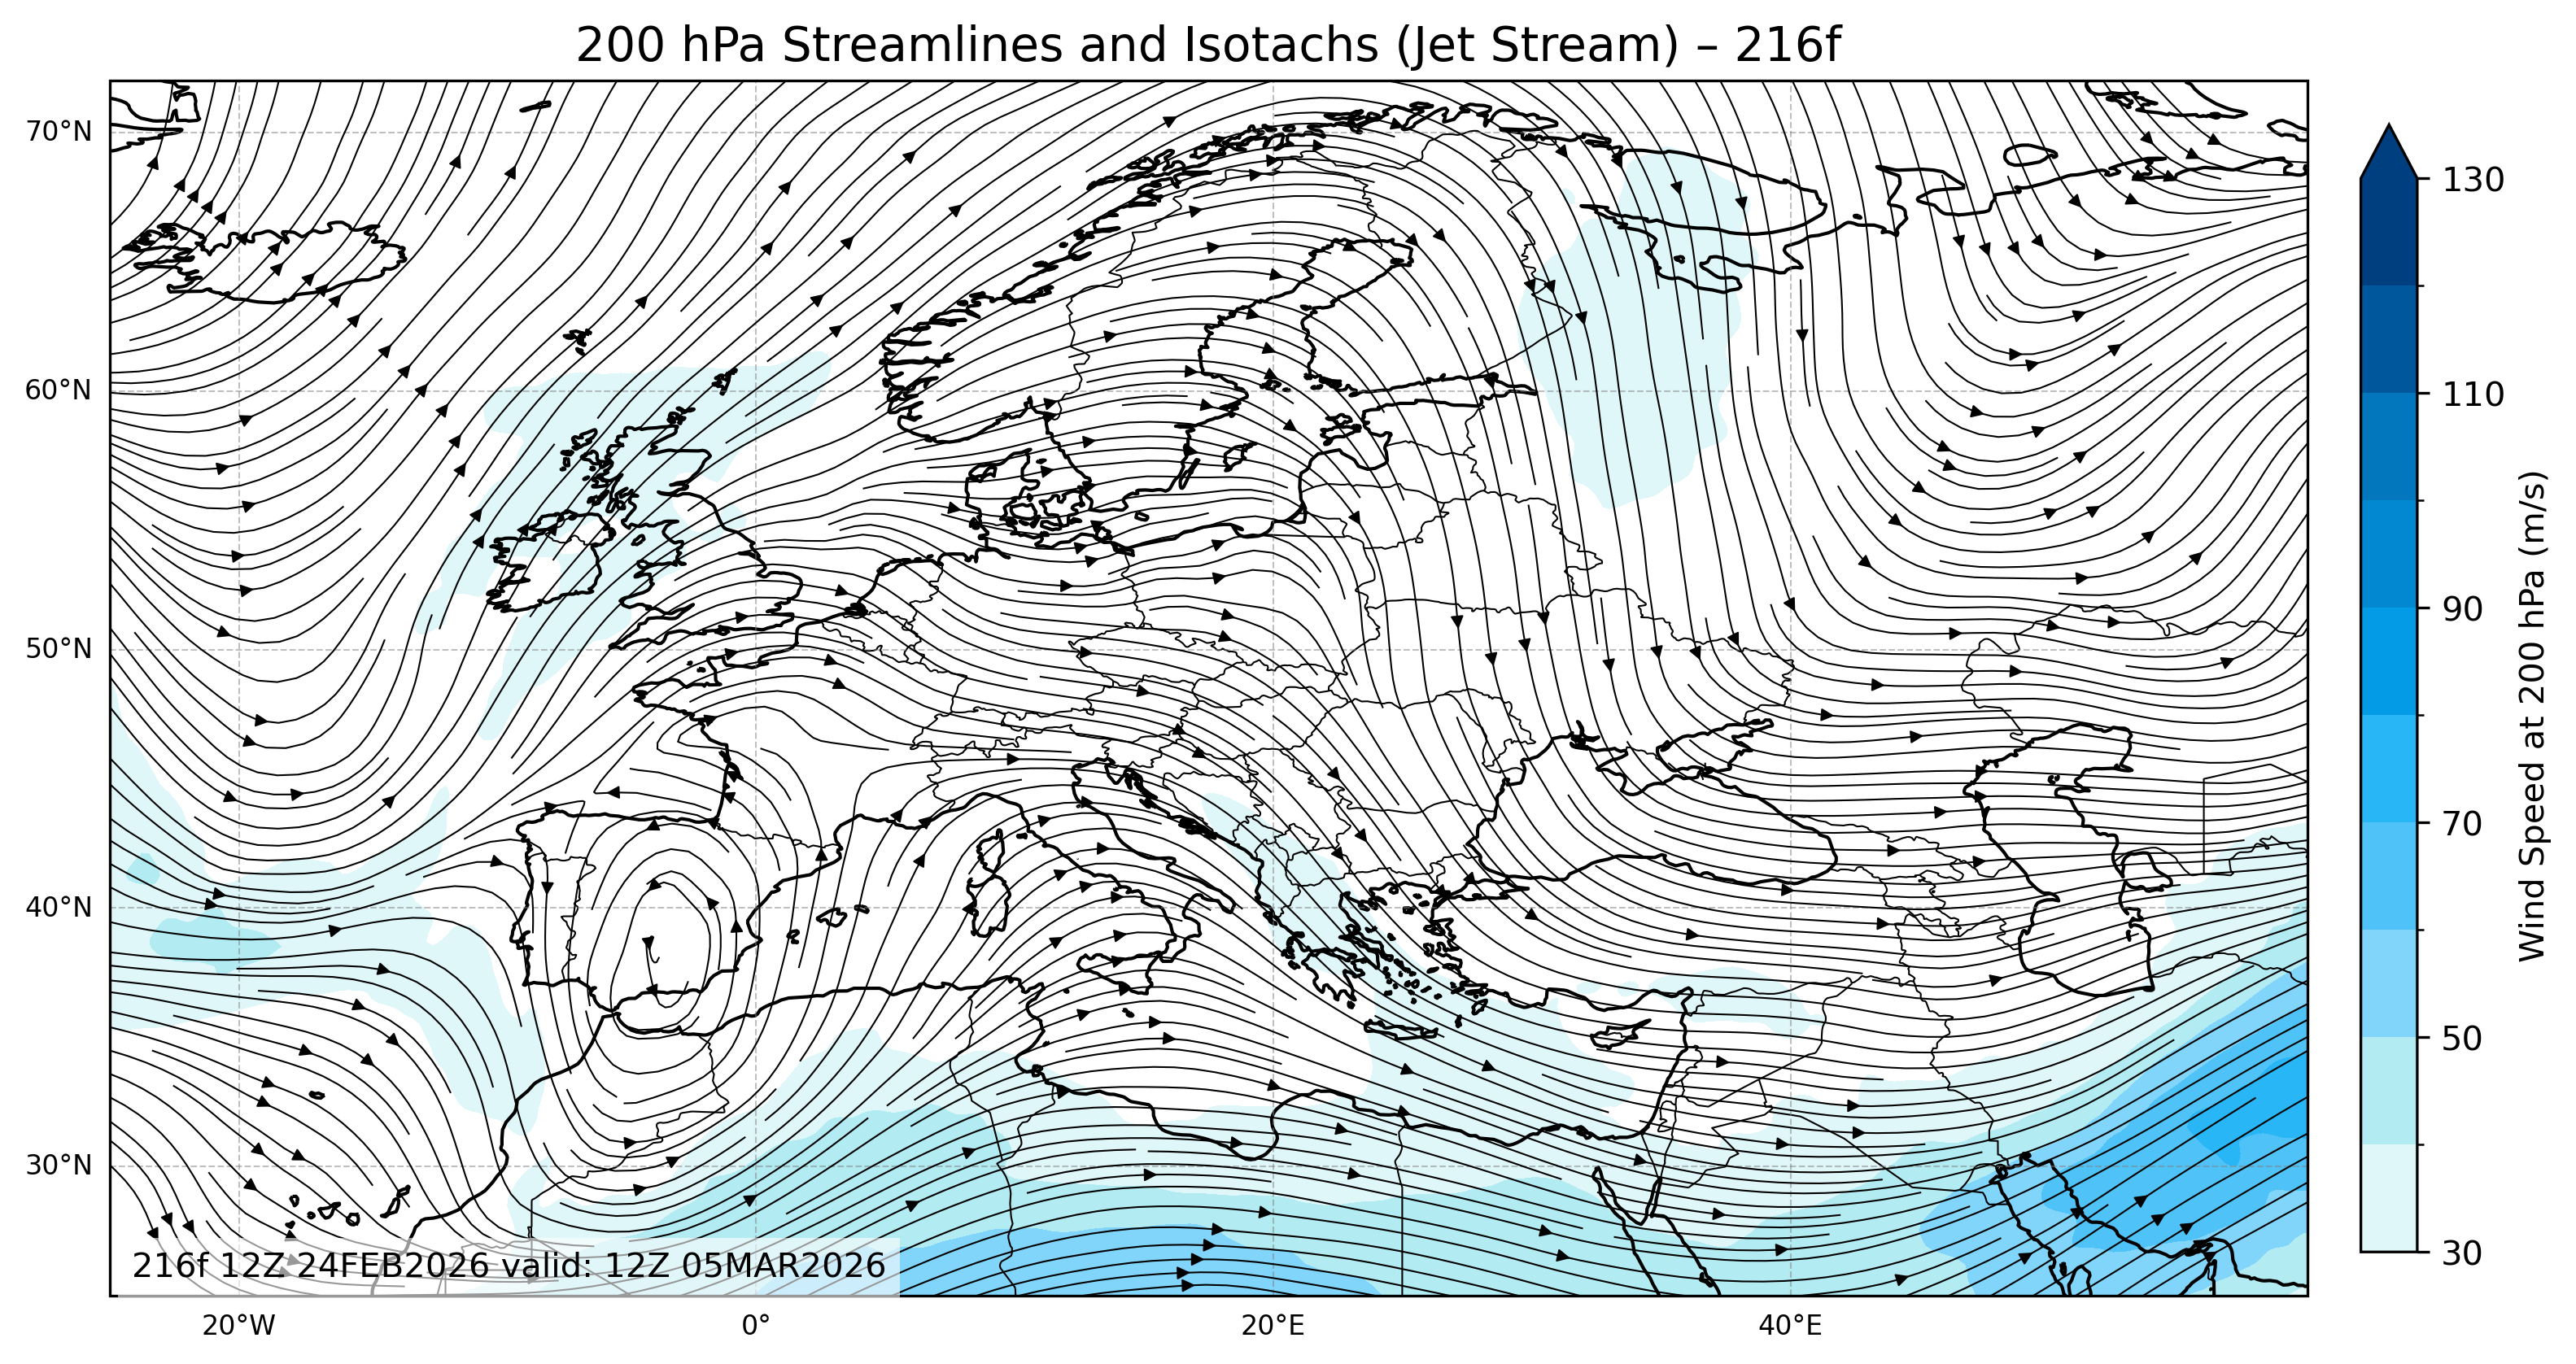
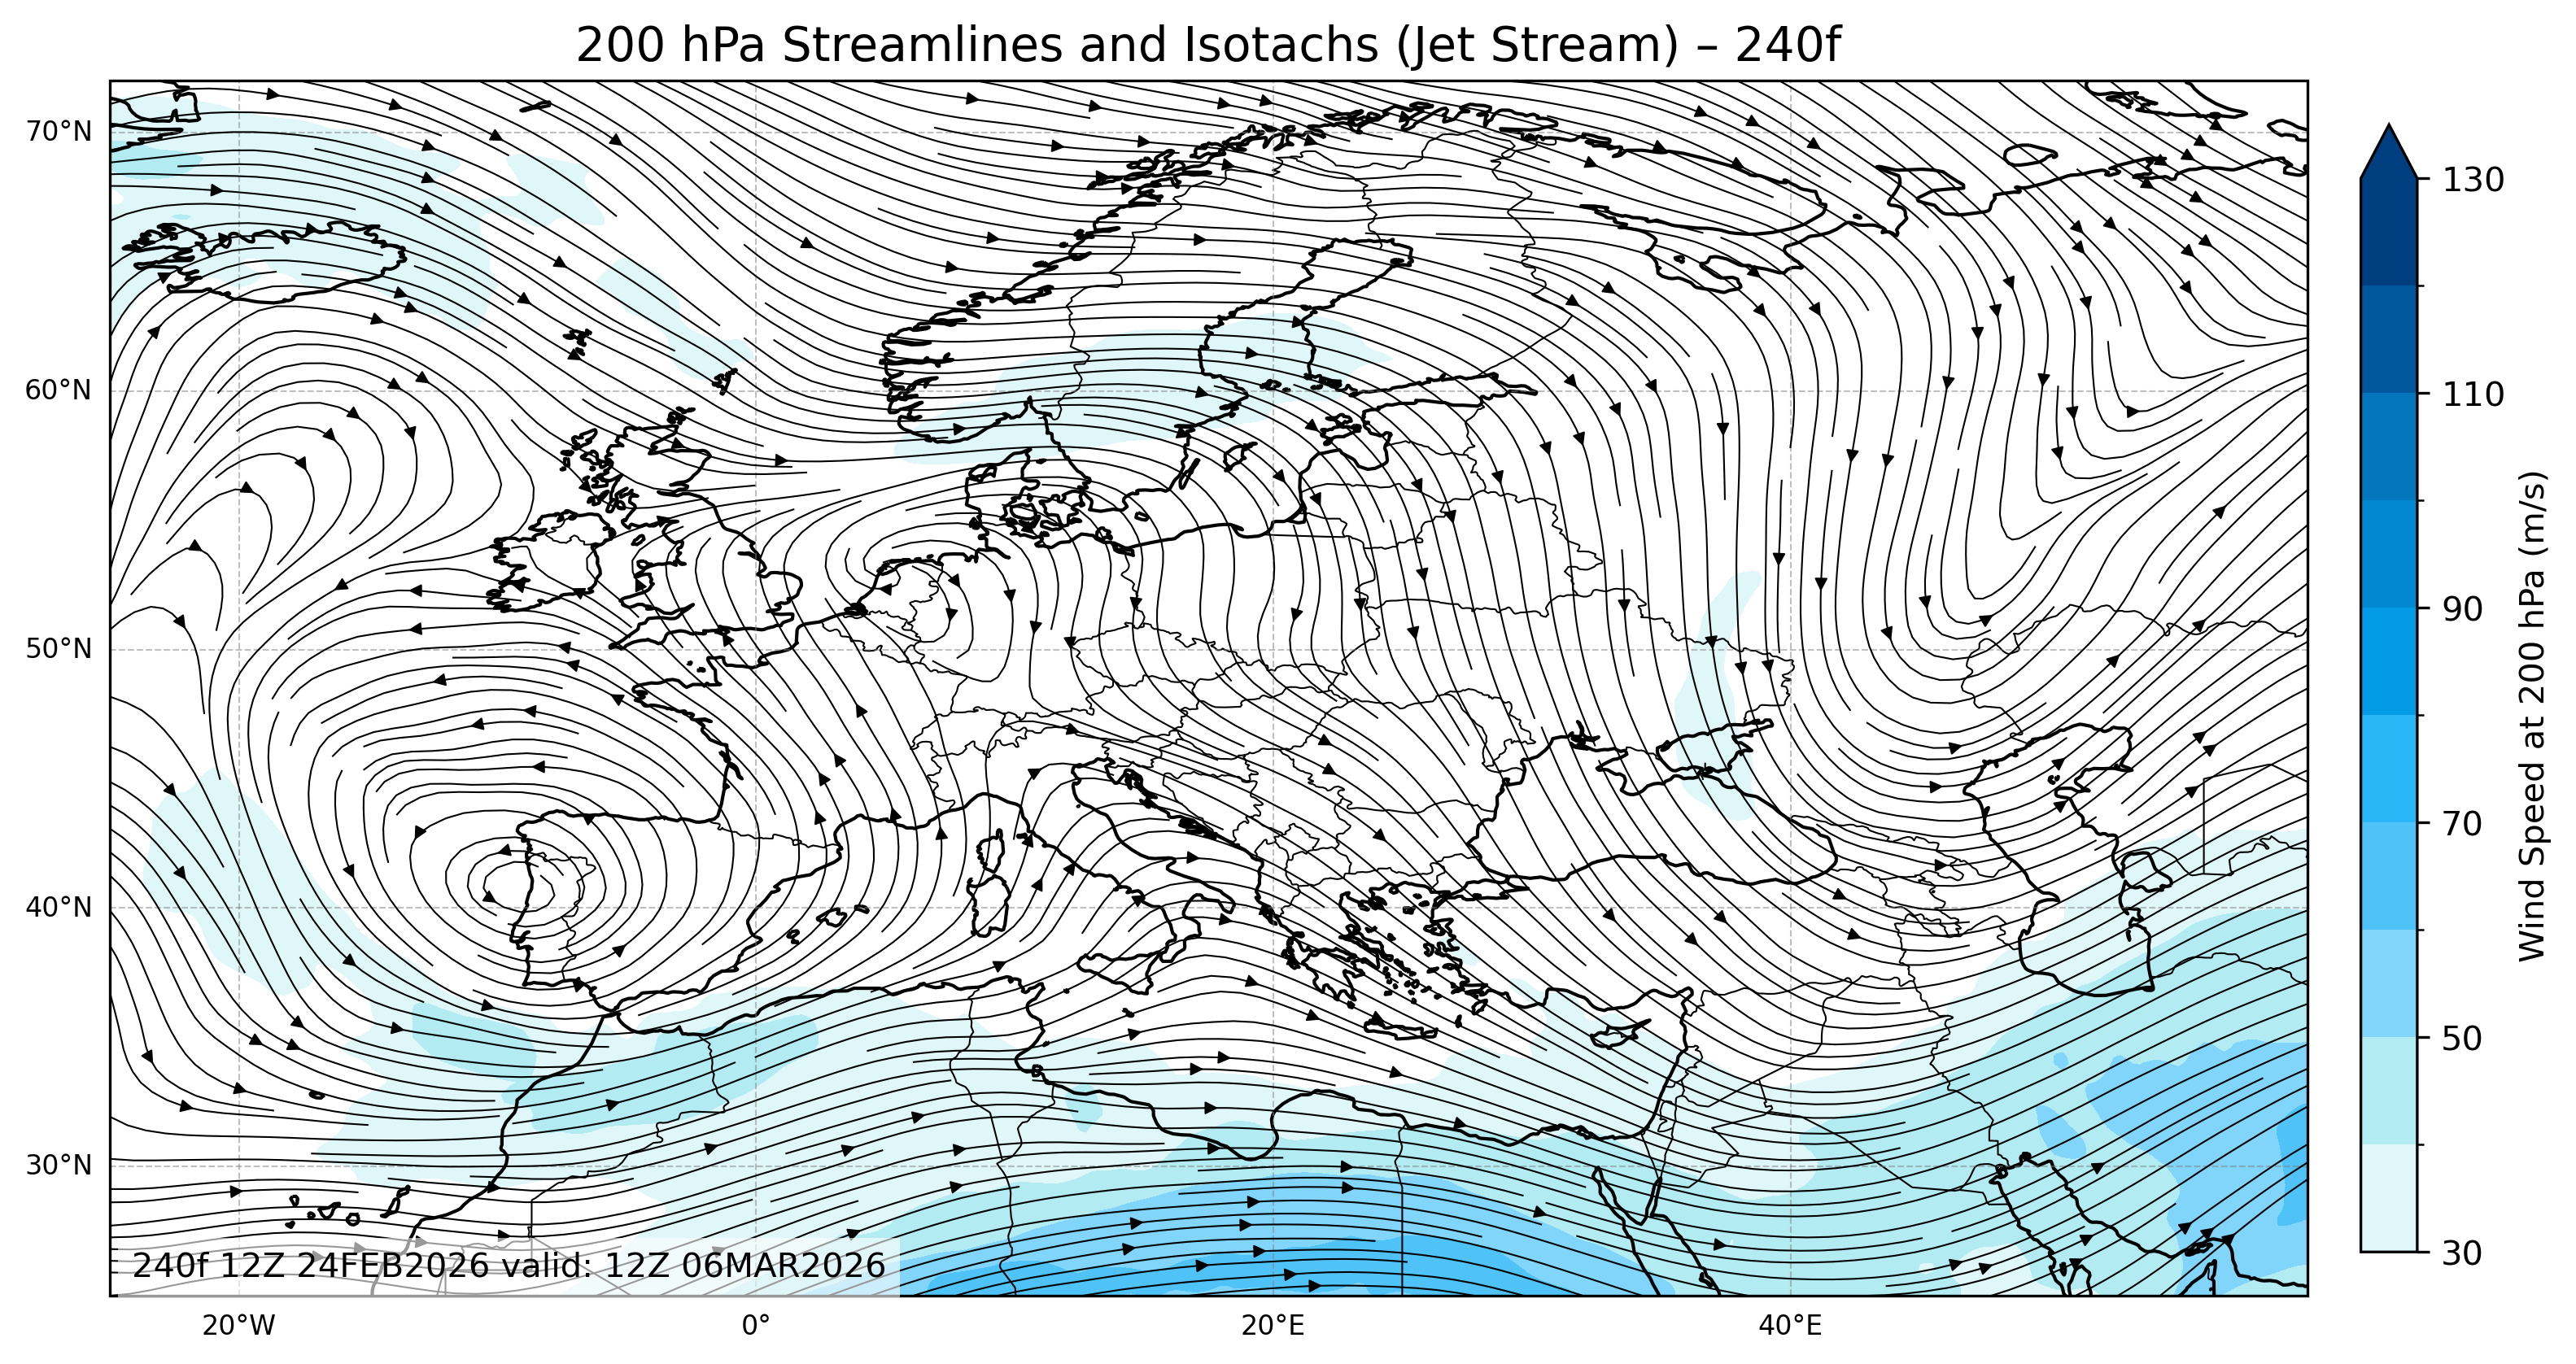
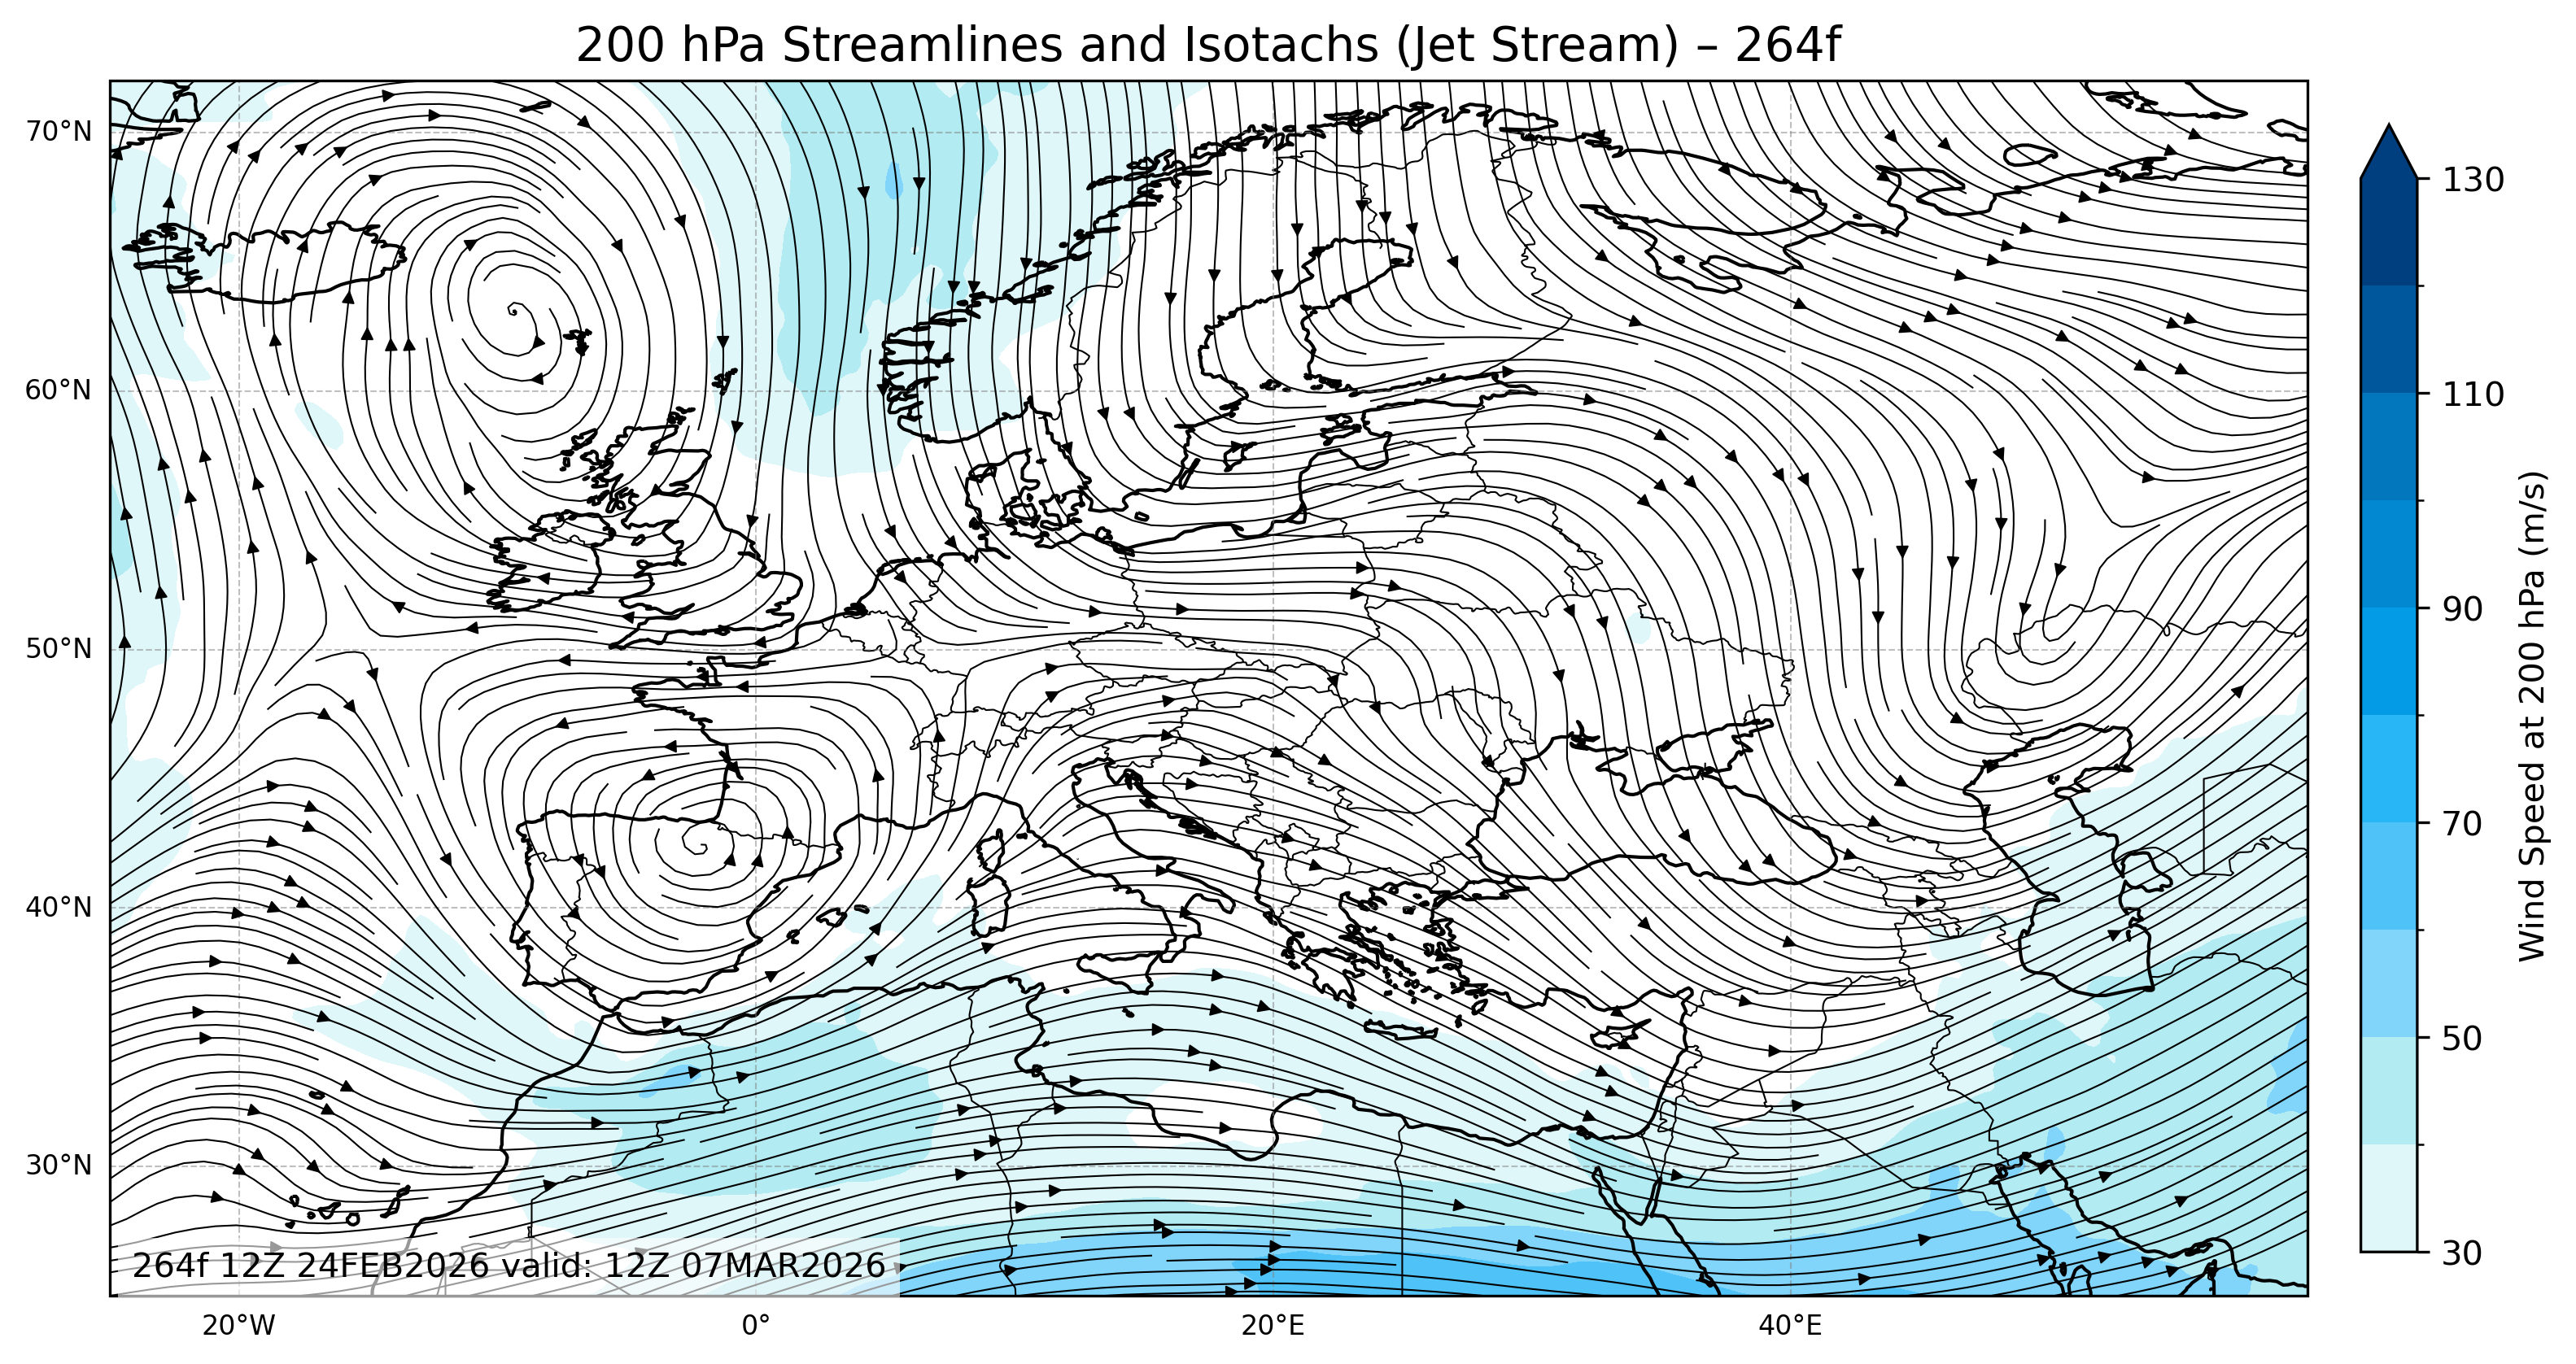
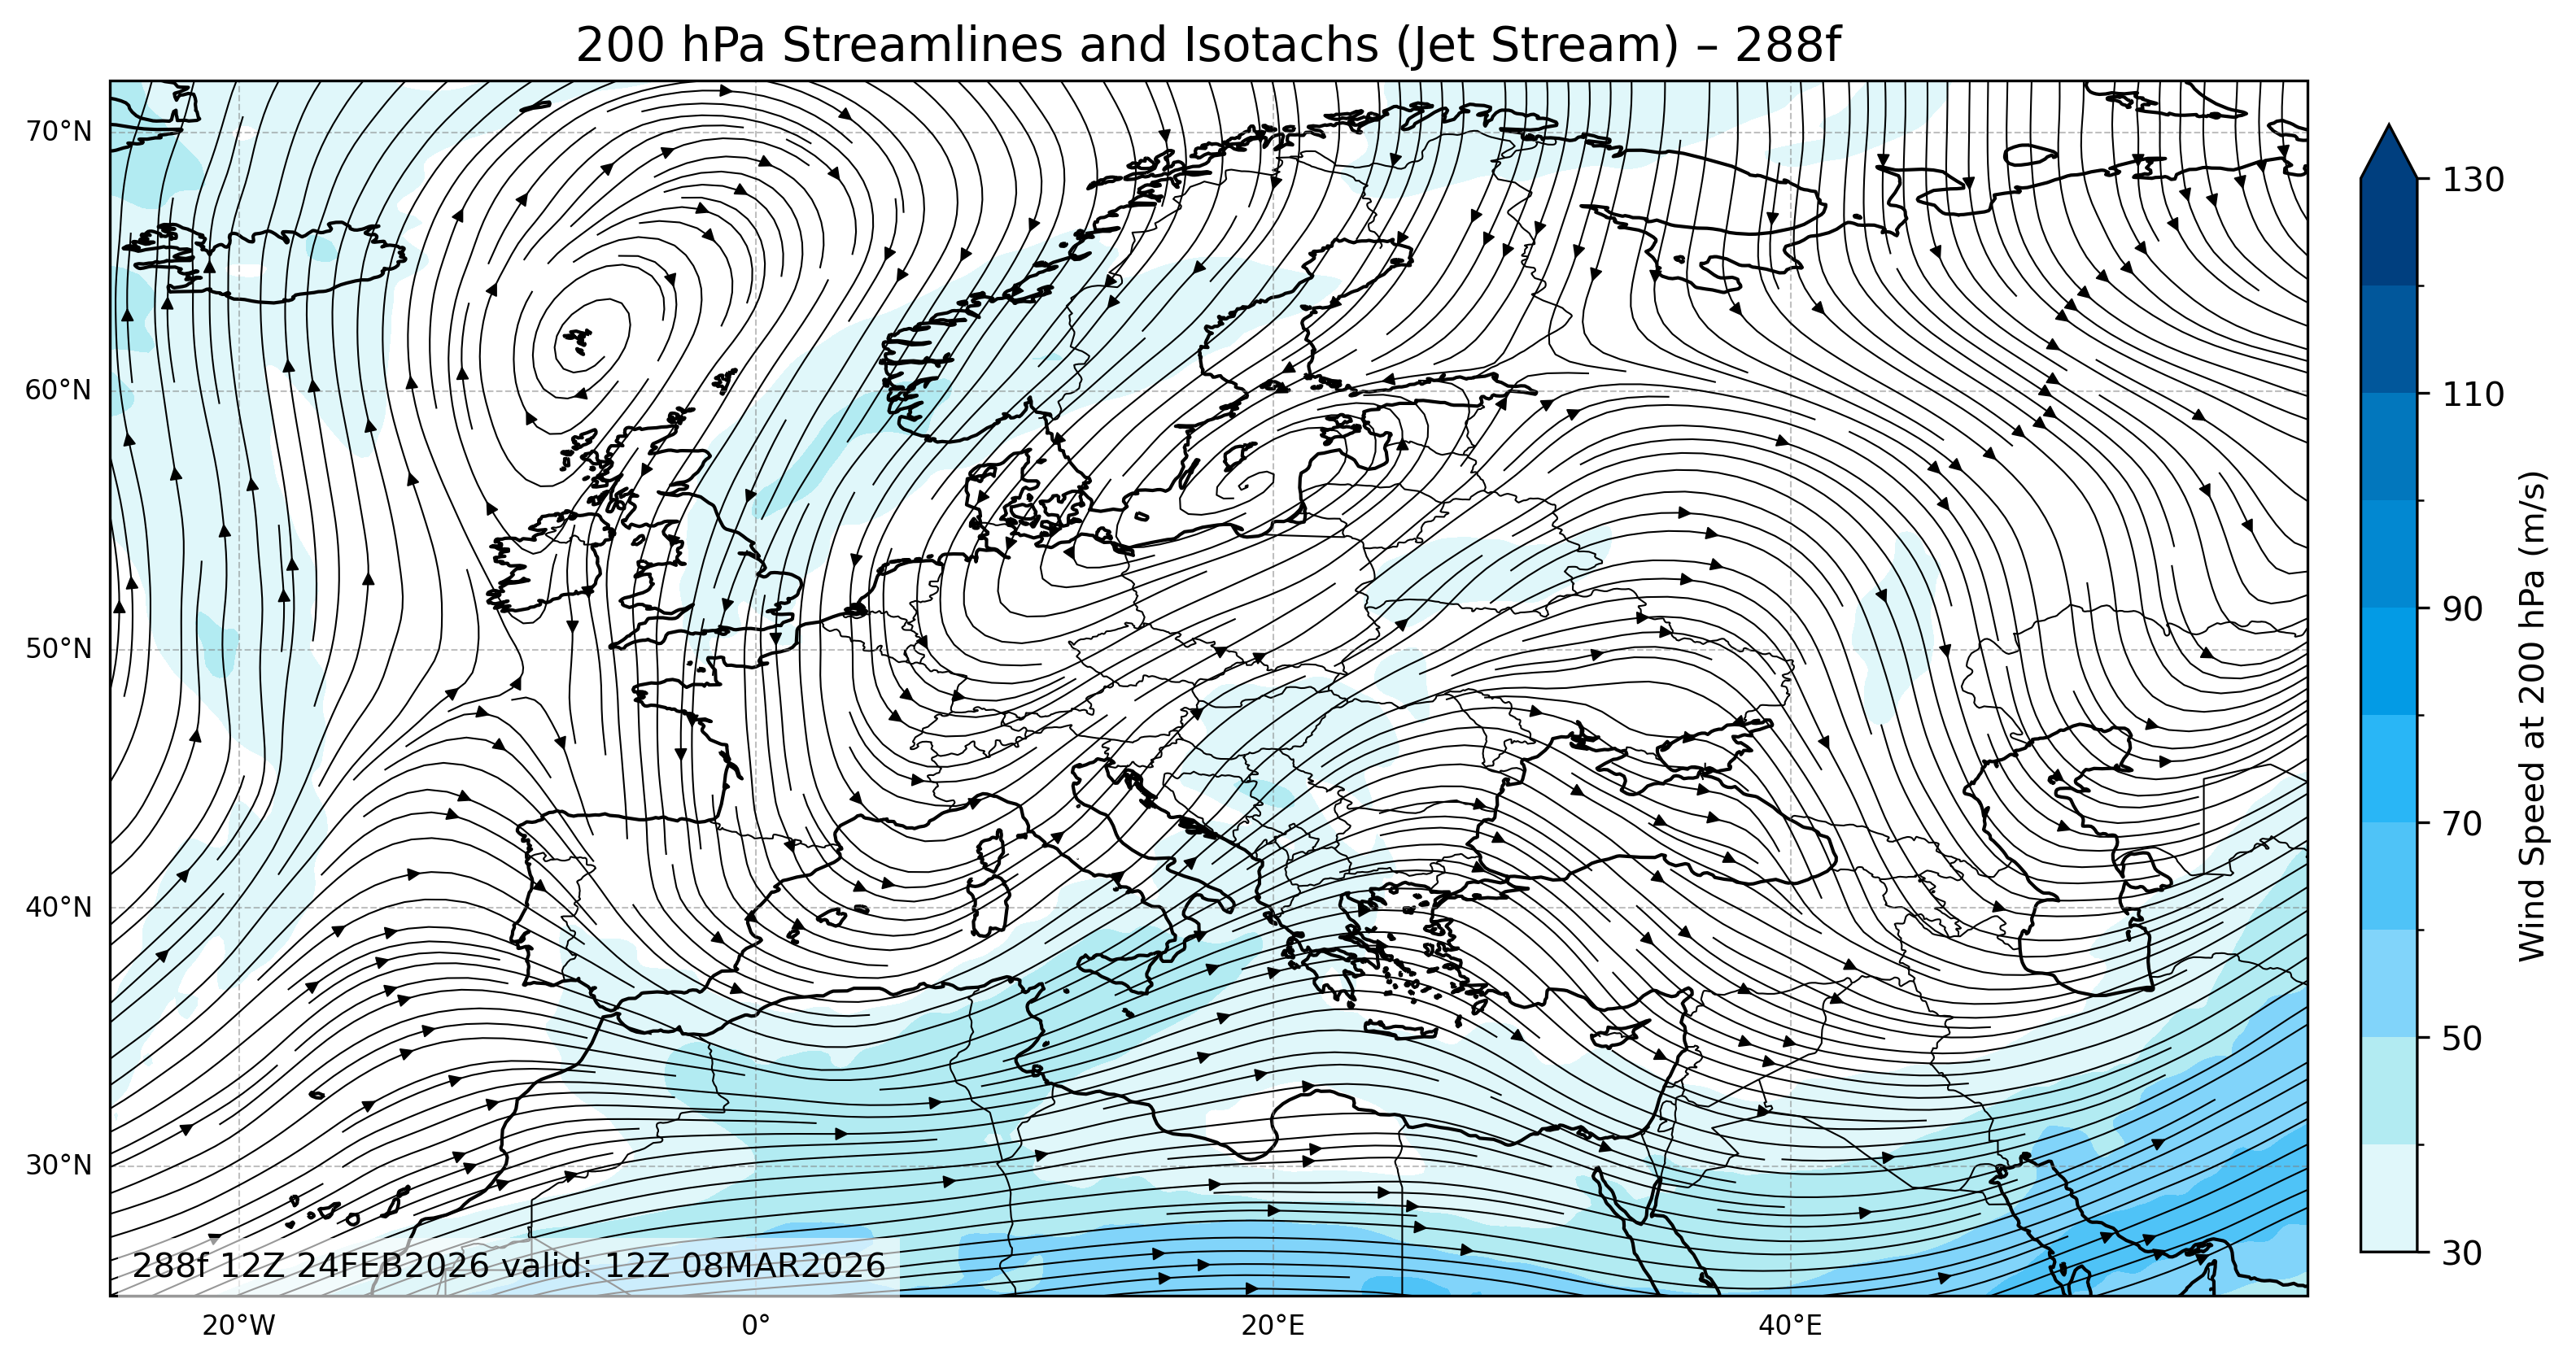
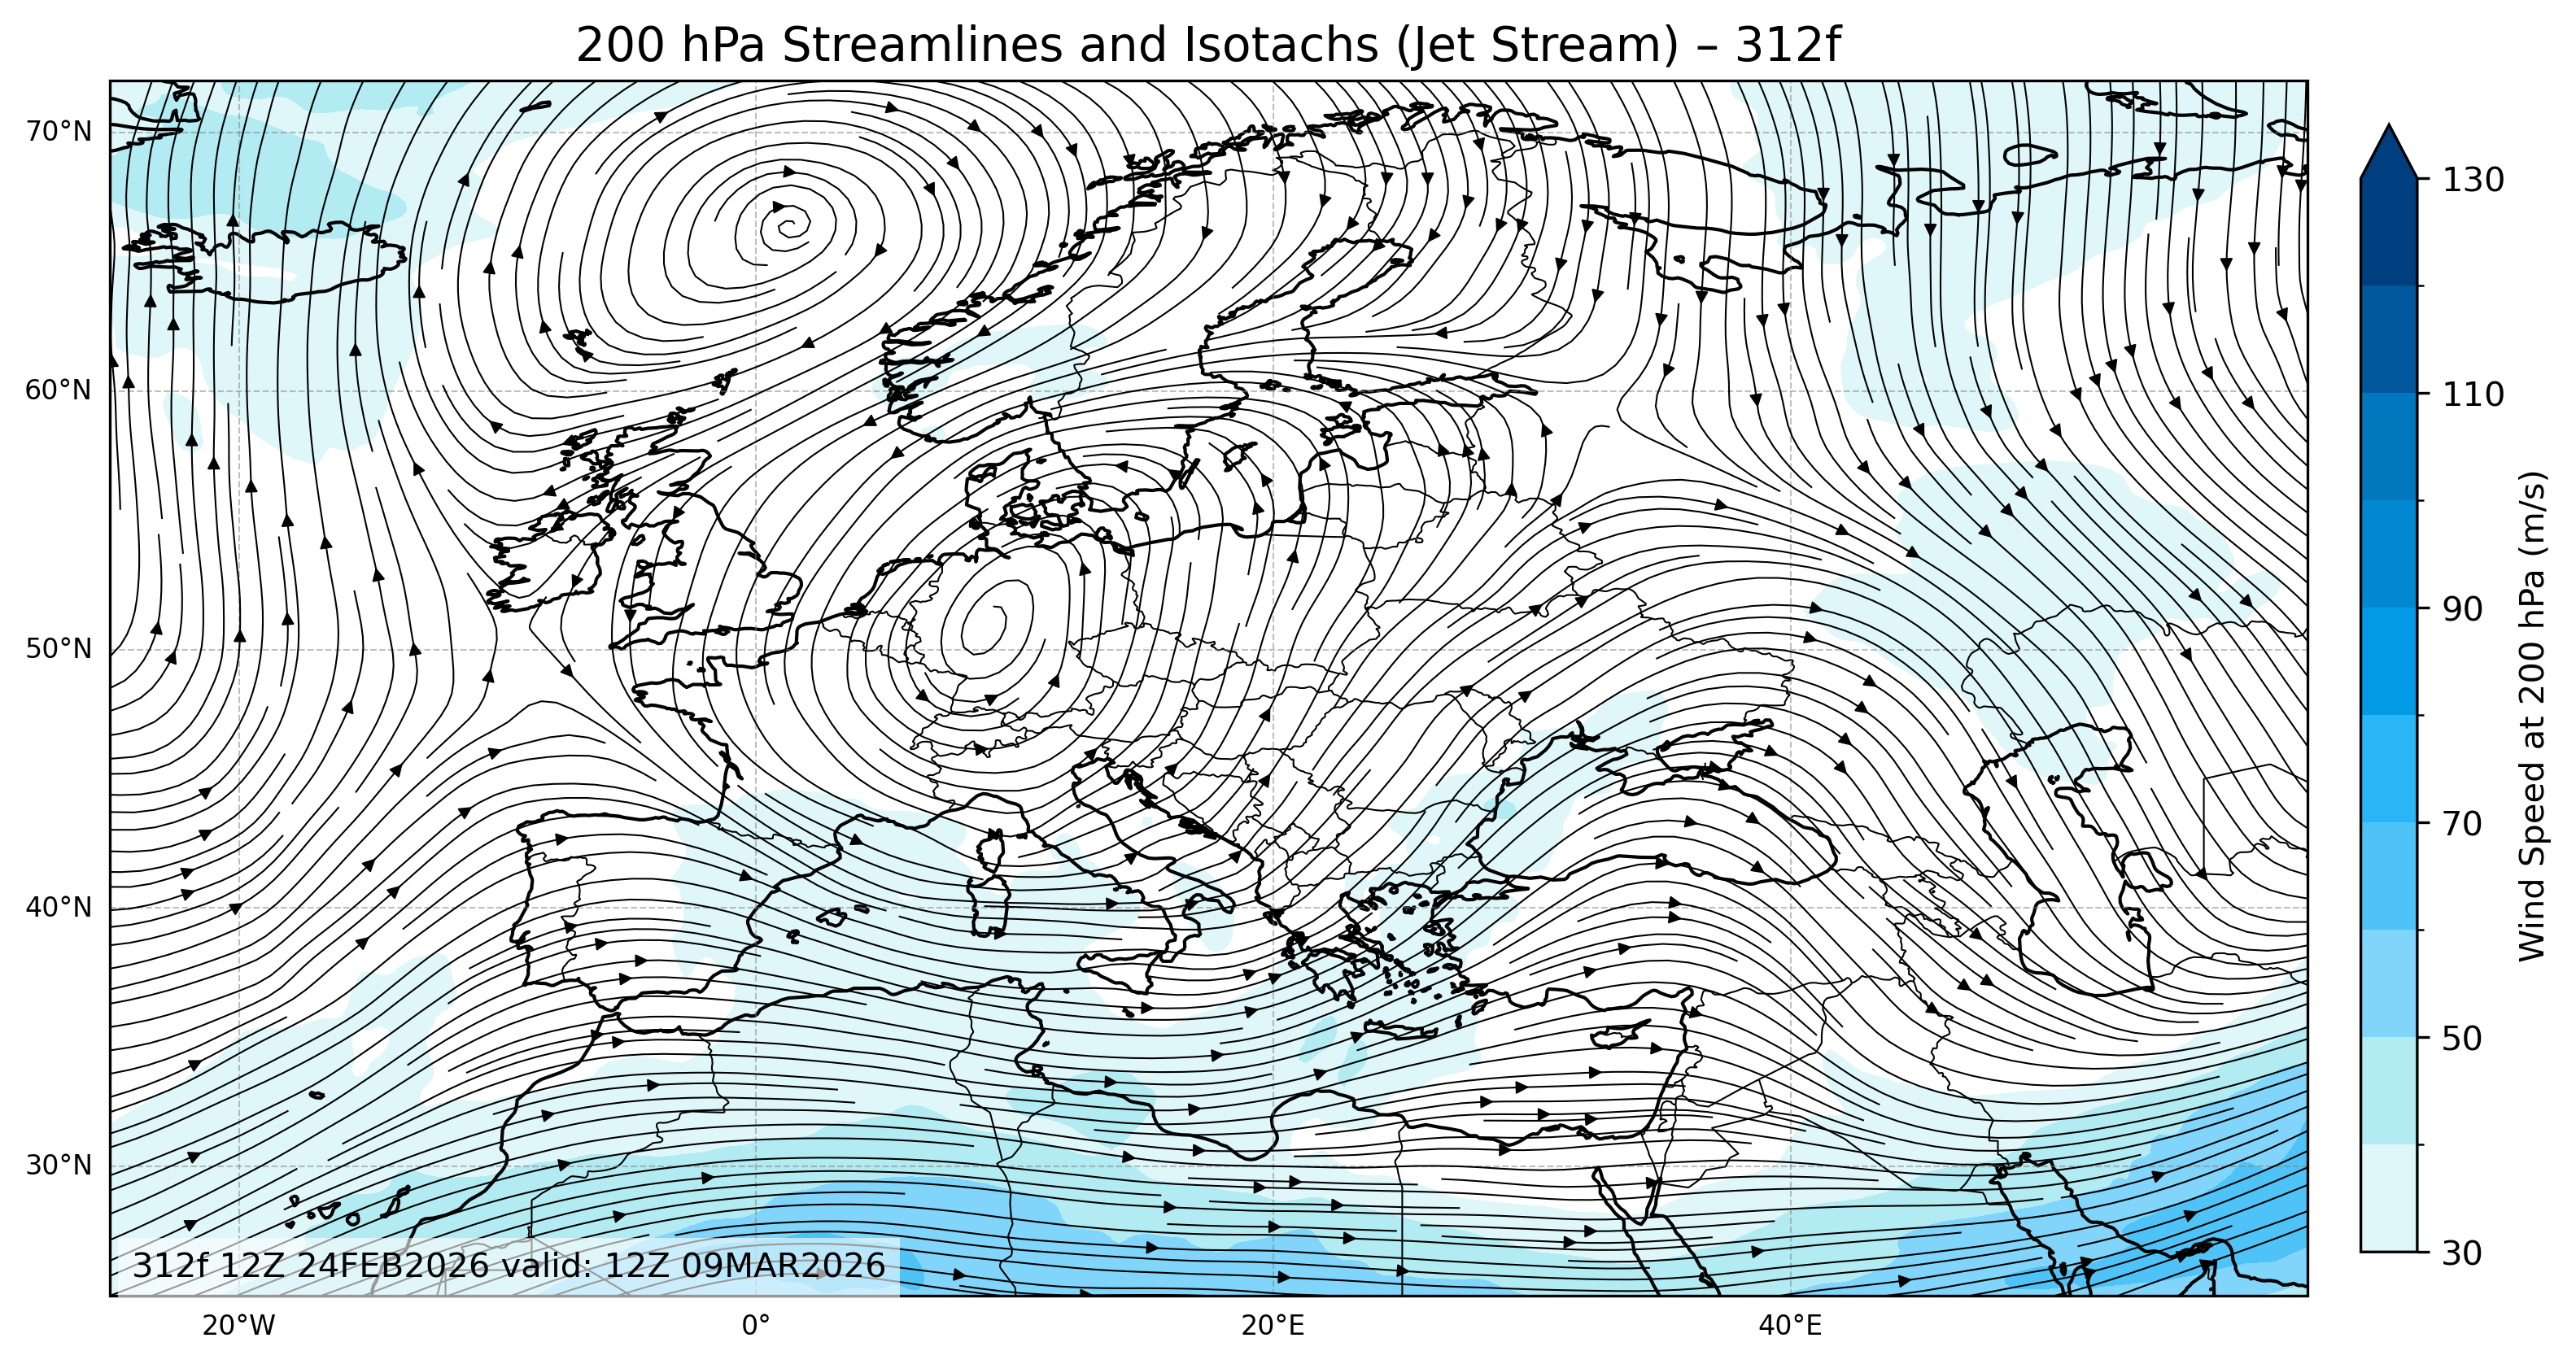
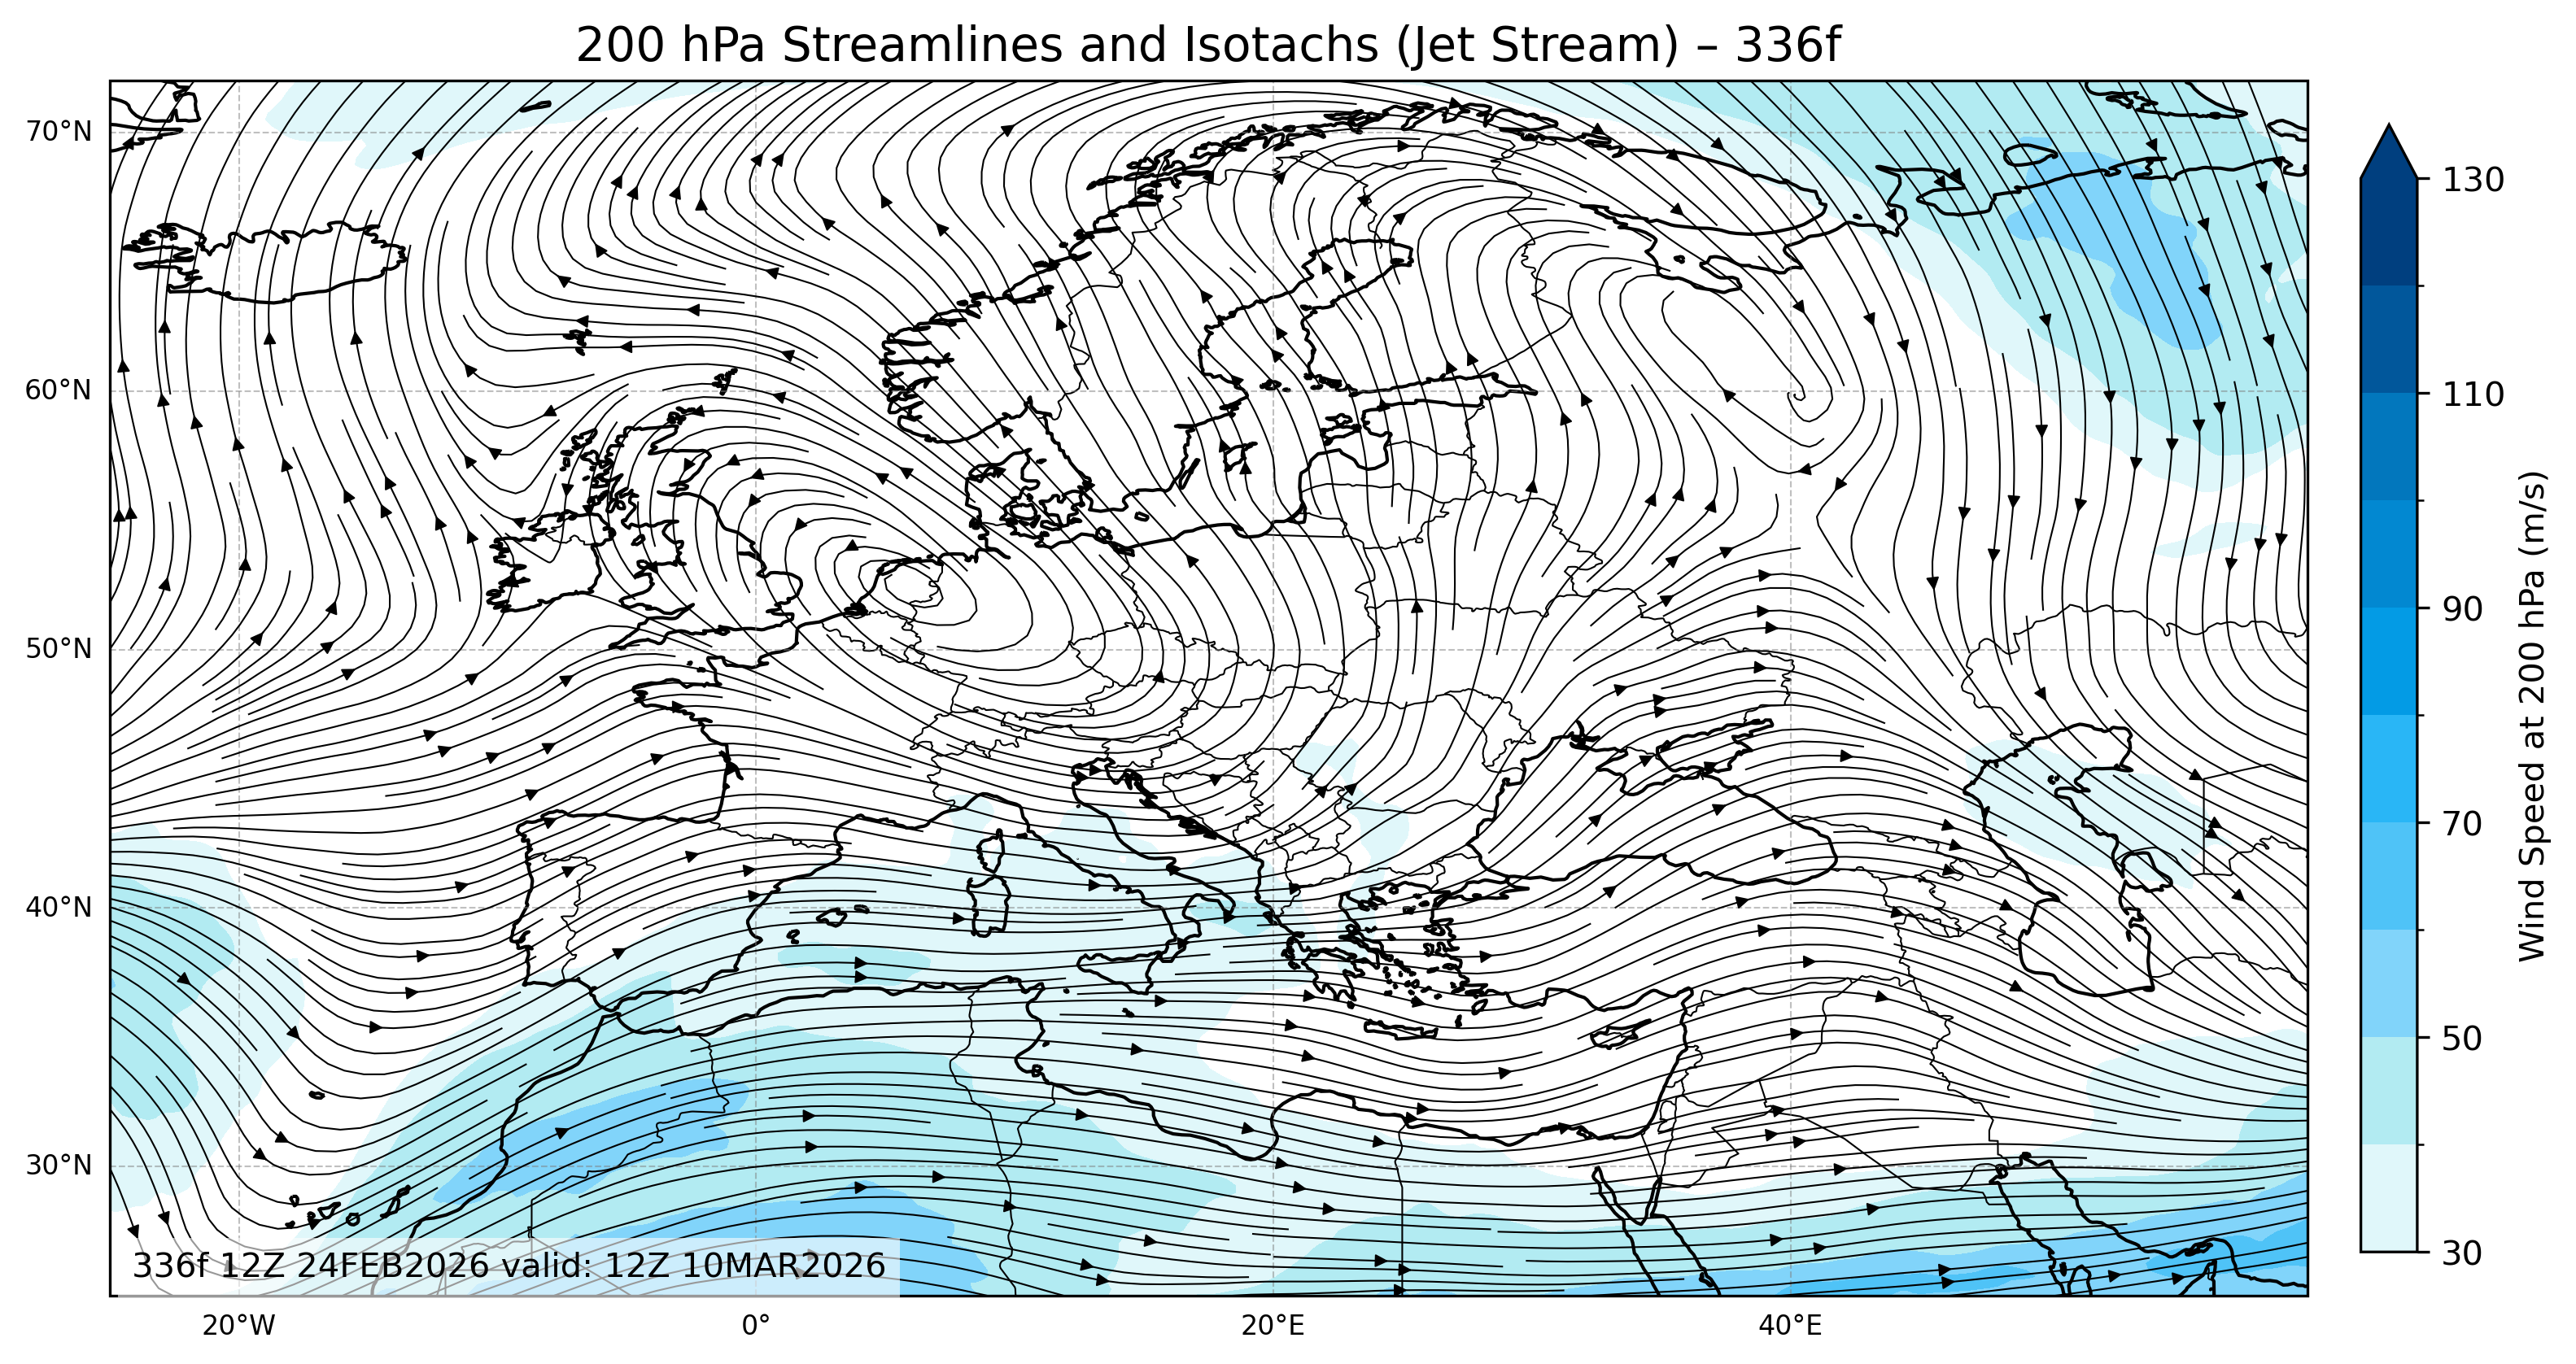
Wxmaps Europe 200mb Streamlines & Isotachs
The 200mb Streamlines & Isotachs maps illustrate jet stream dynamics and upper-level wind speed. Strong isotach gradients often correspond to jet streaks, which enhance vertical motion and can intensify surface cyclones. Monitoring these changes across multiple forecast hours helps identify developing severe weather regions. wxmaps middle east.
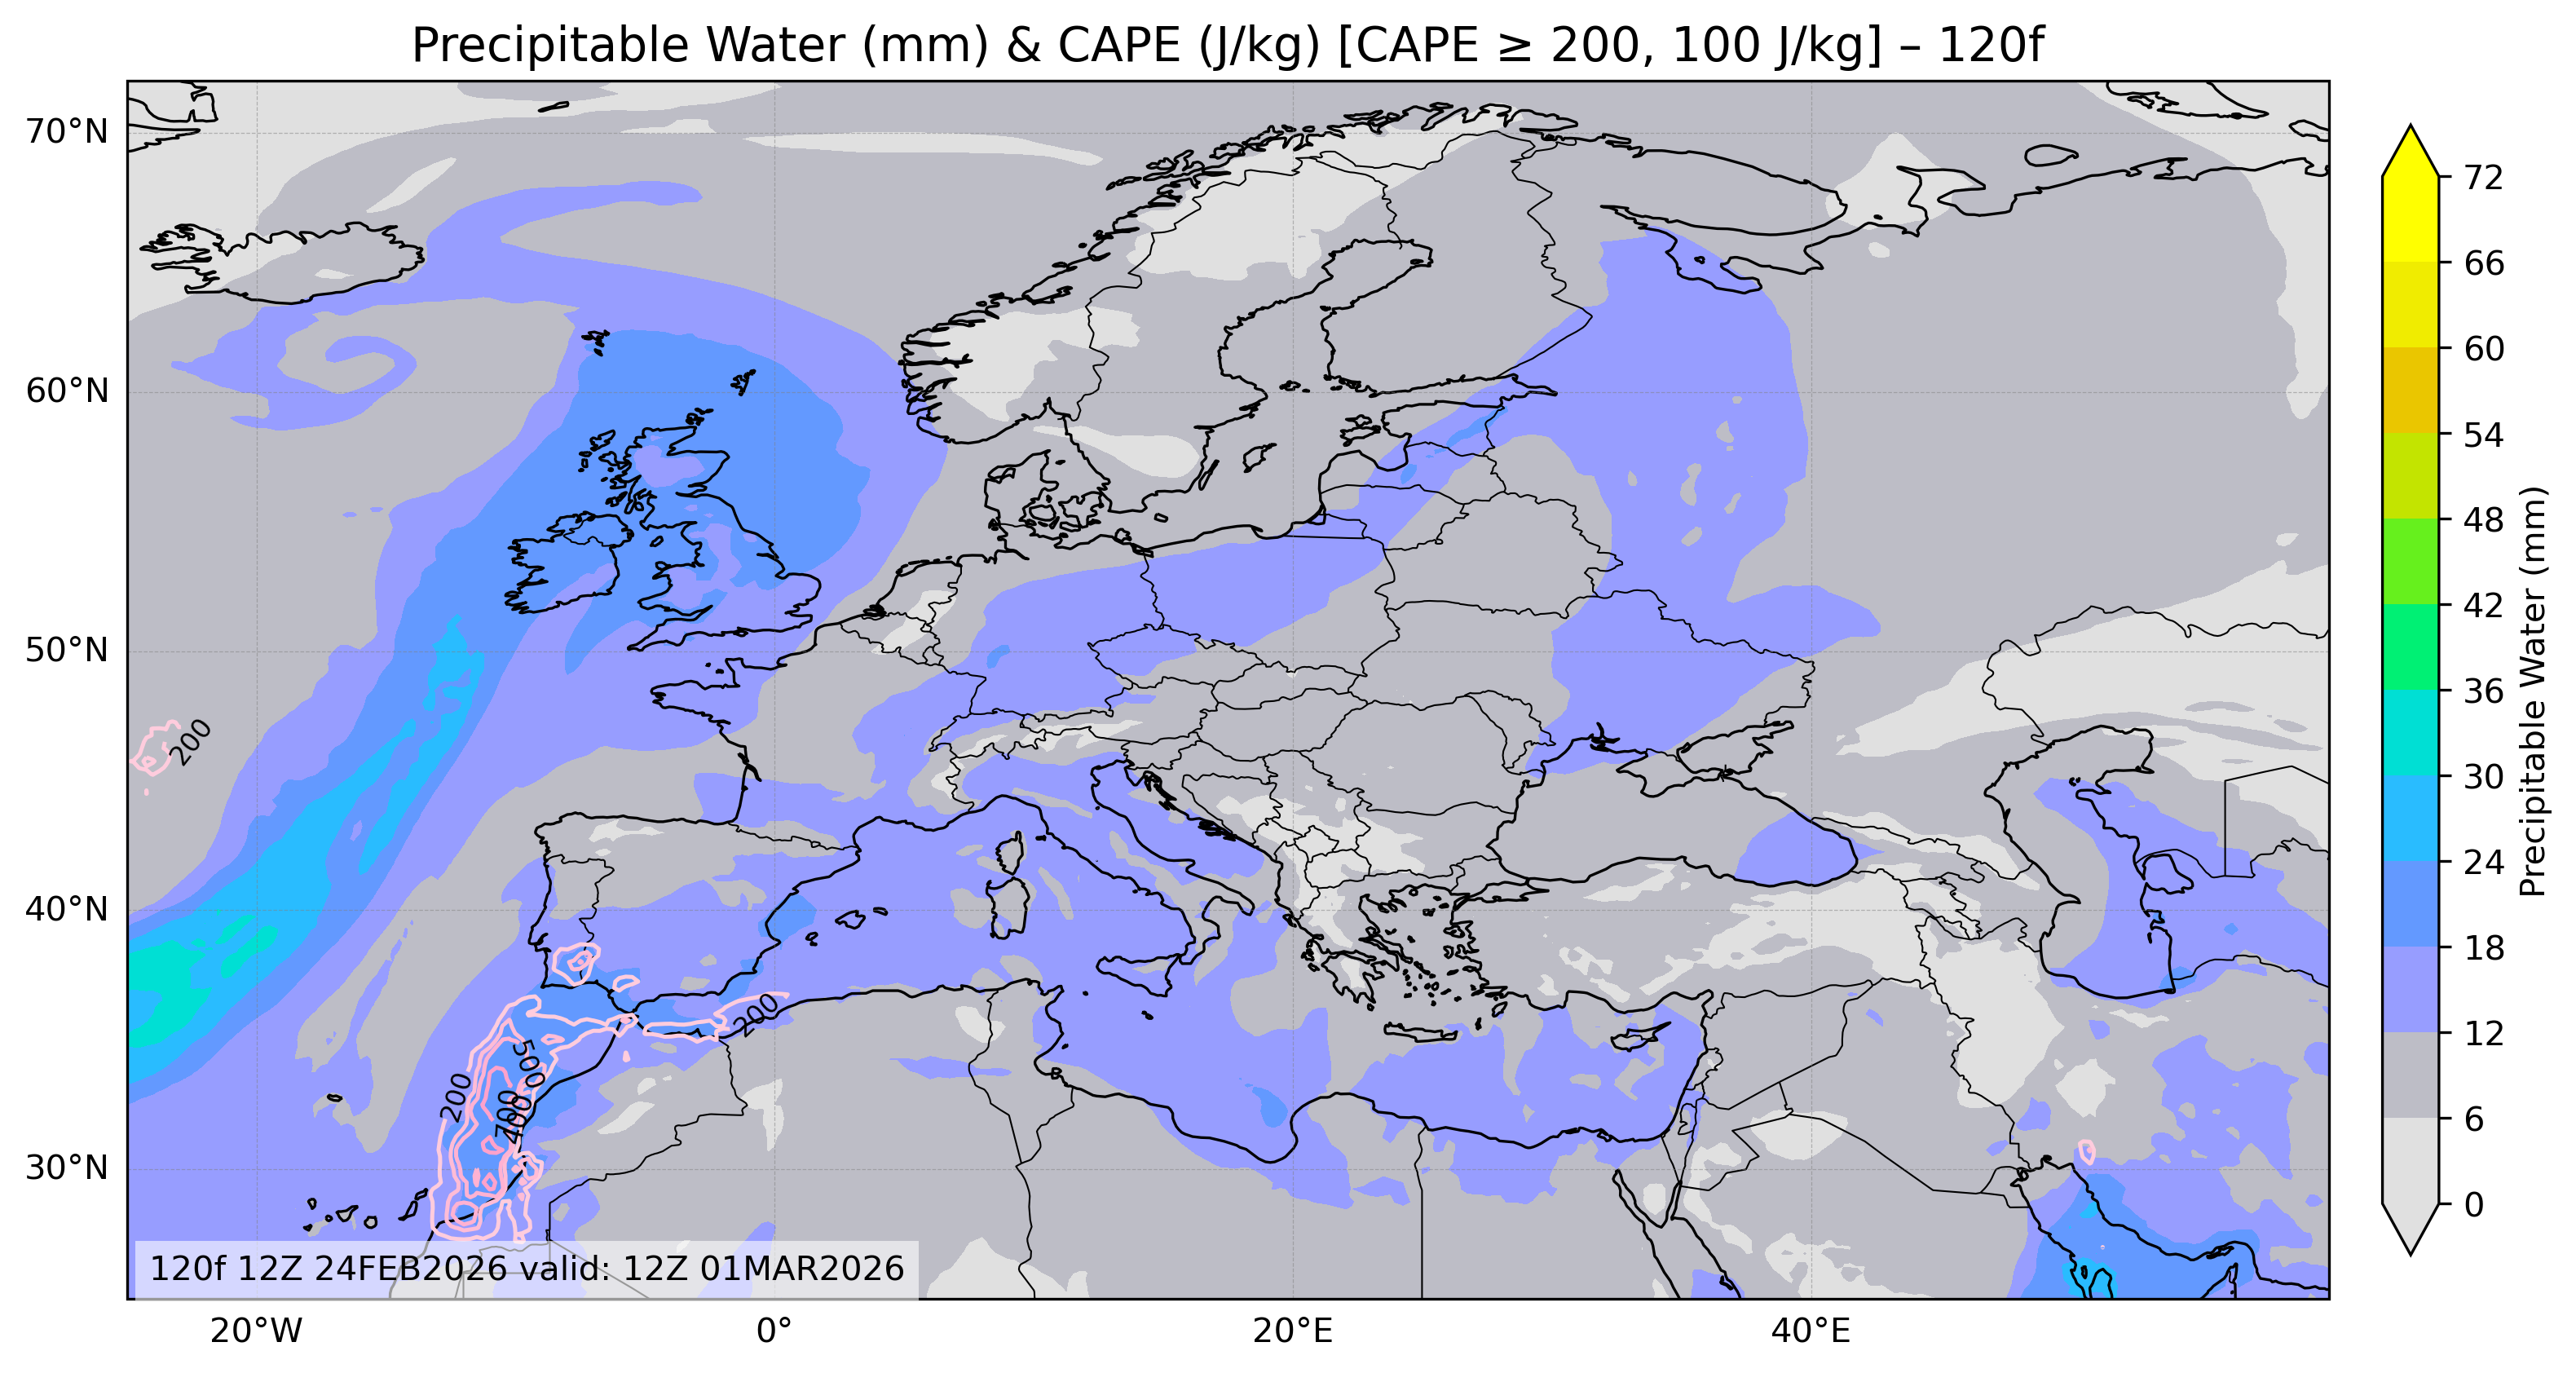
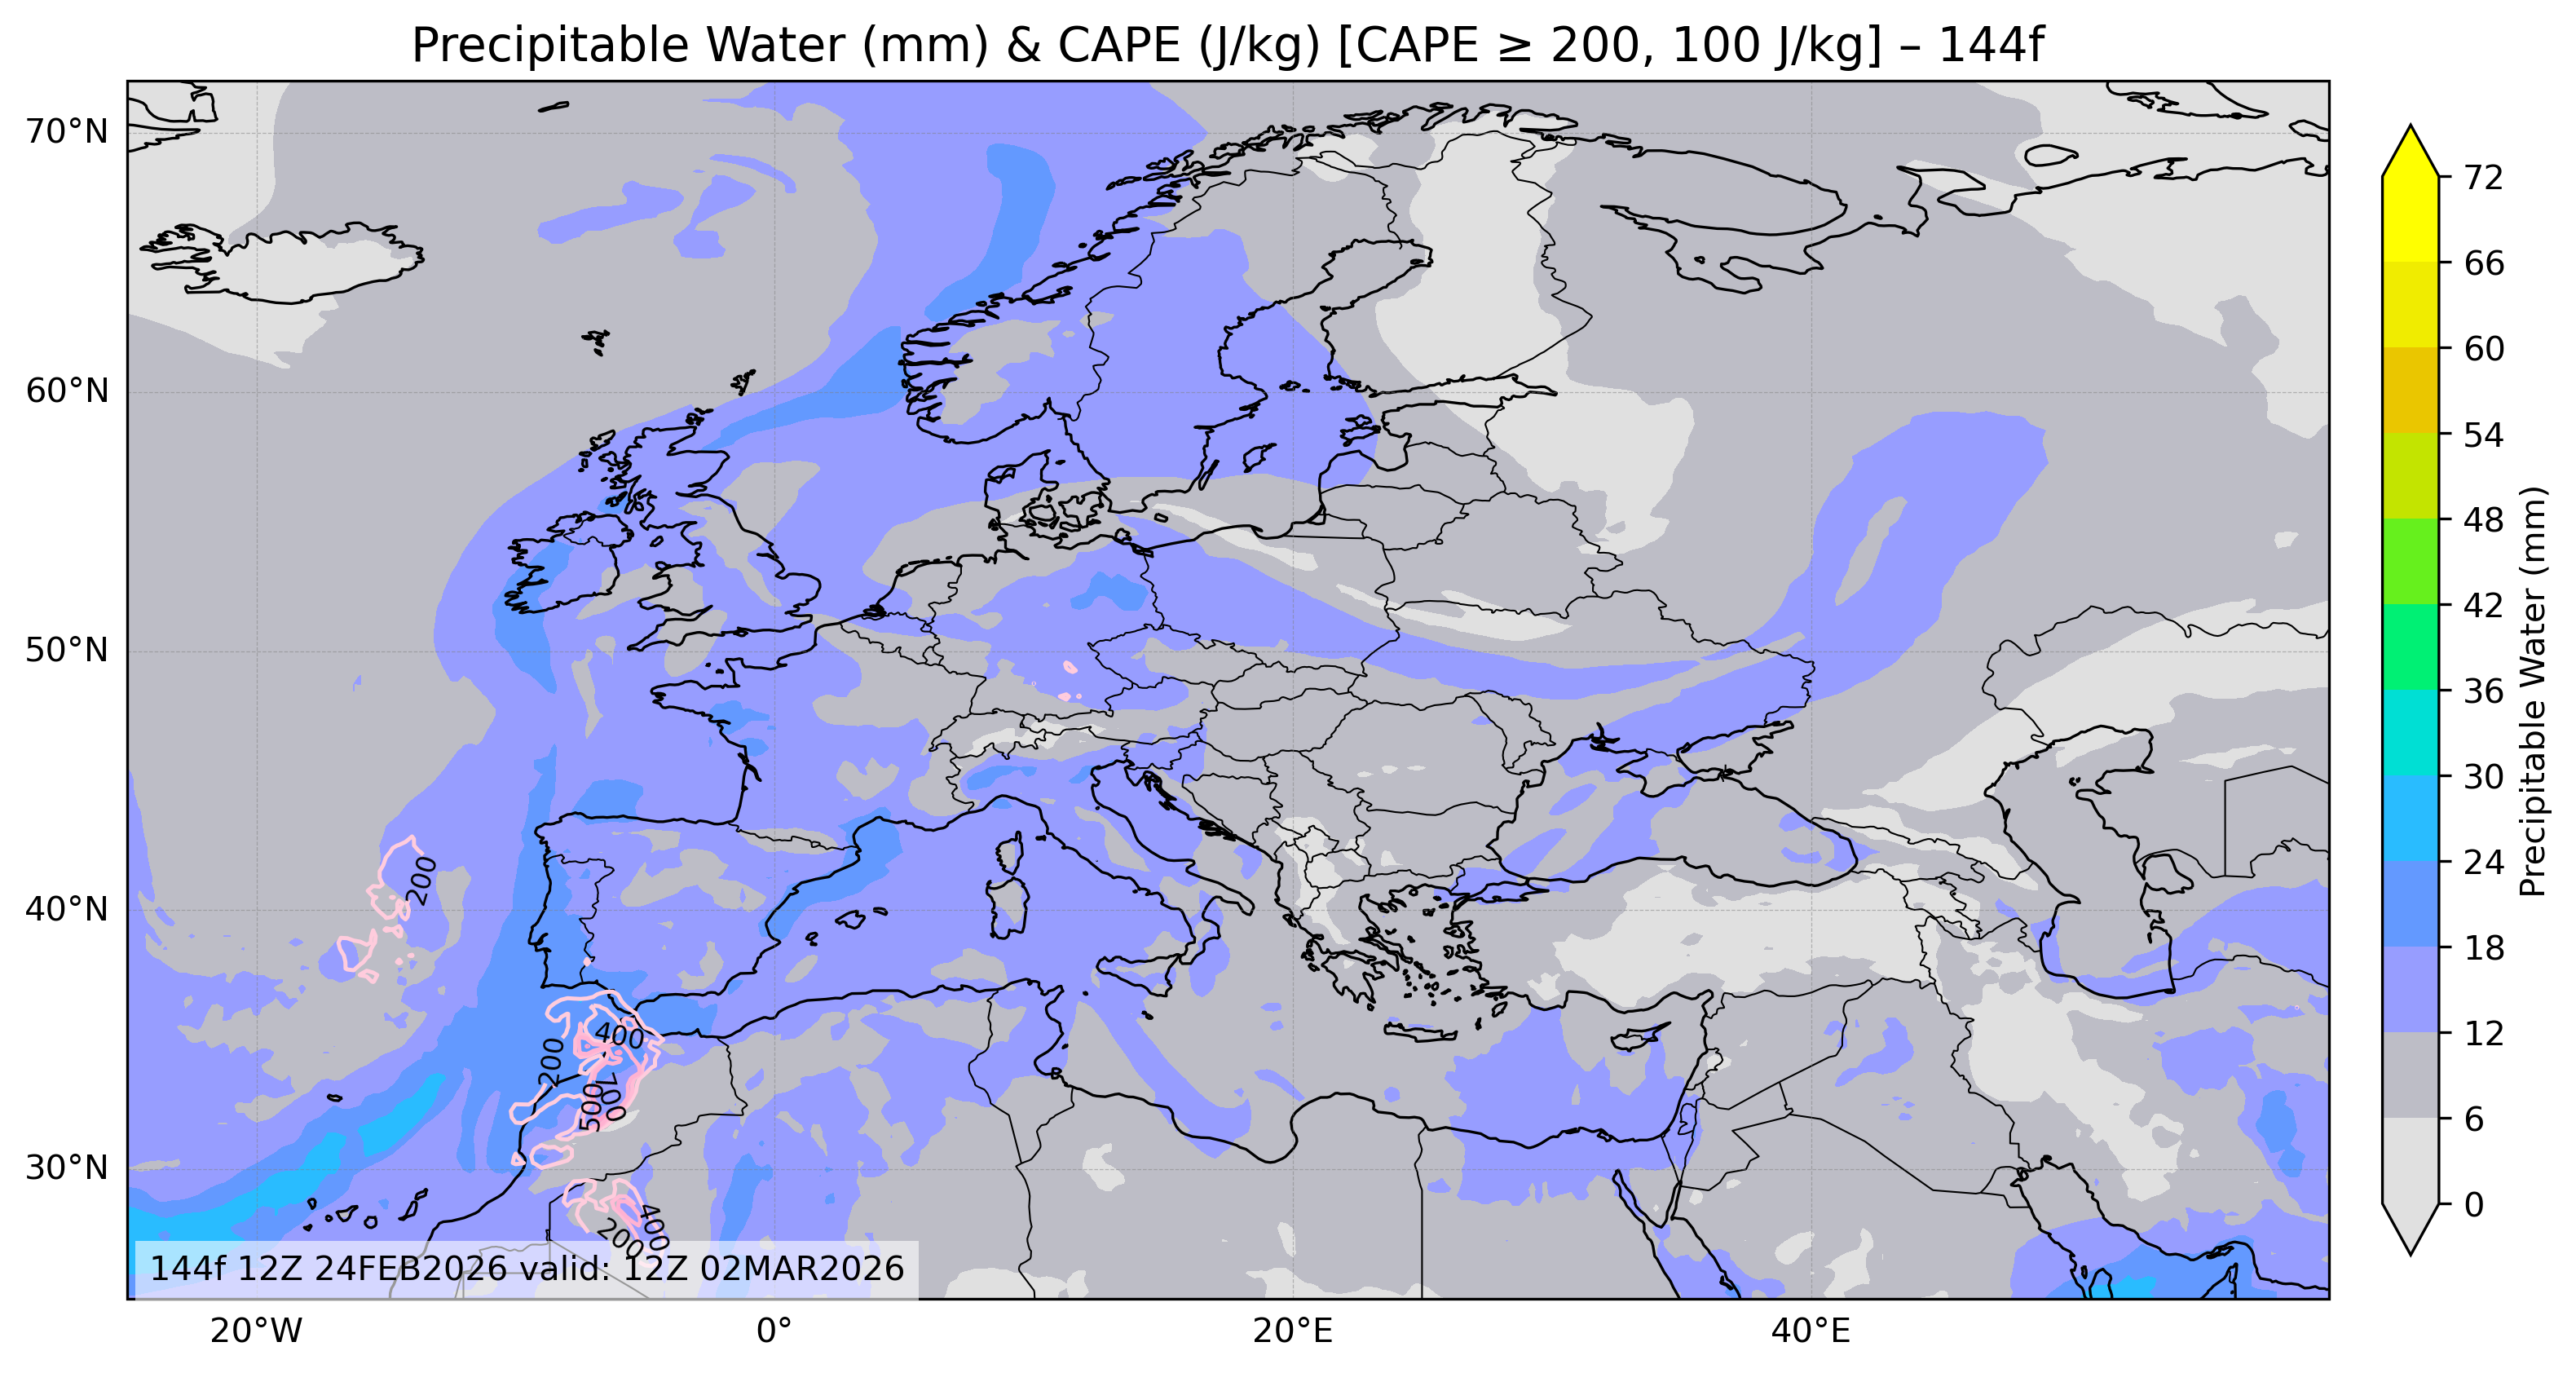
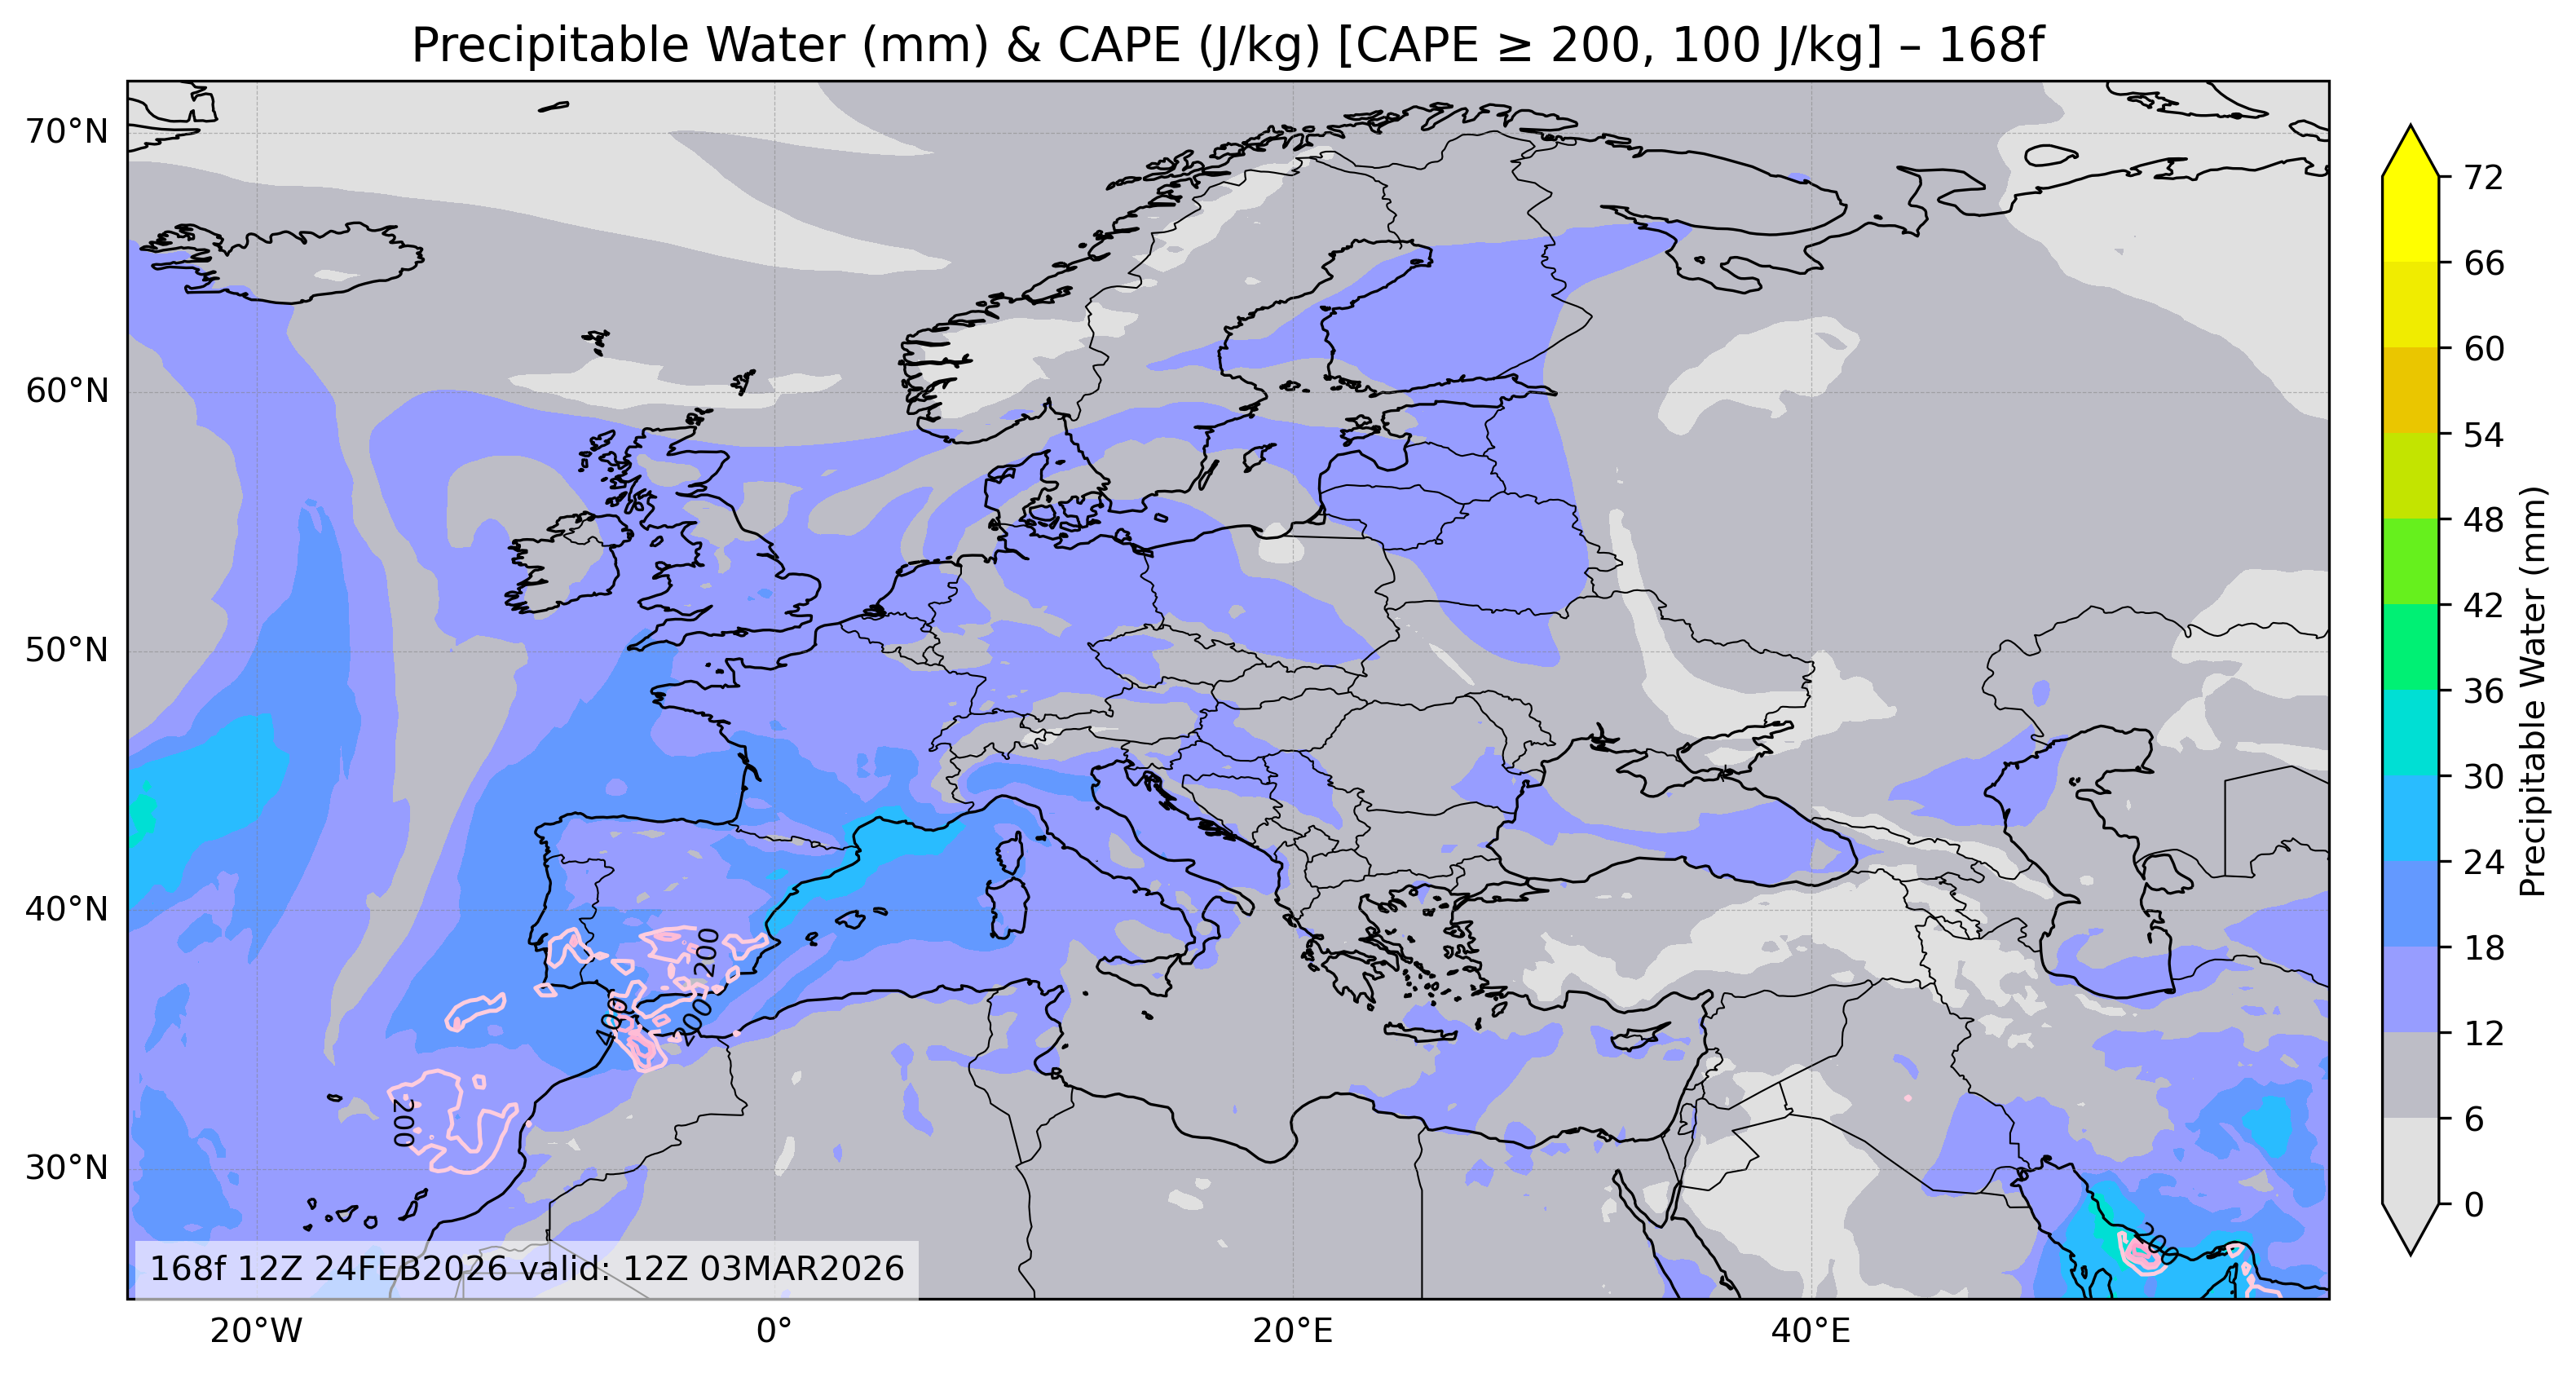
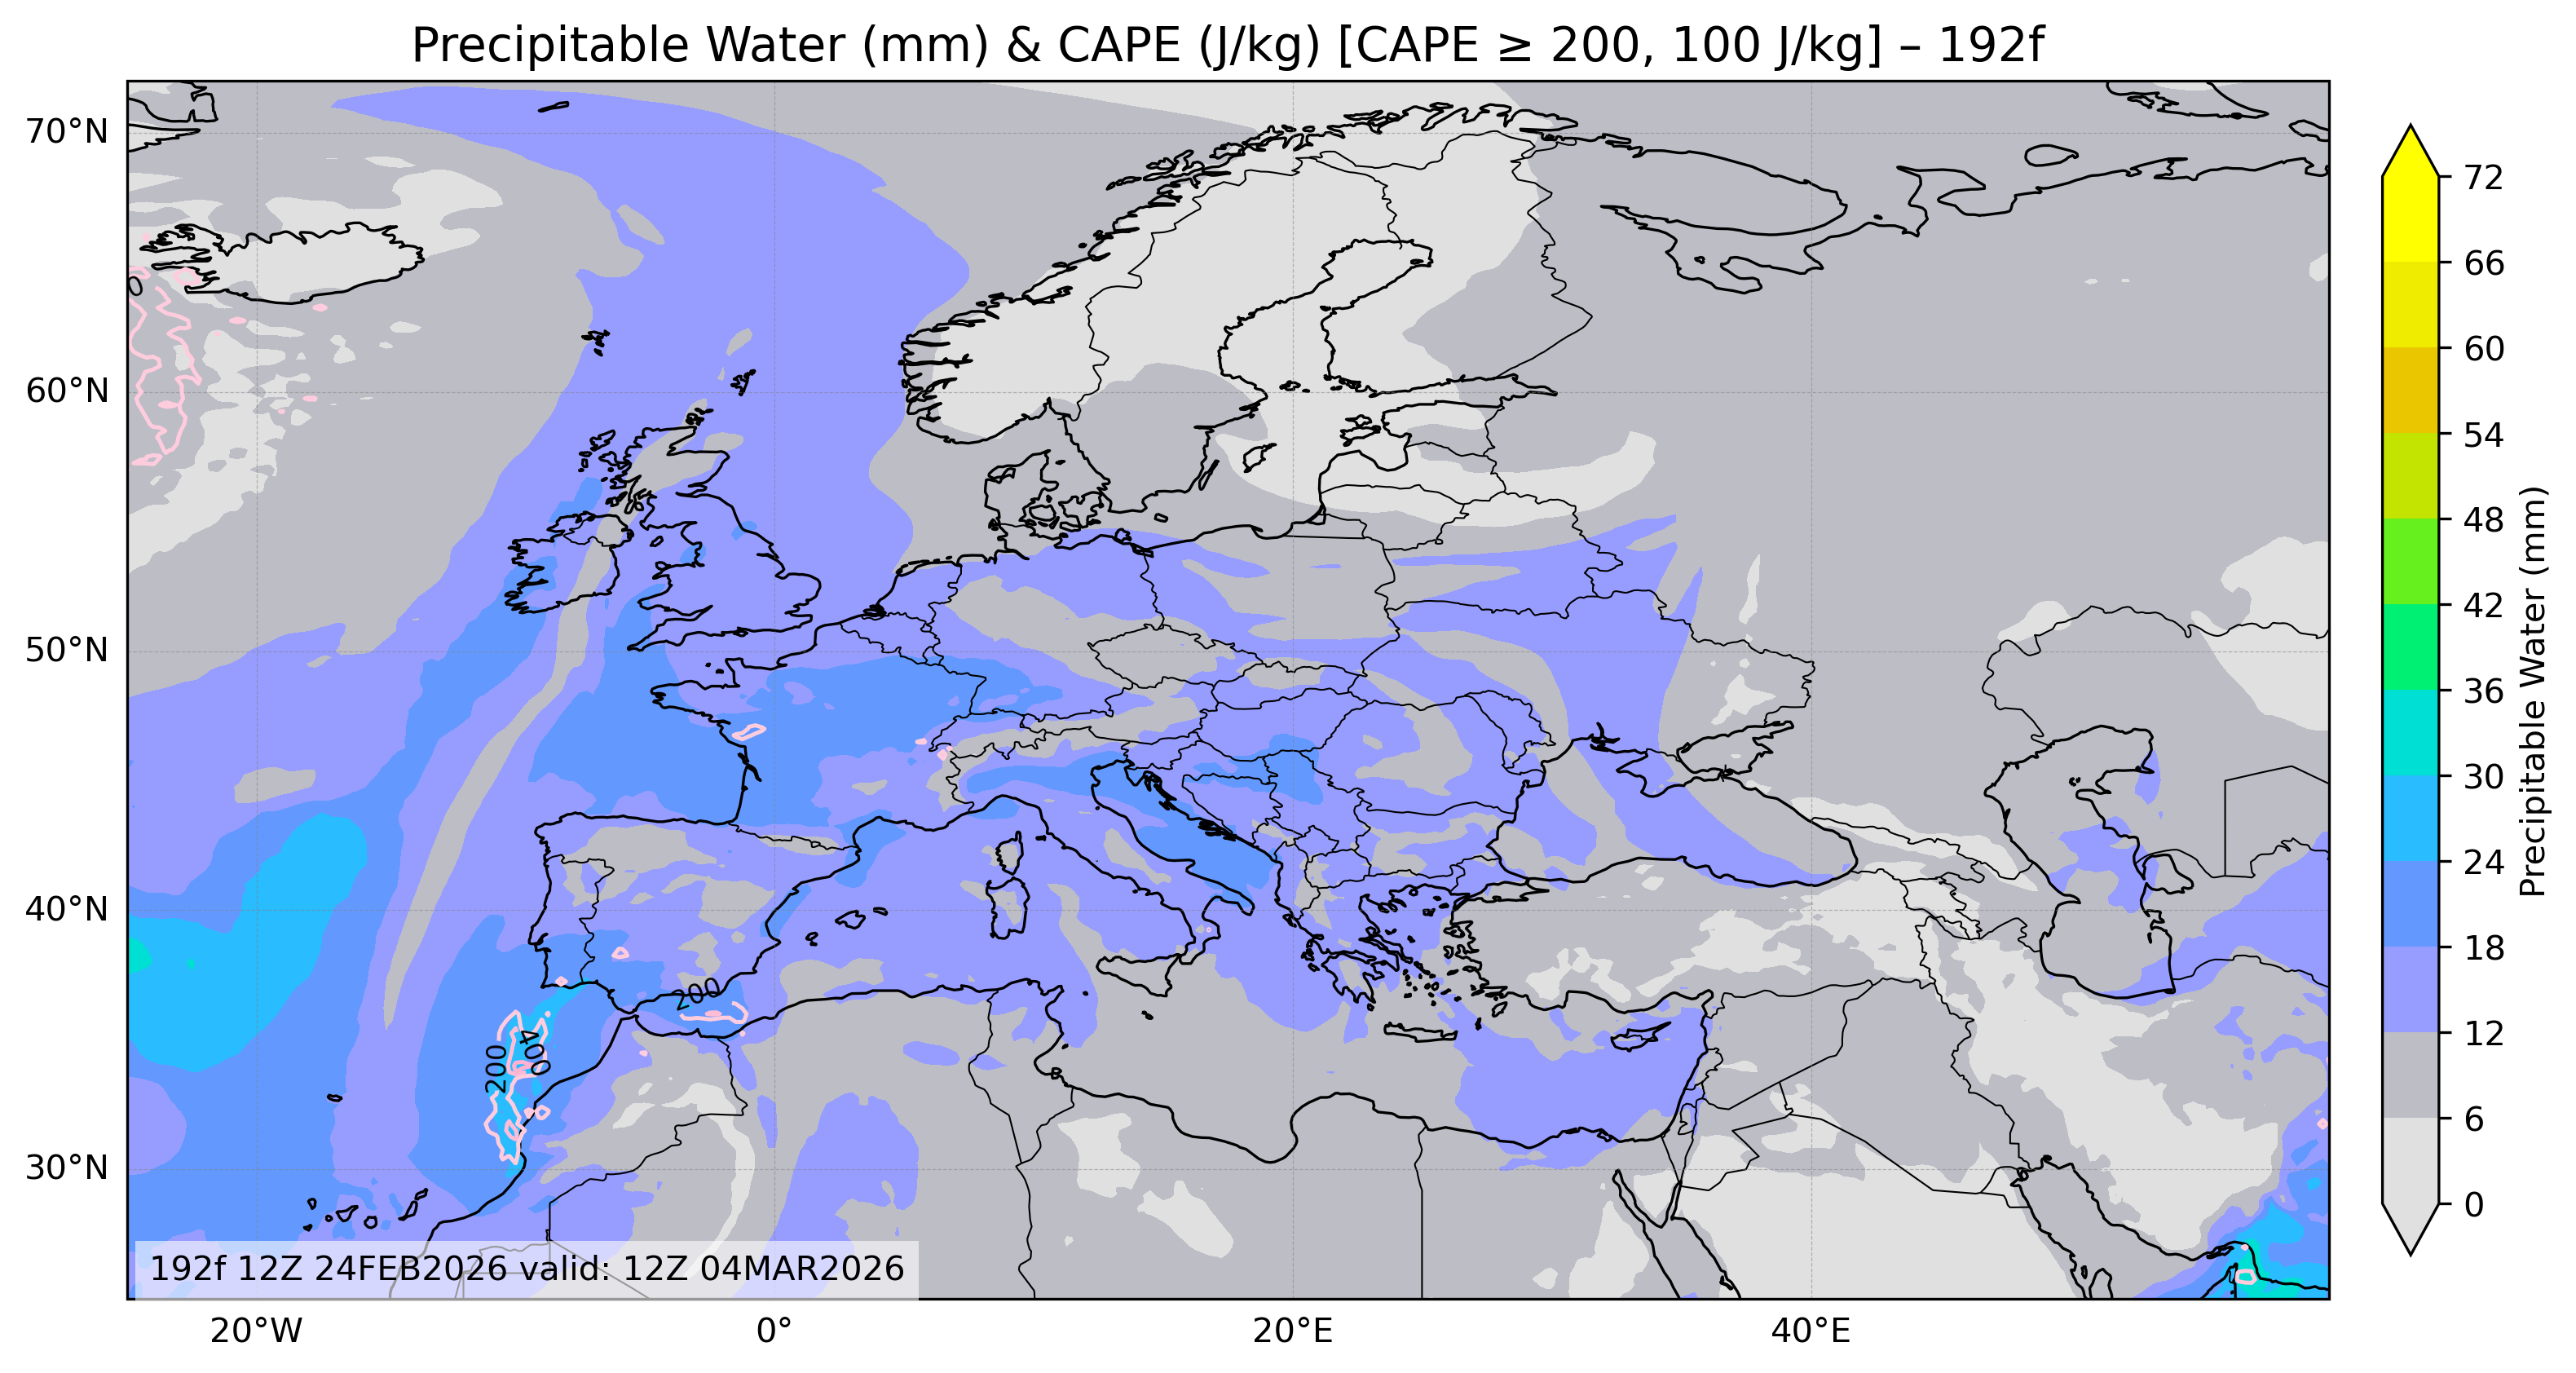
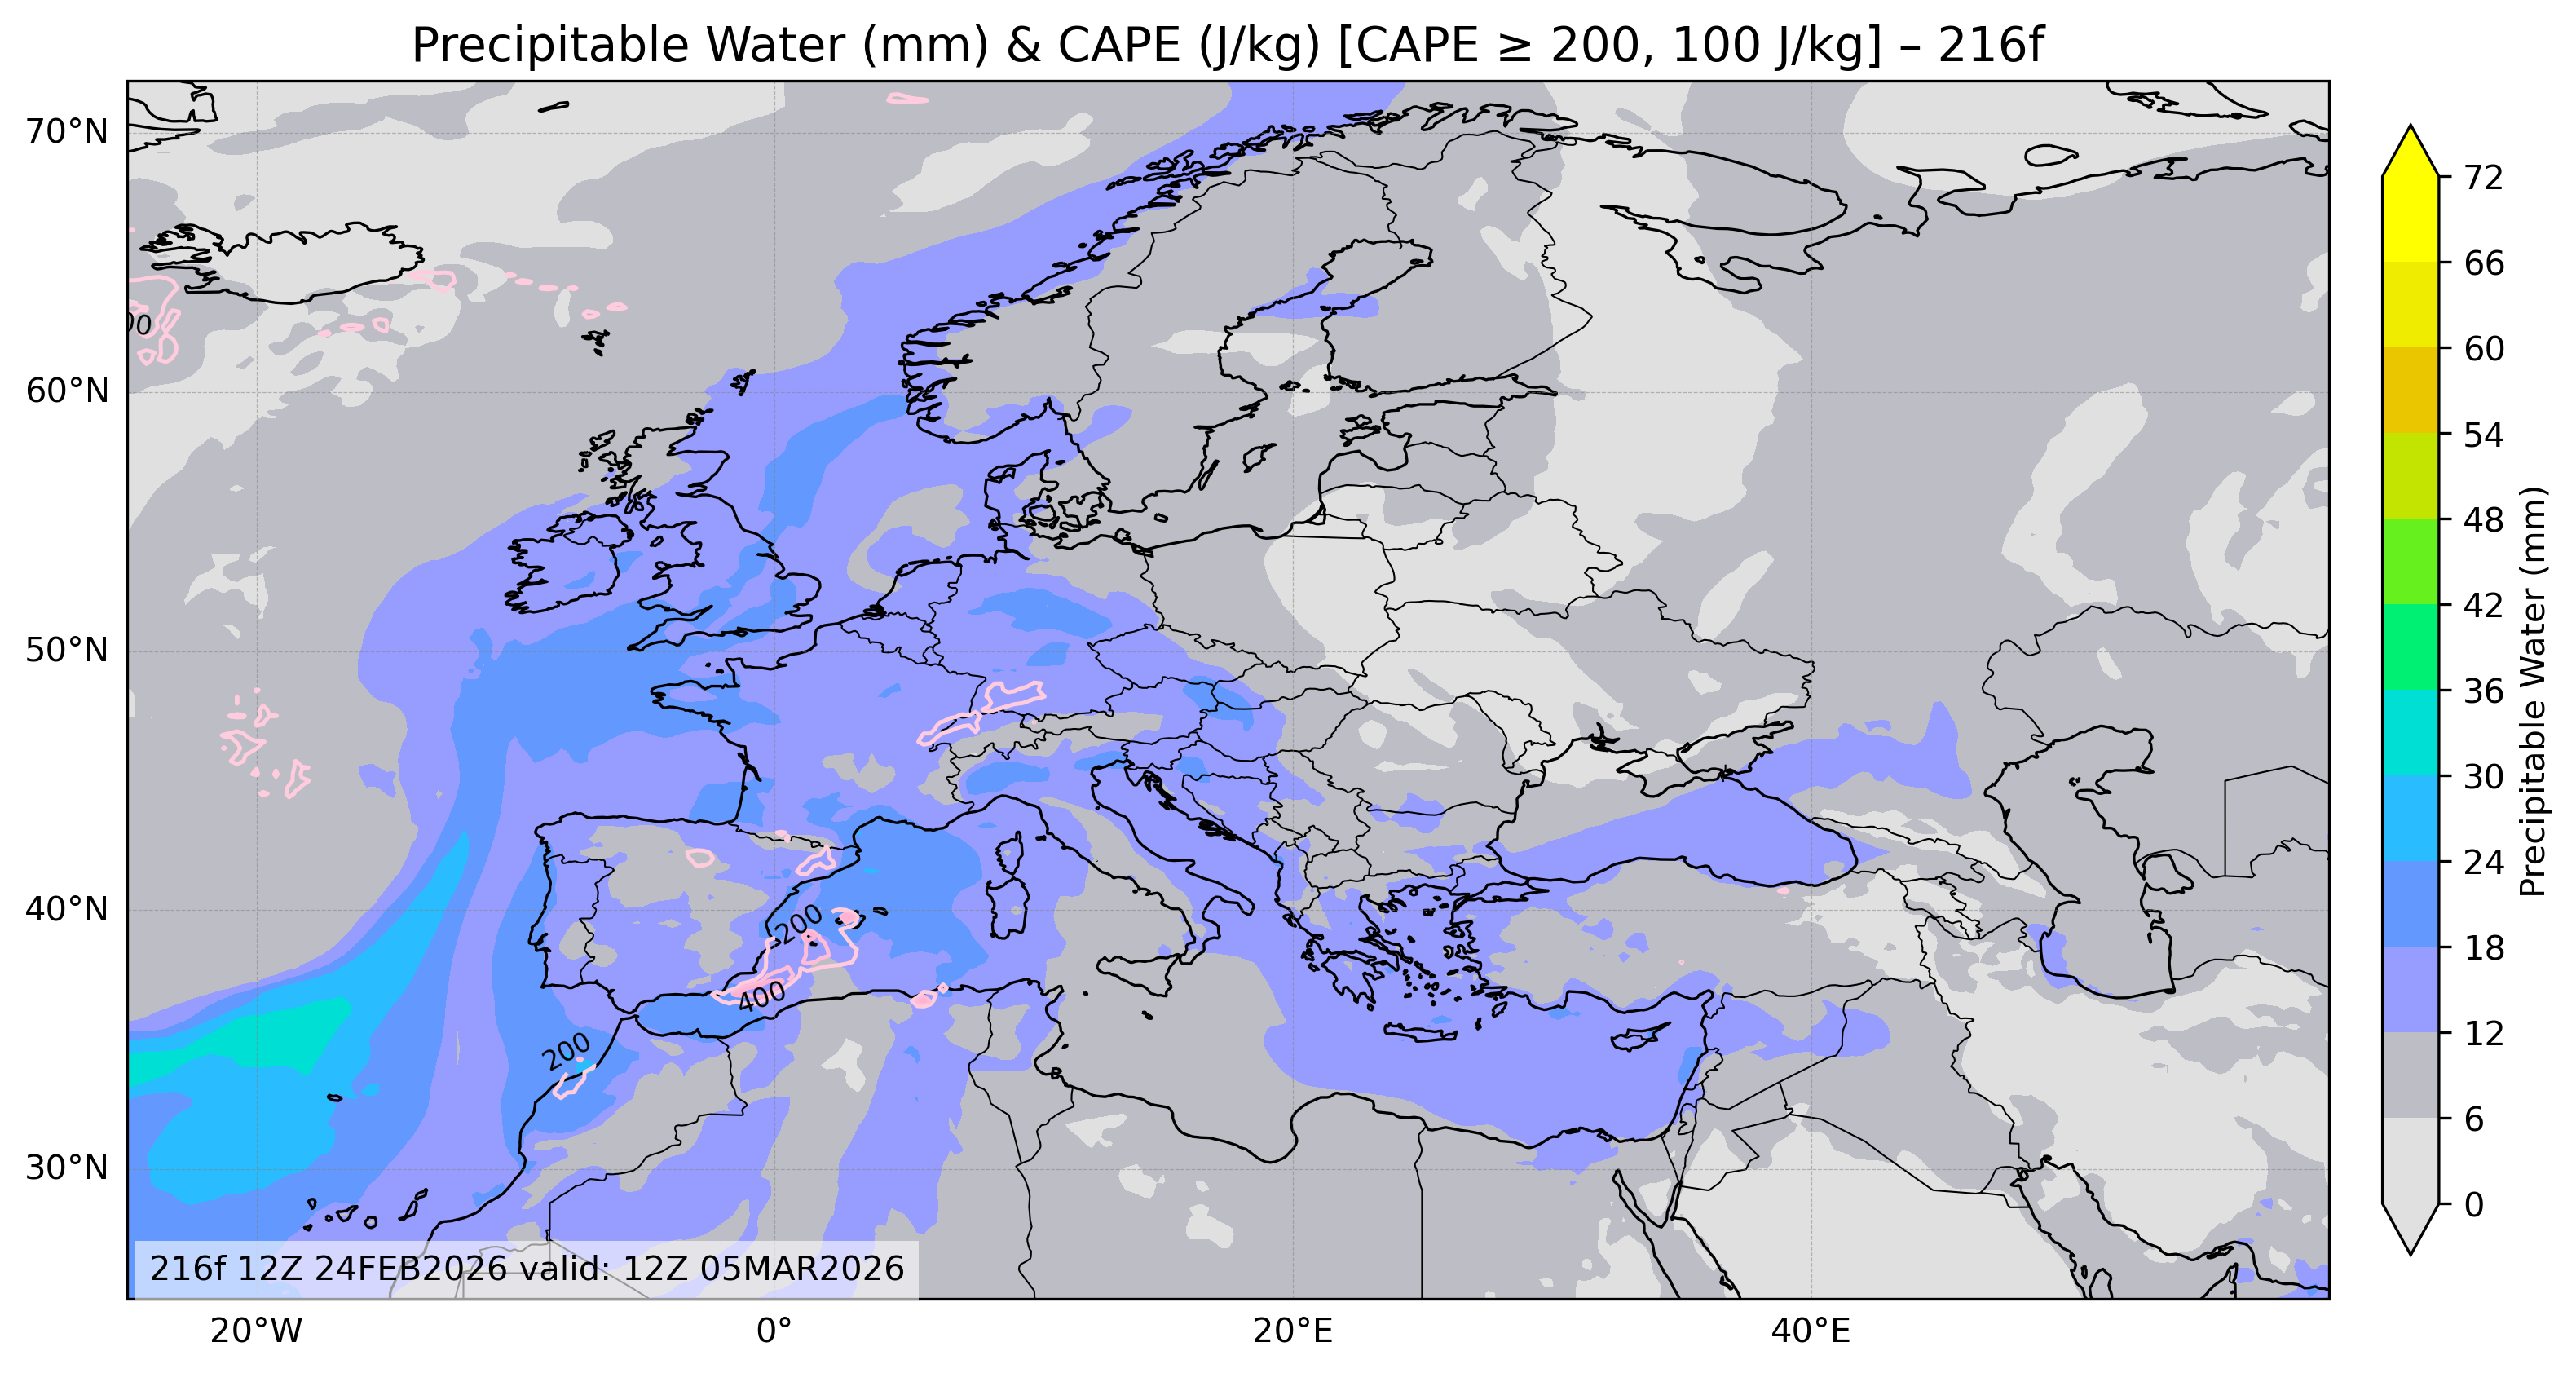
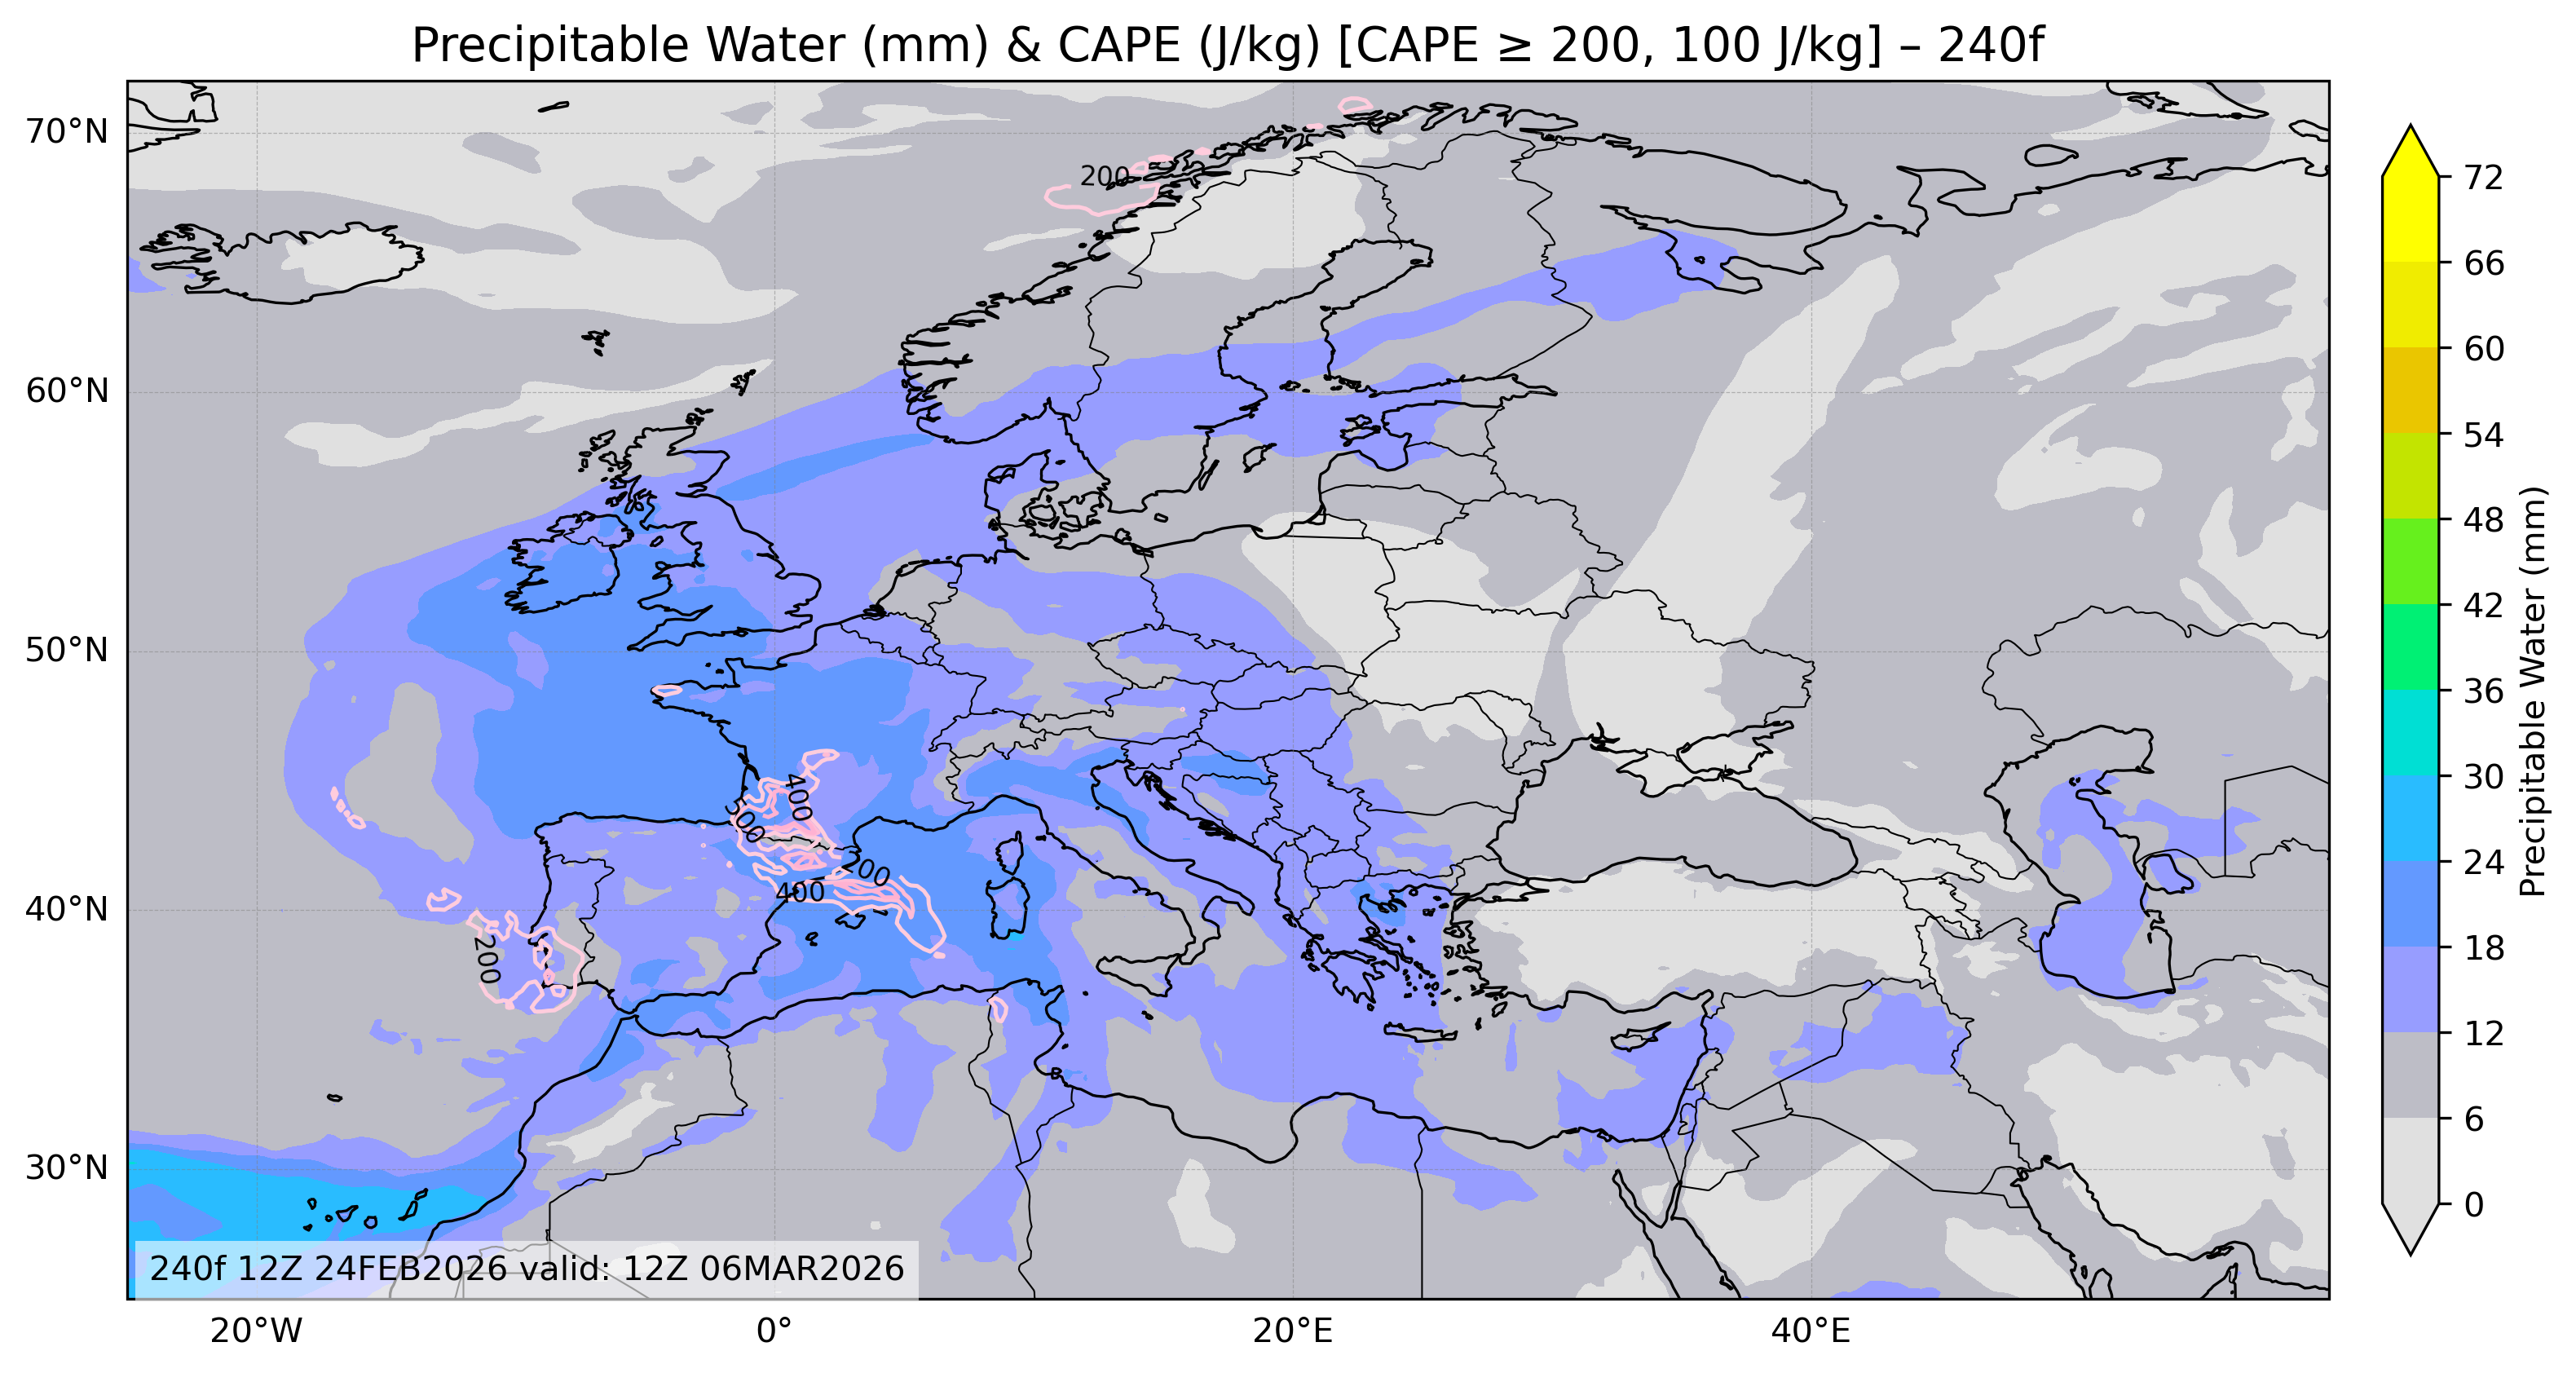
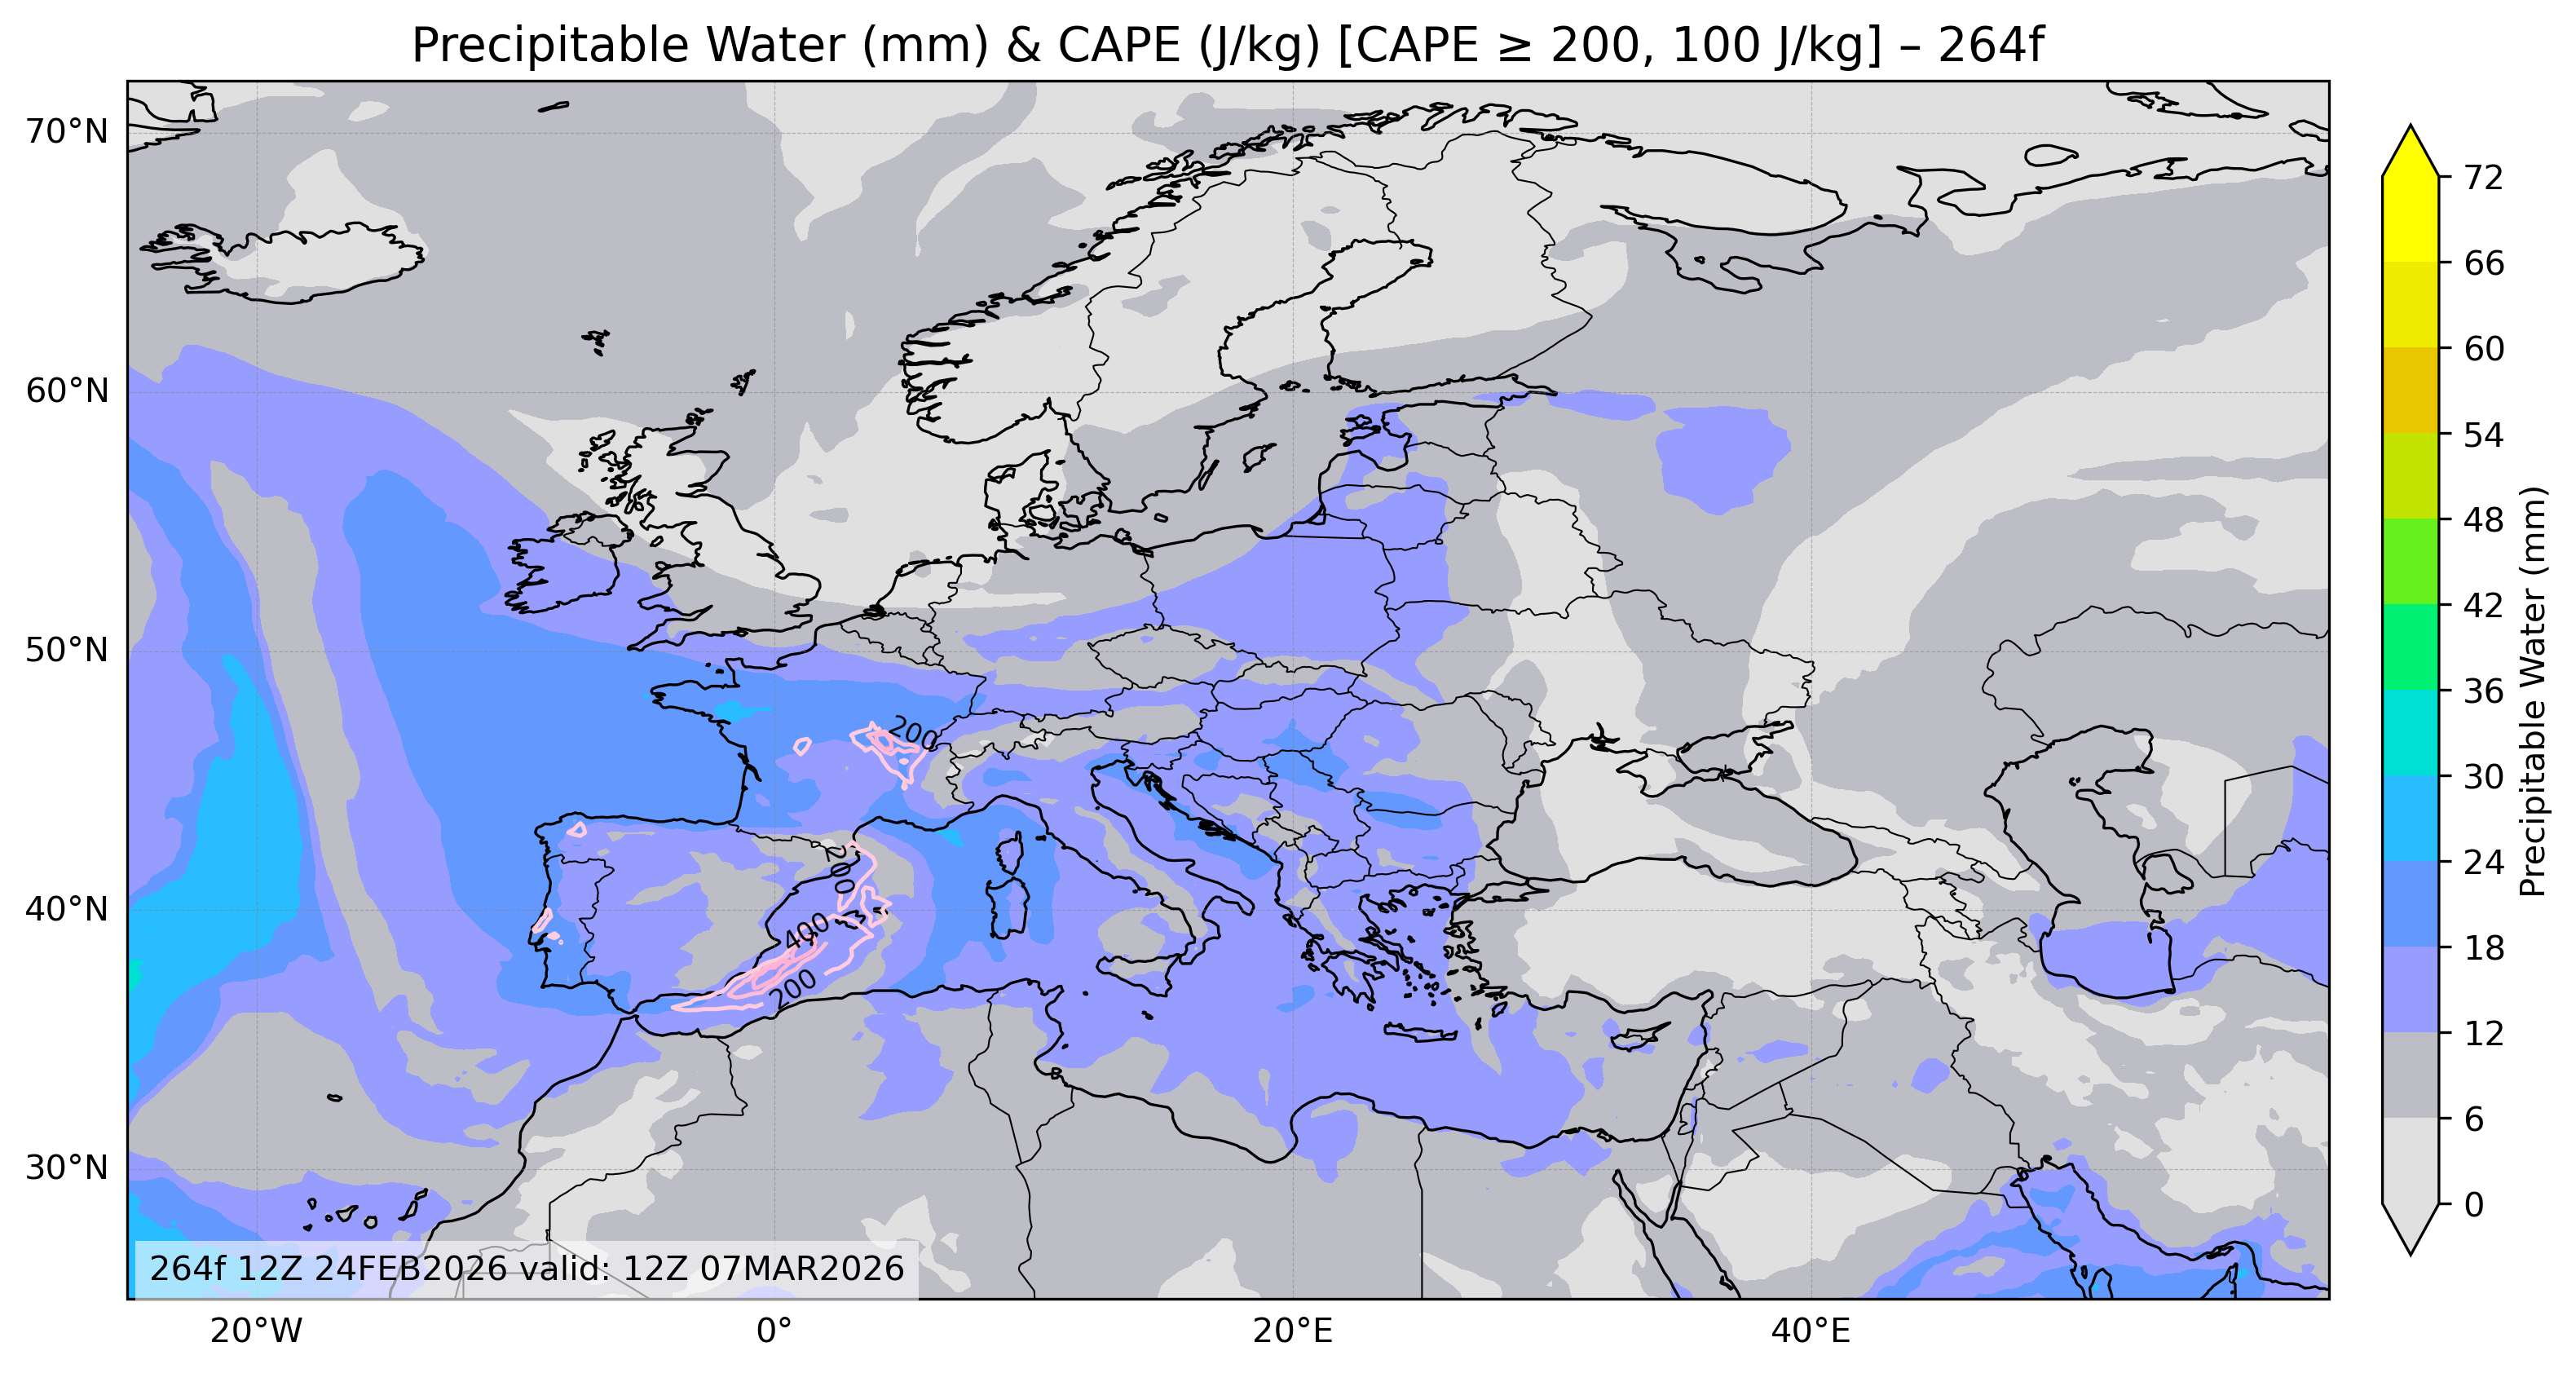
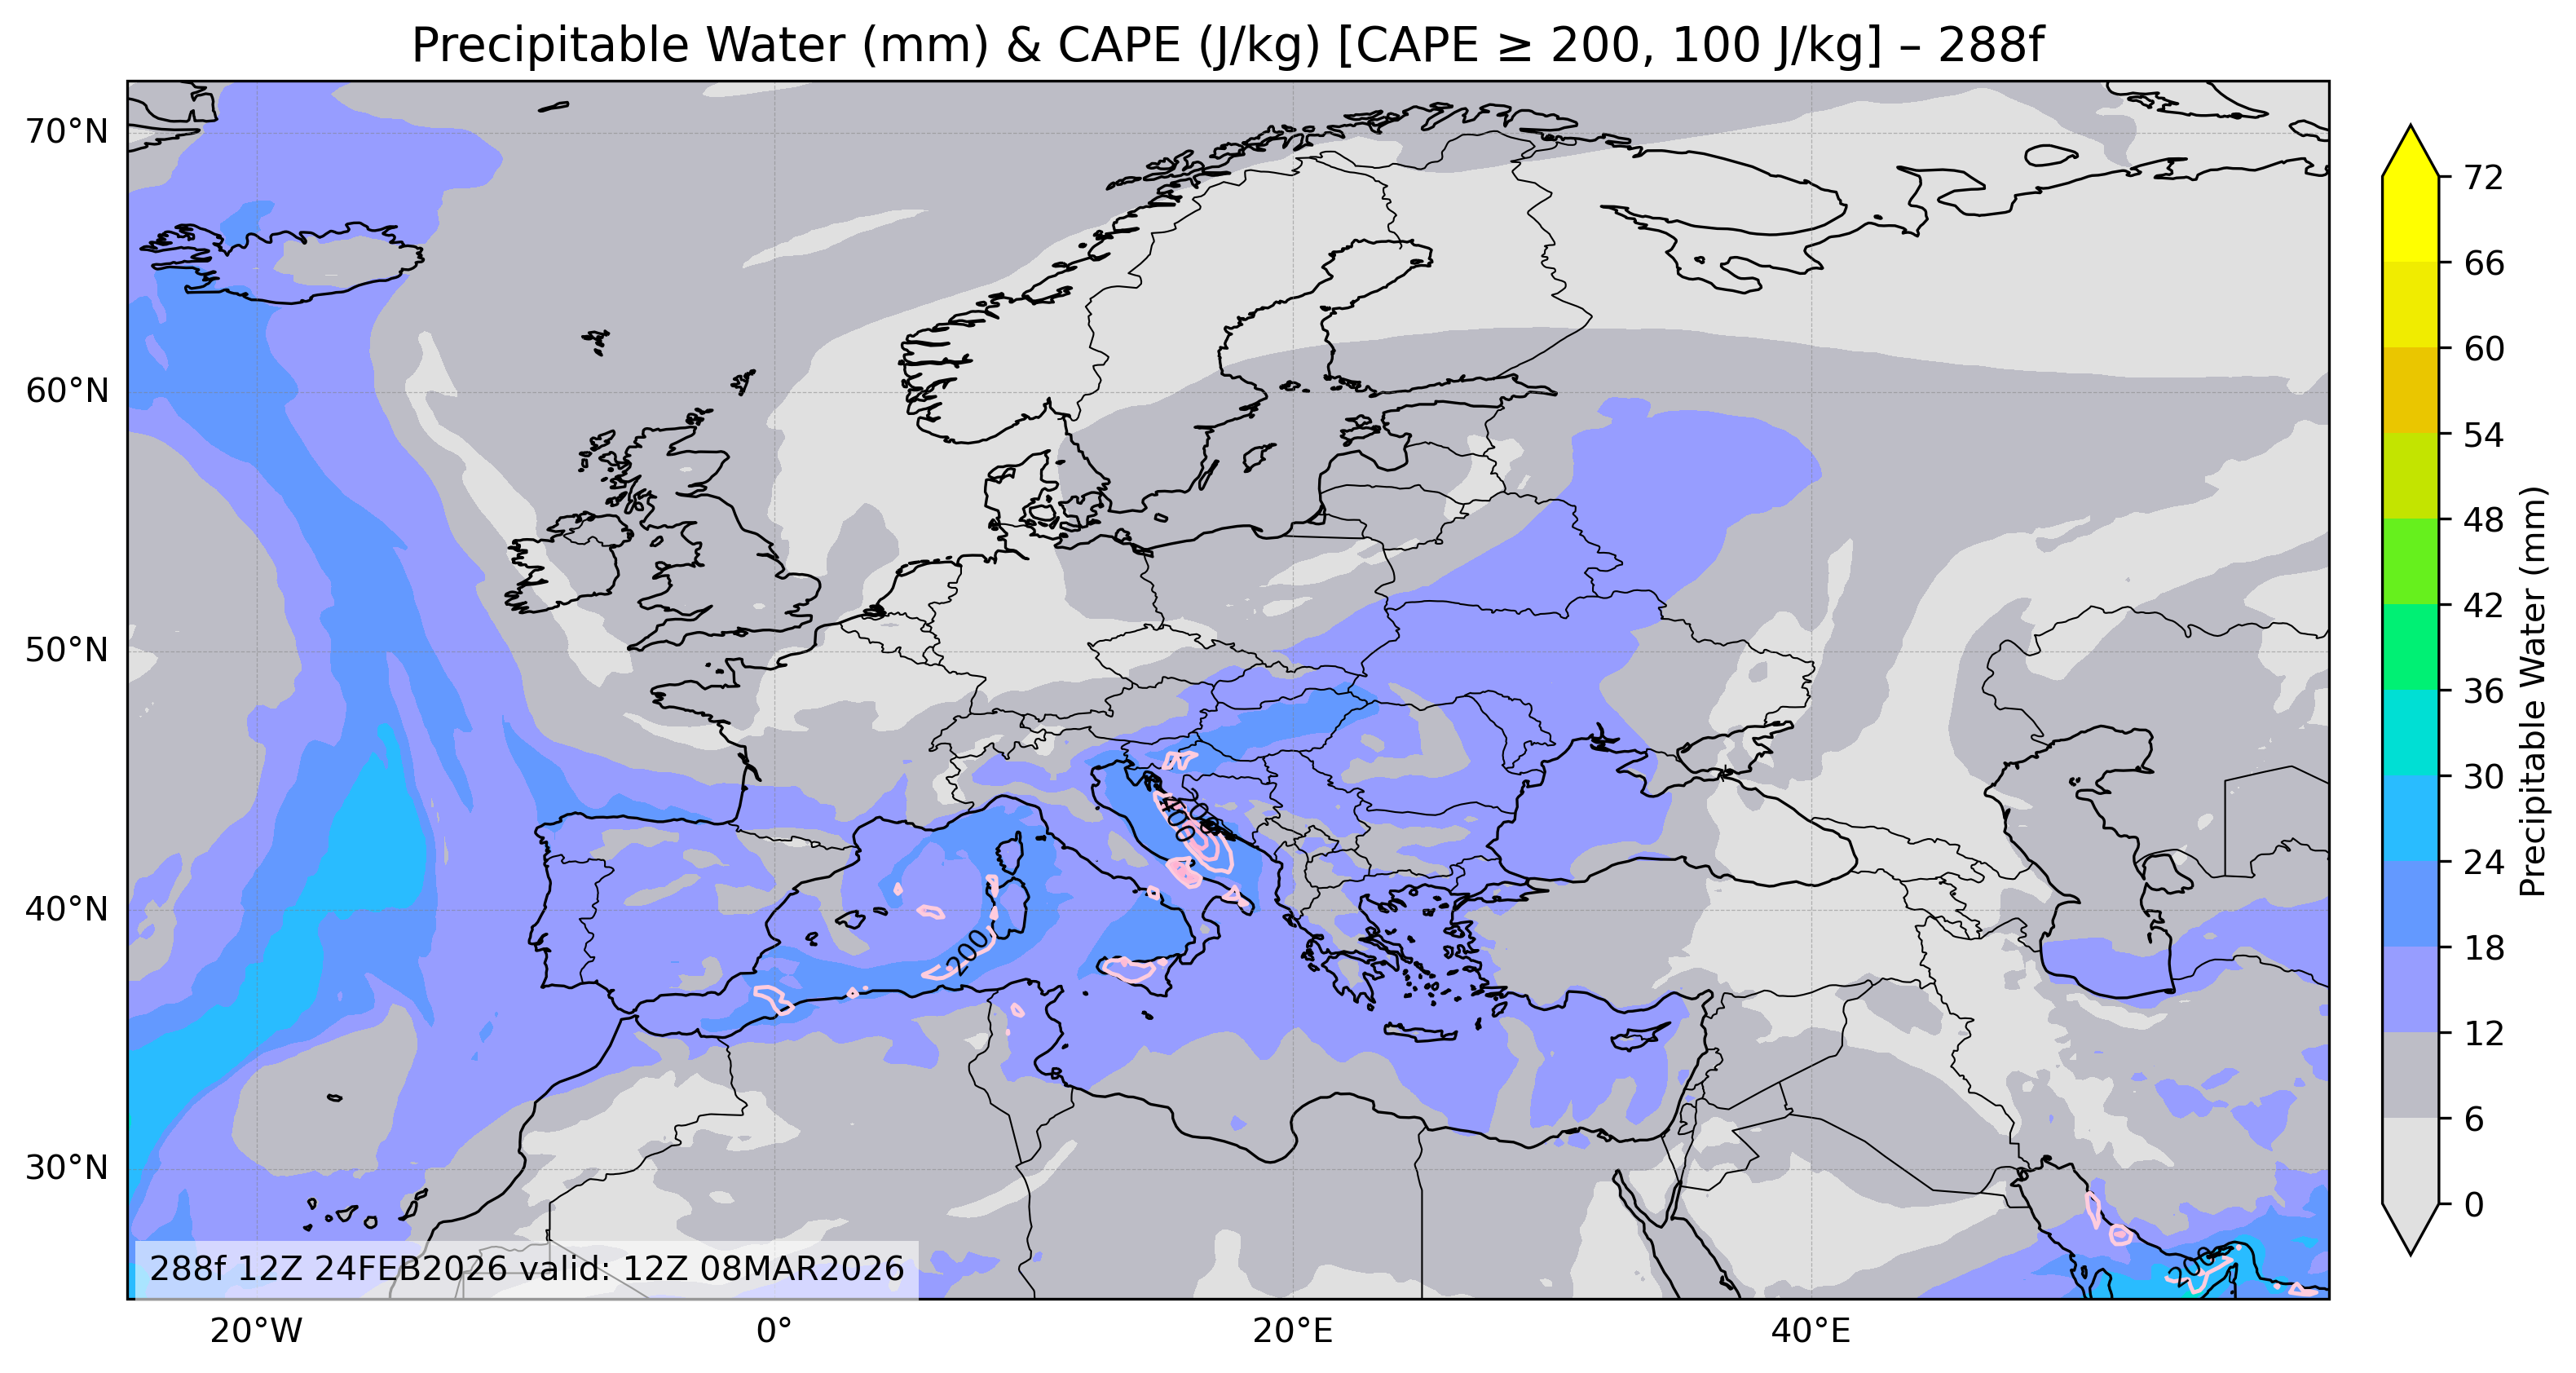
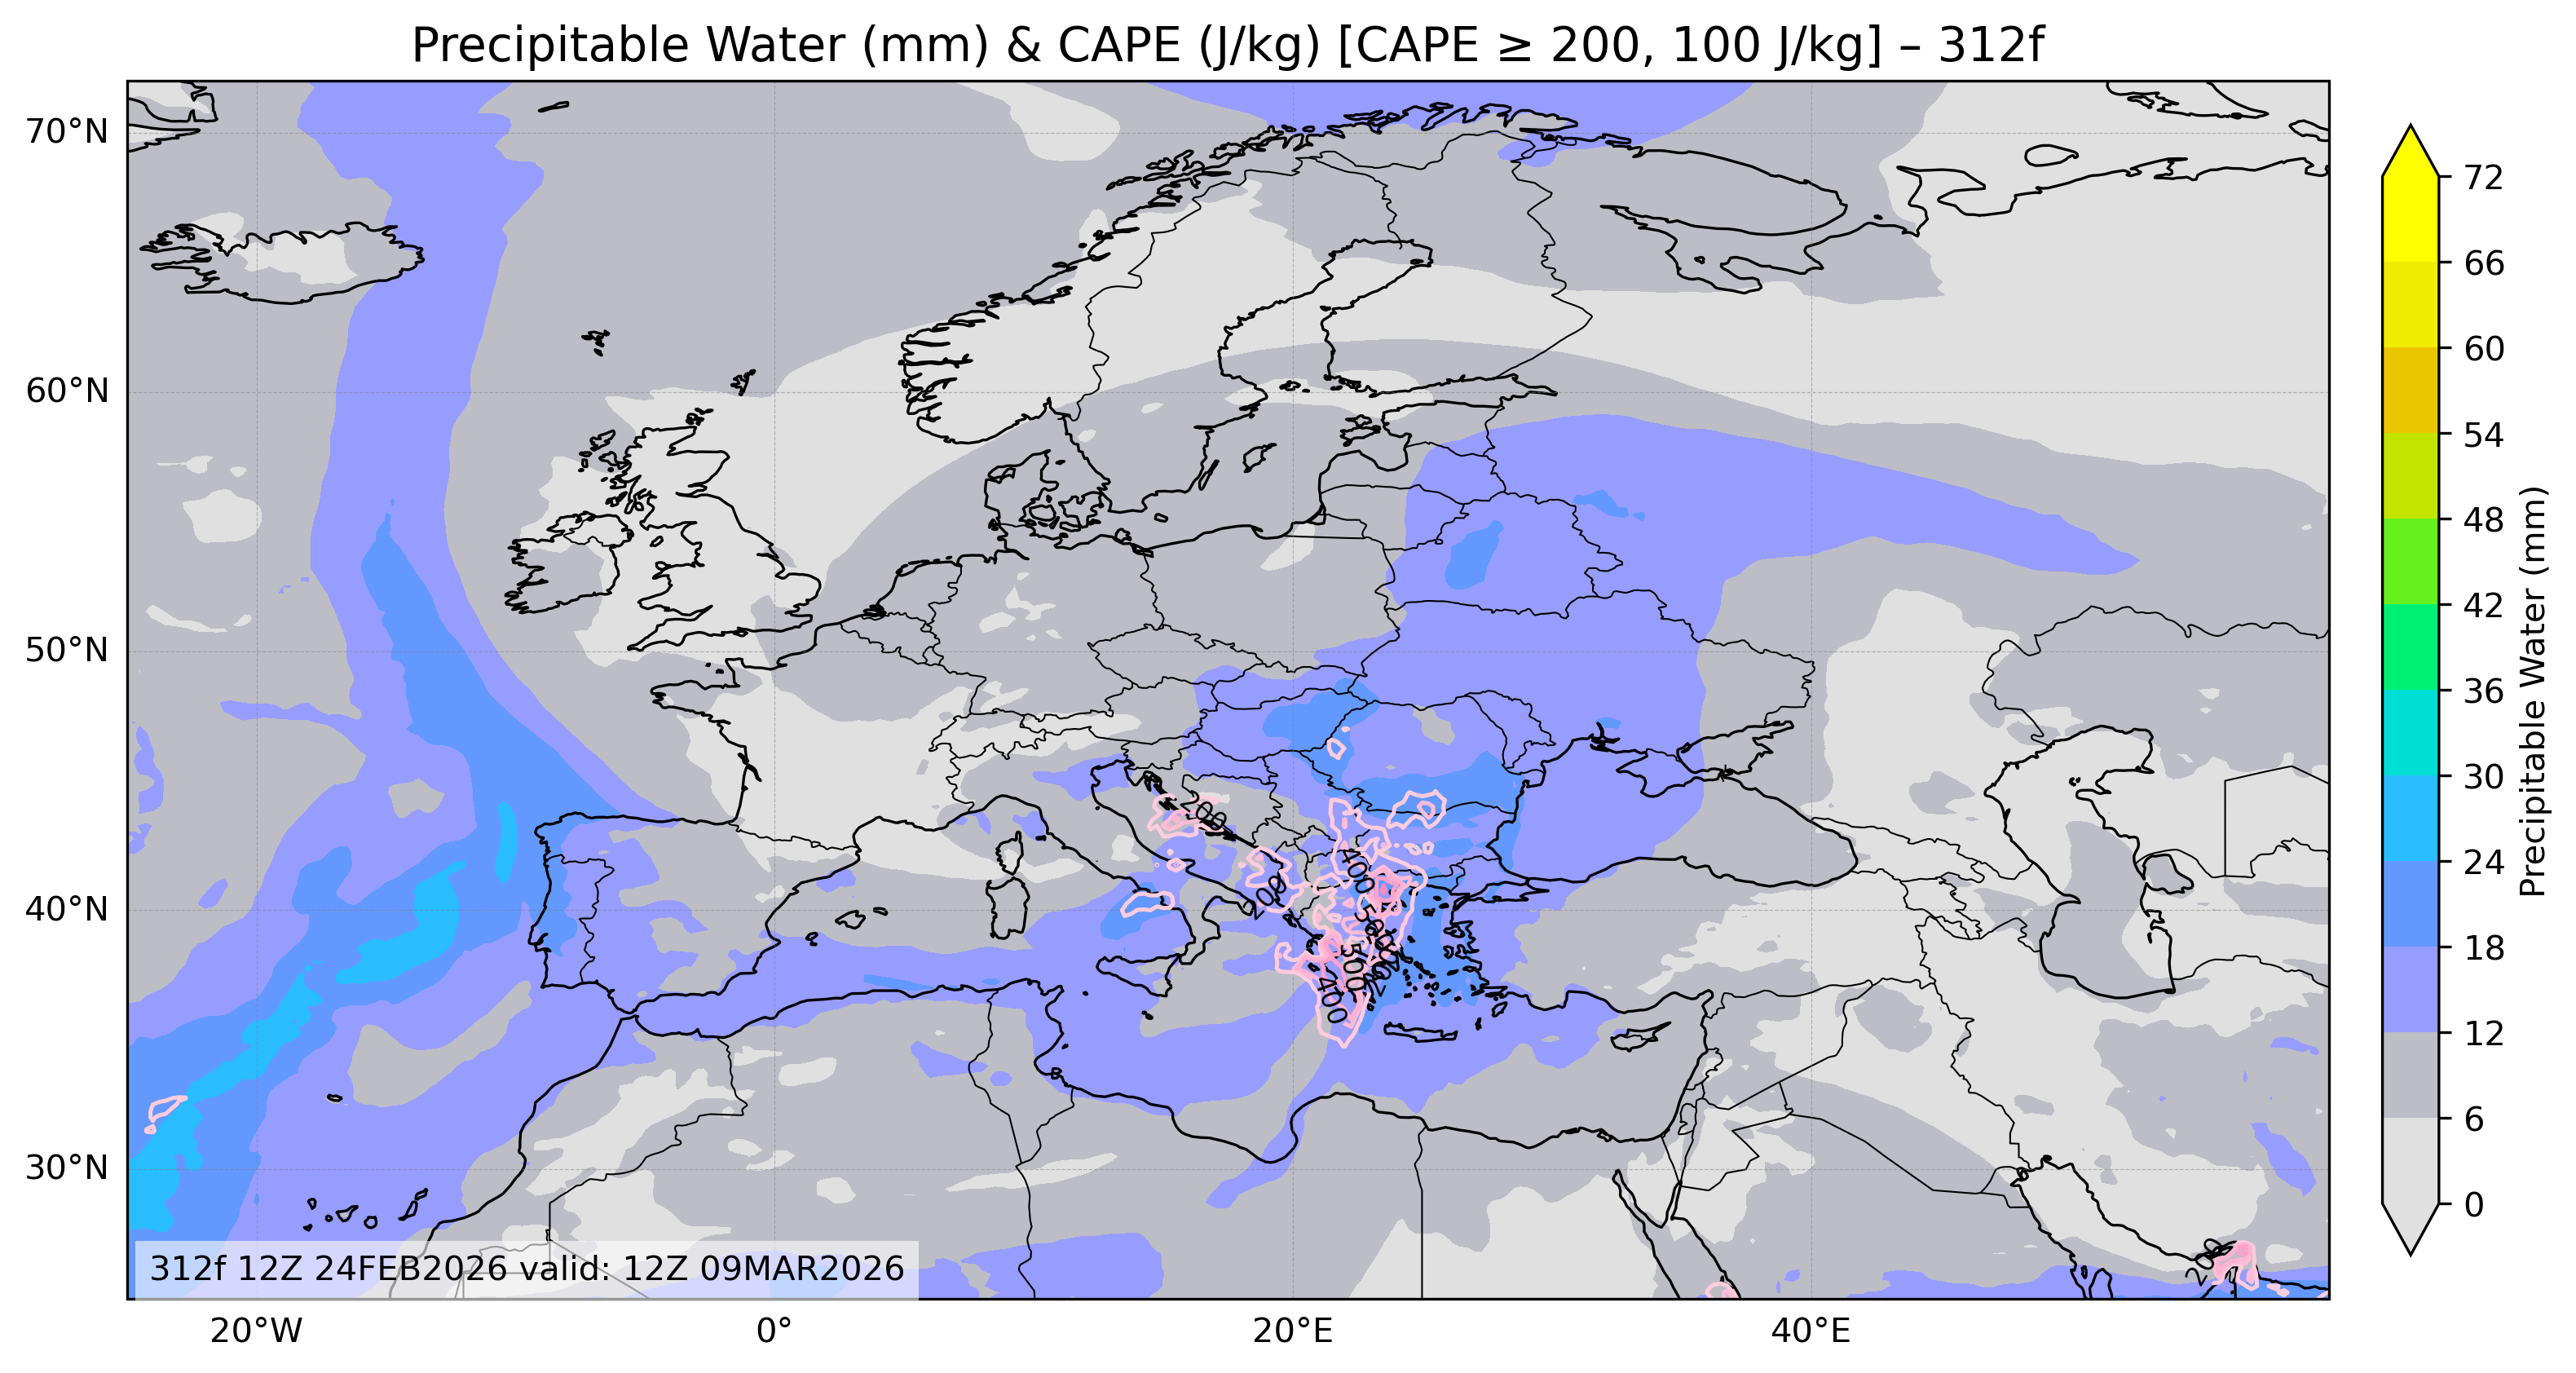
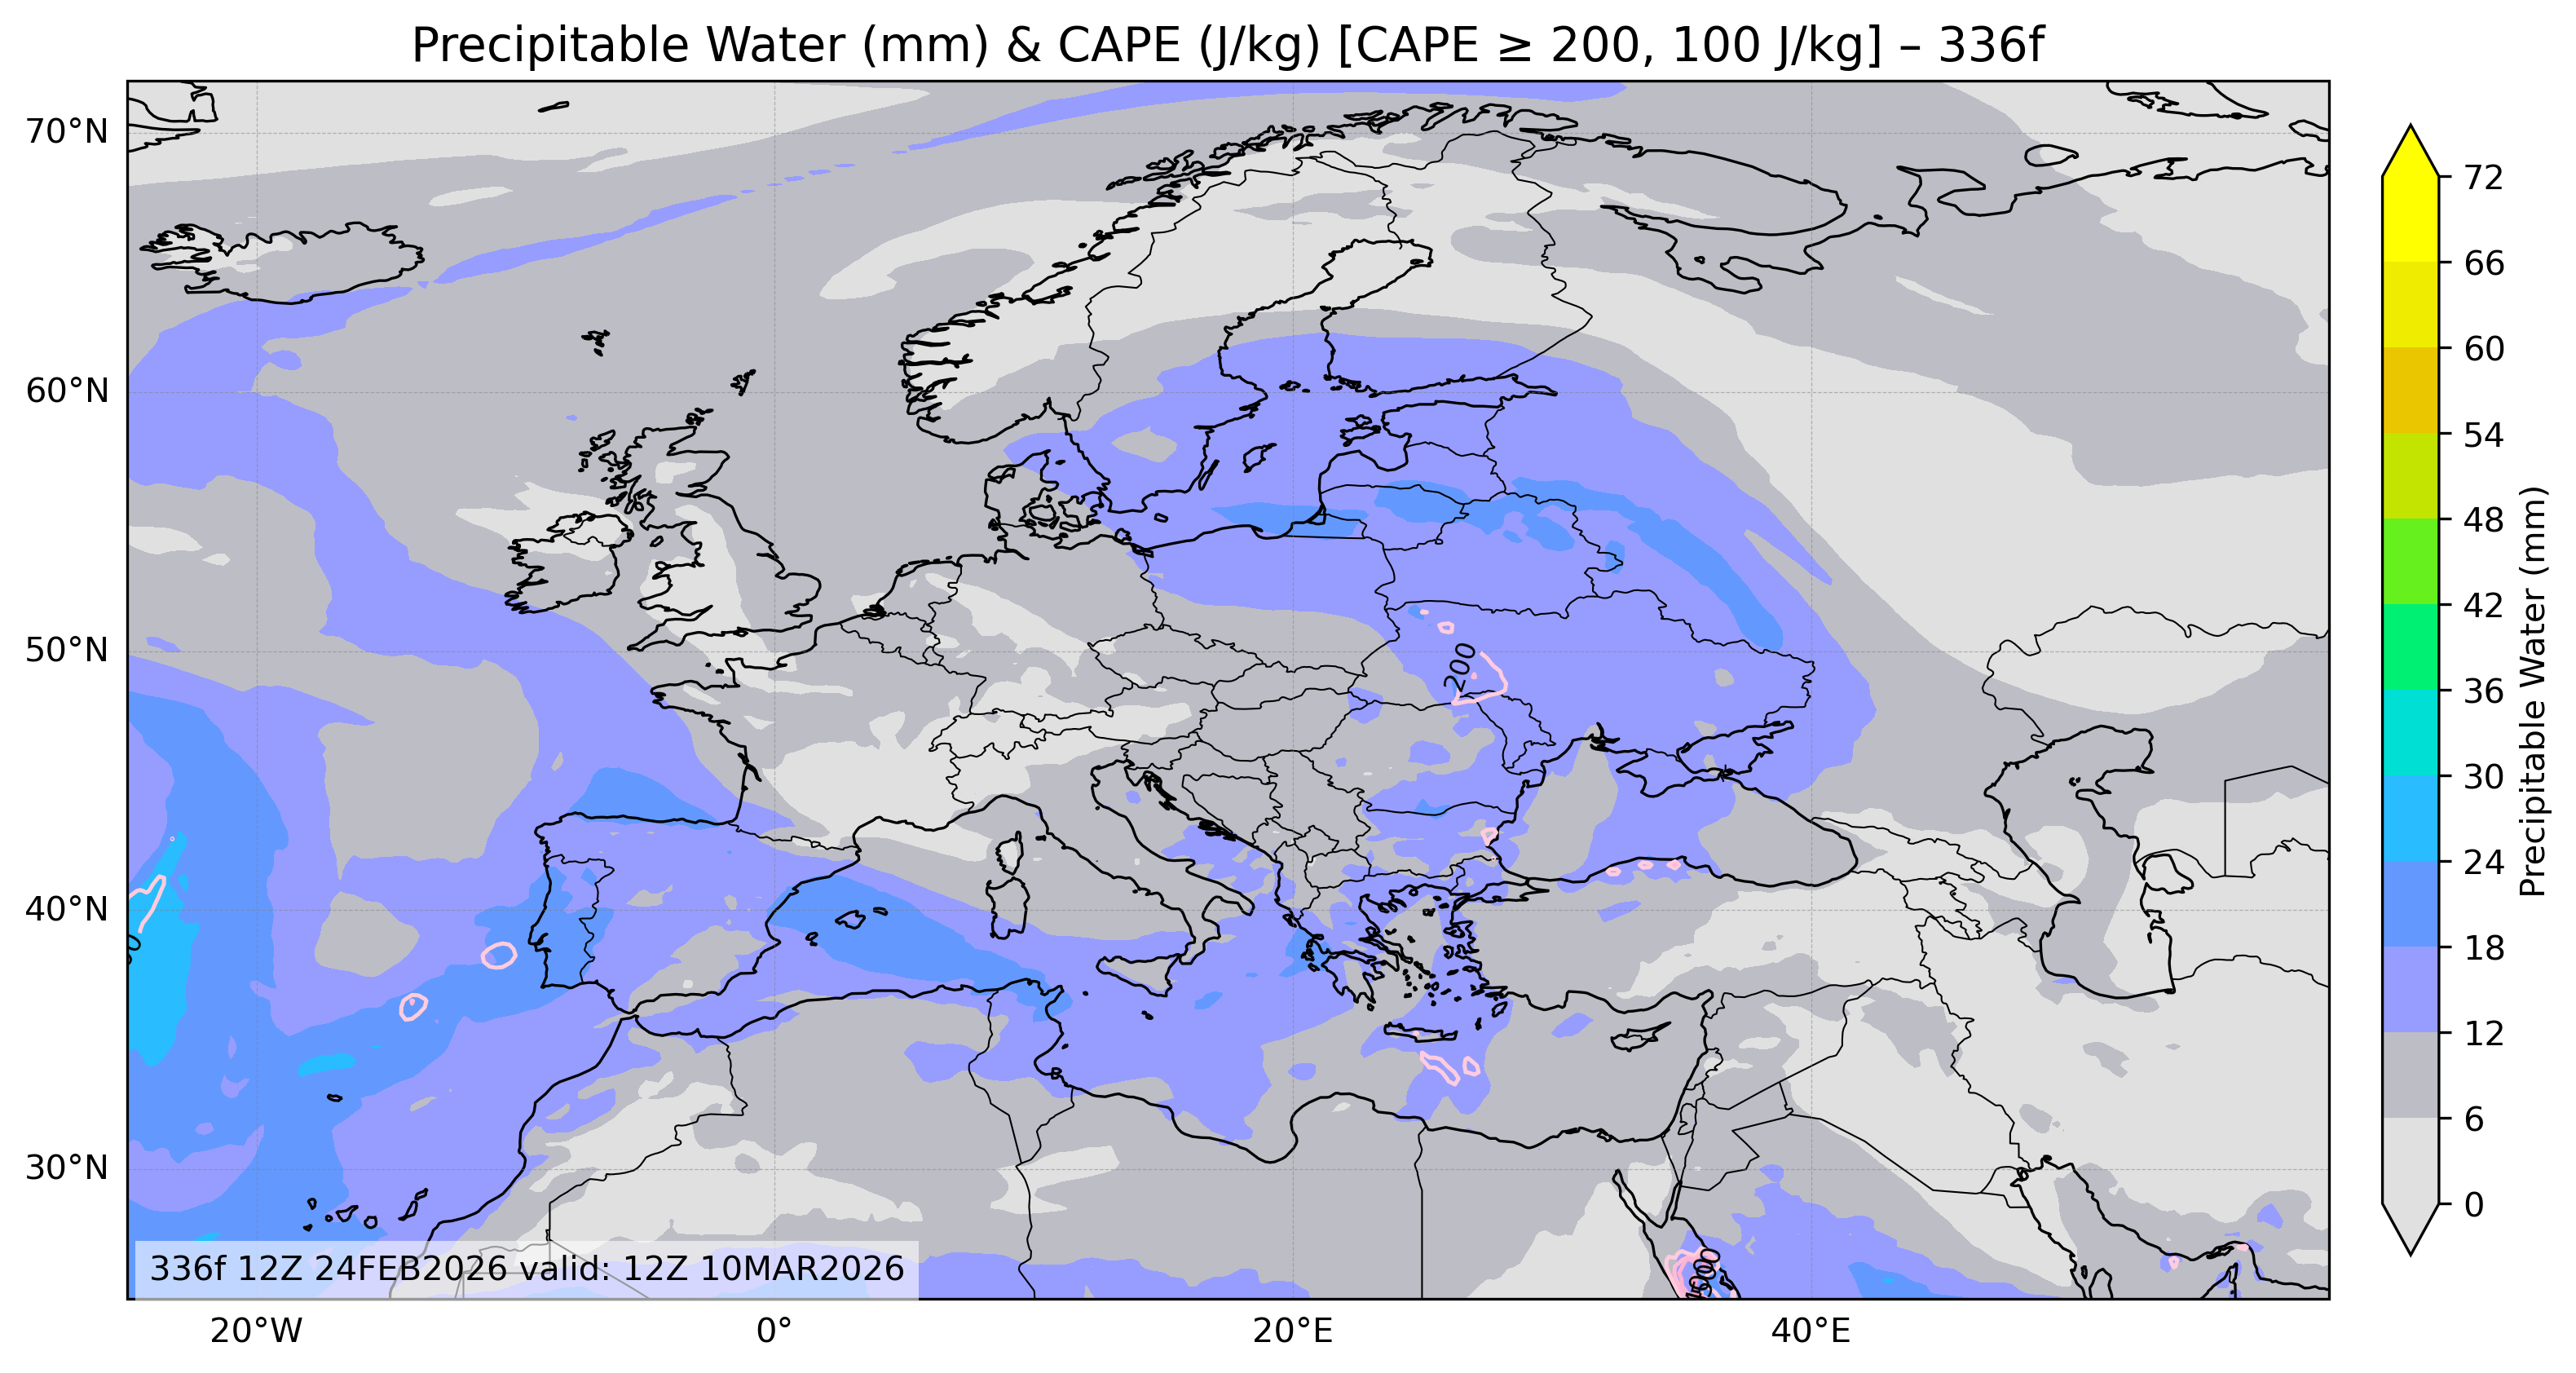
Precipitable Water & Convective Available Potential Energy (CAPE)
The Precipitable Water & CAPE maps combine moisture and instability analysis, revealing areas with potential for heavy rainfall or thunderstorms. High CAPE values and elevated precipitable water content signal favorable environments for convective storms, especially when supported by strong low-level convergence.
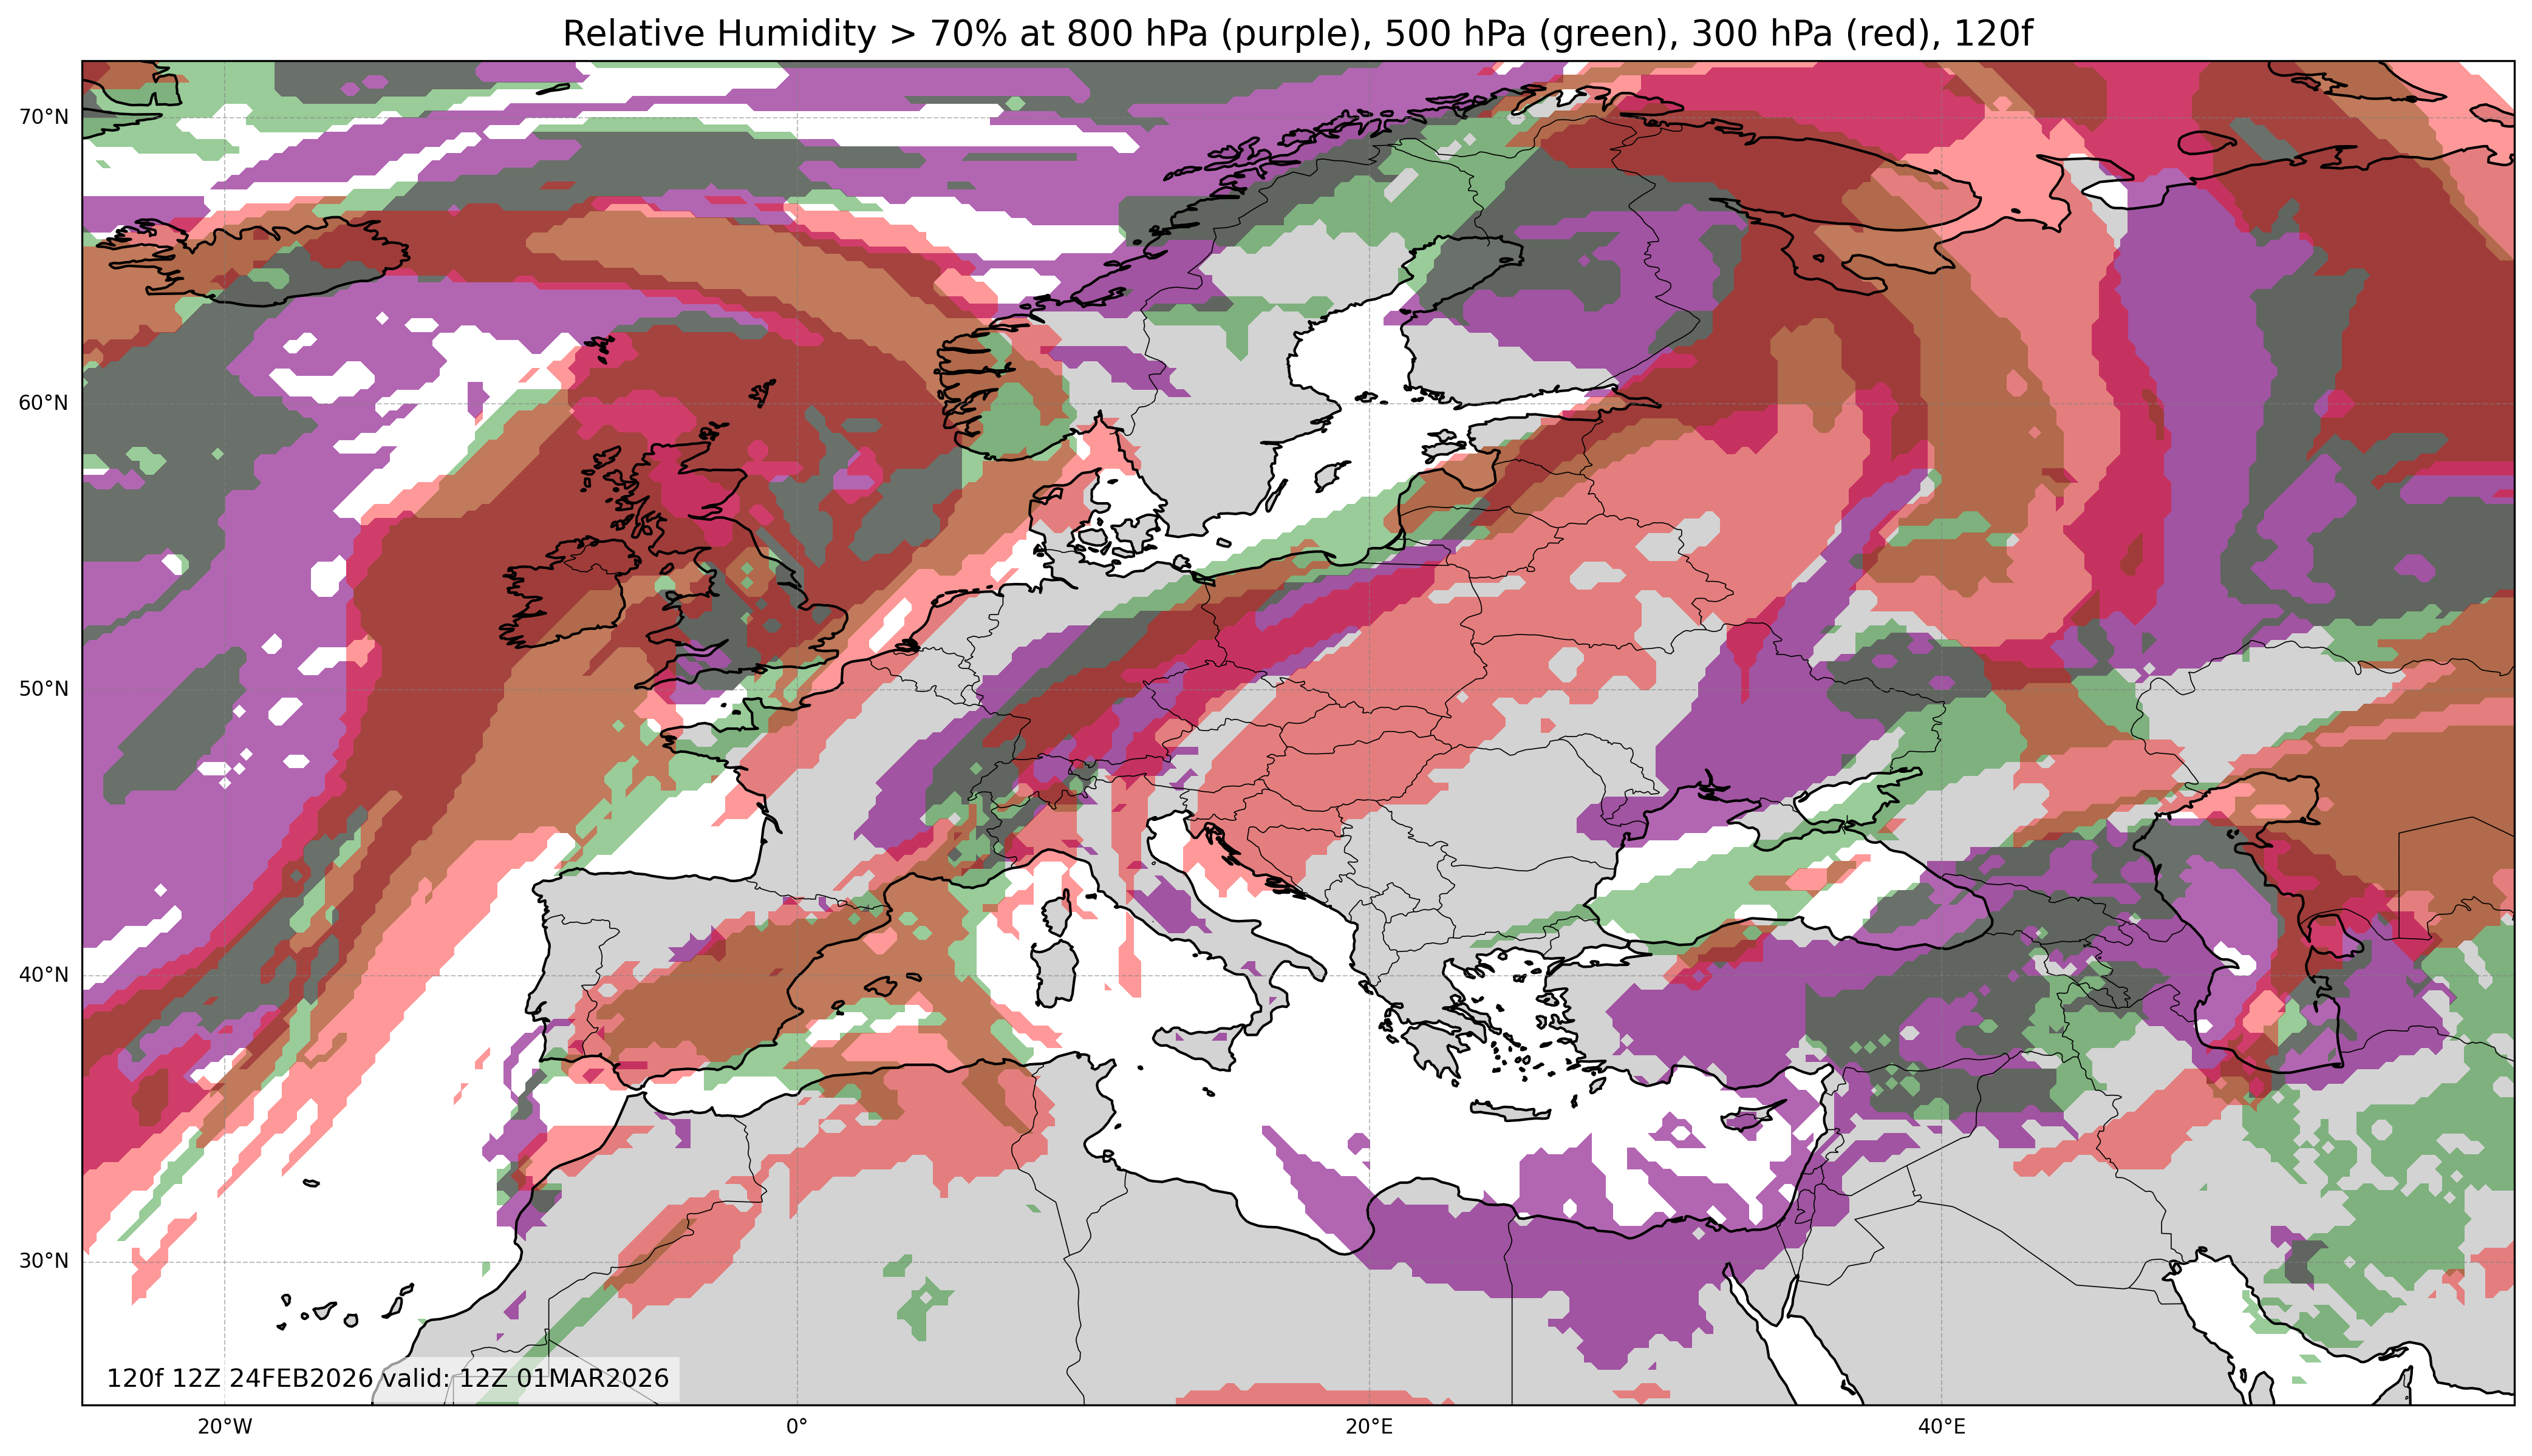
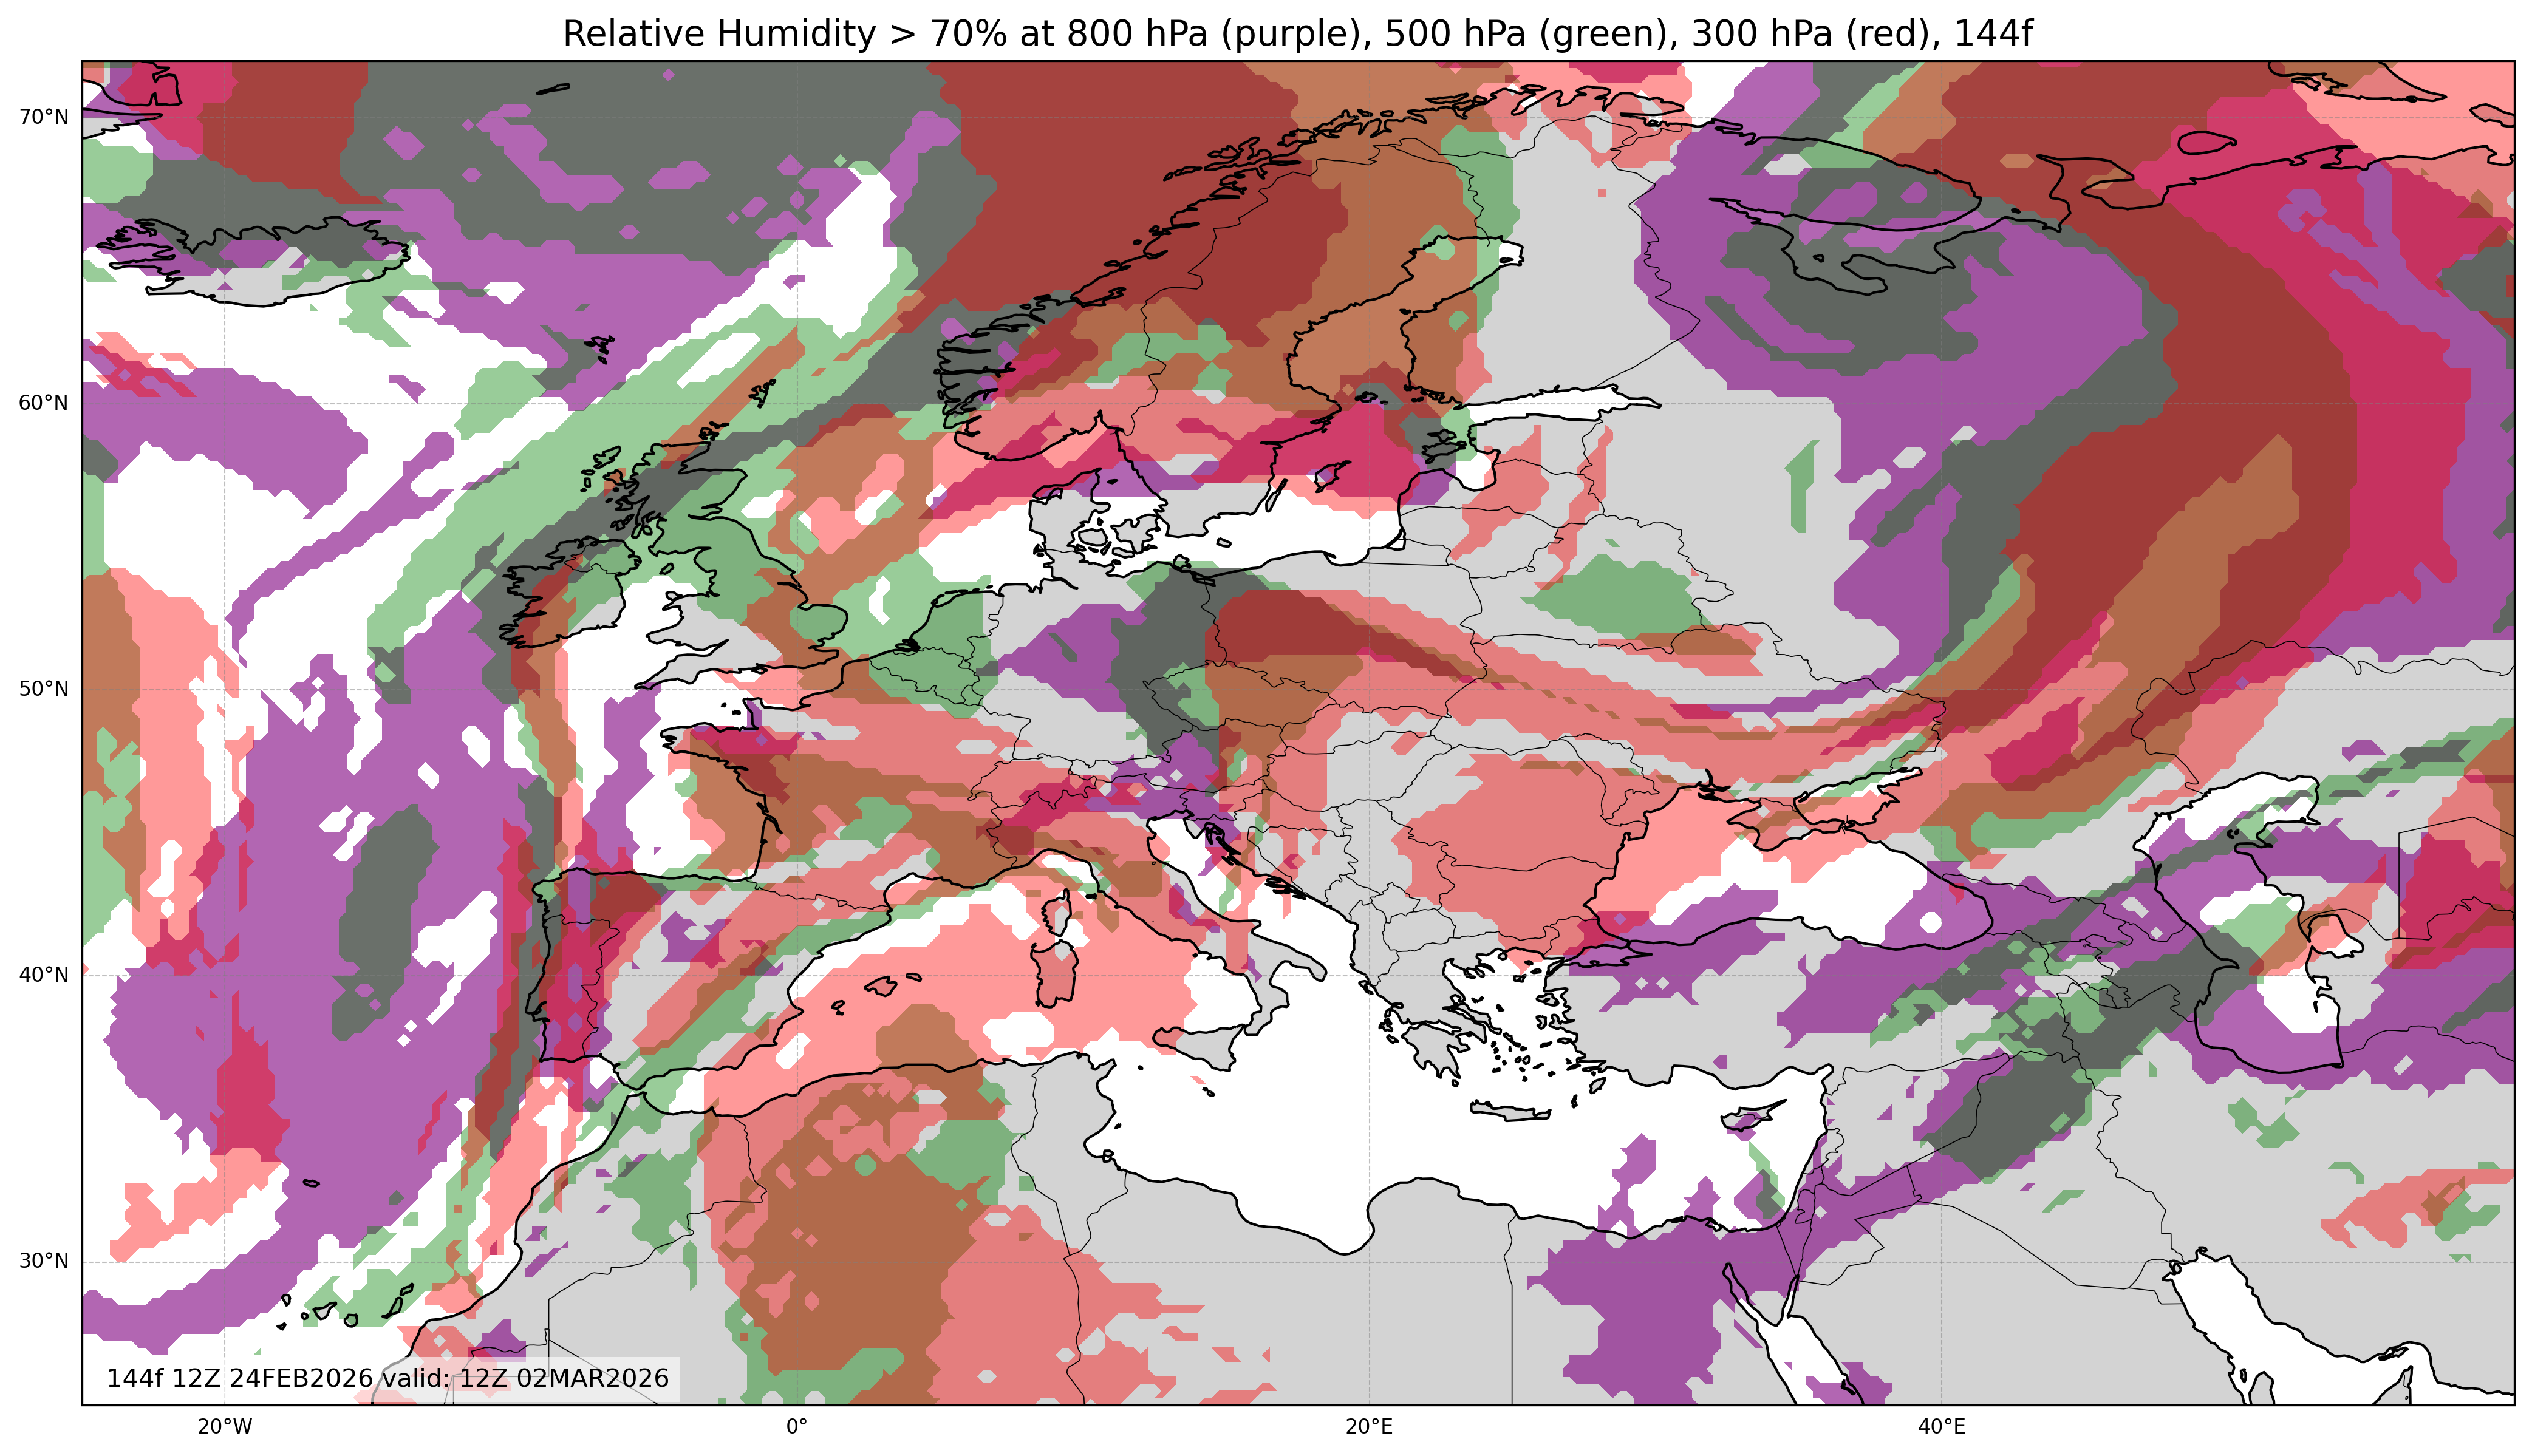
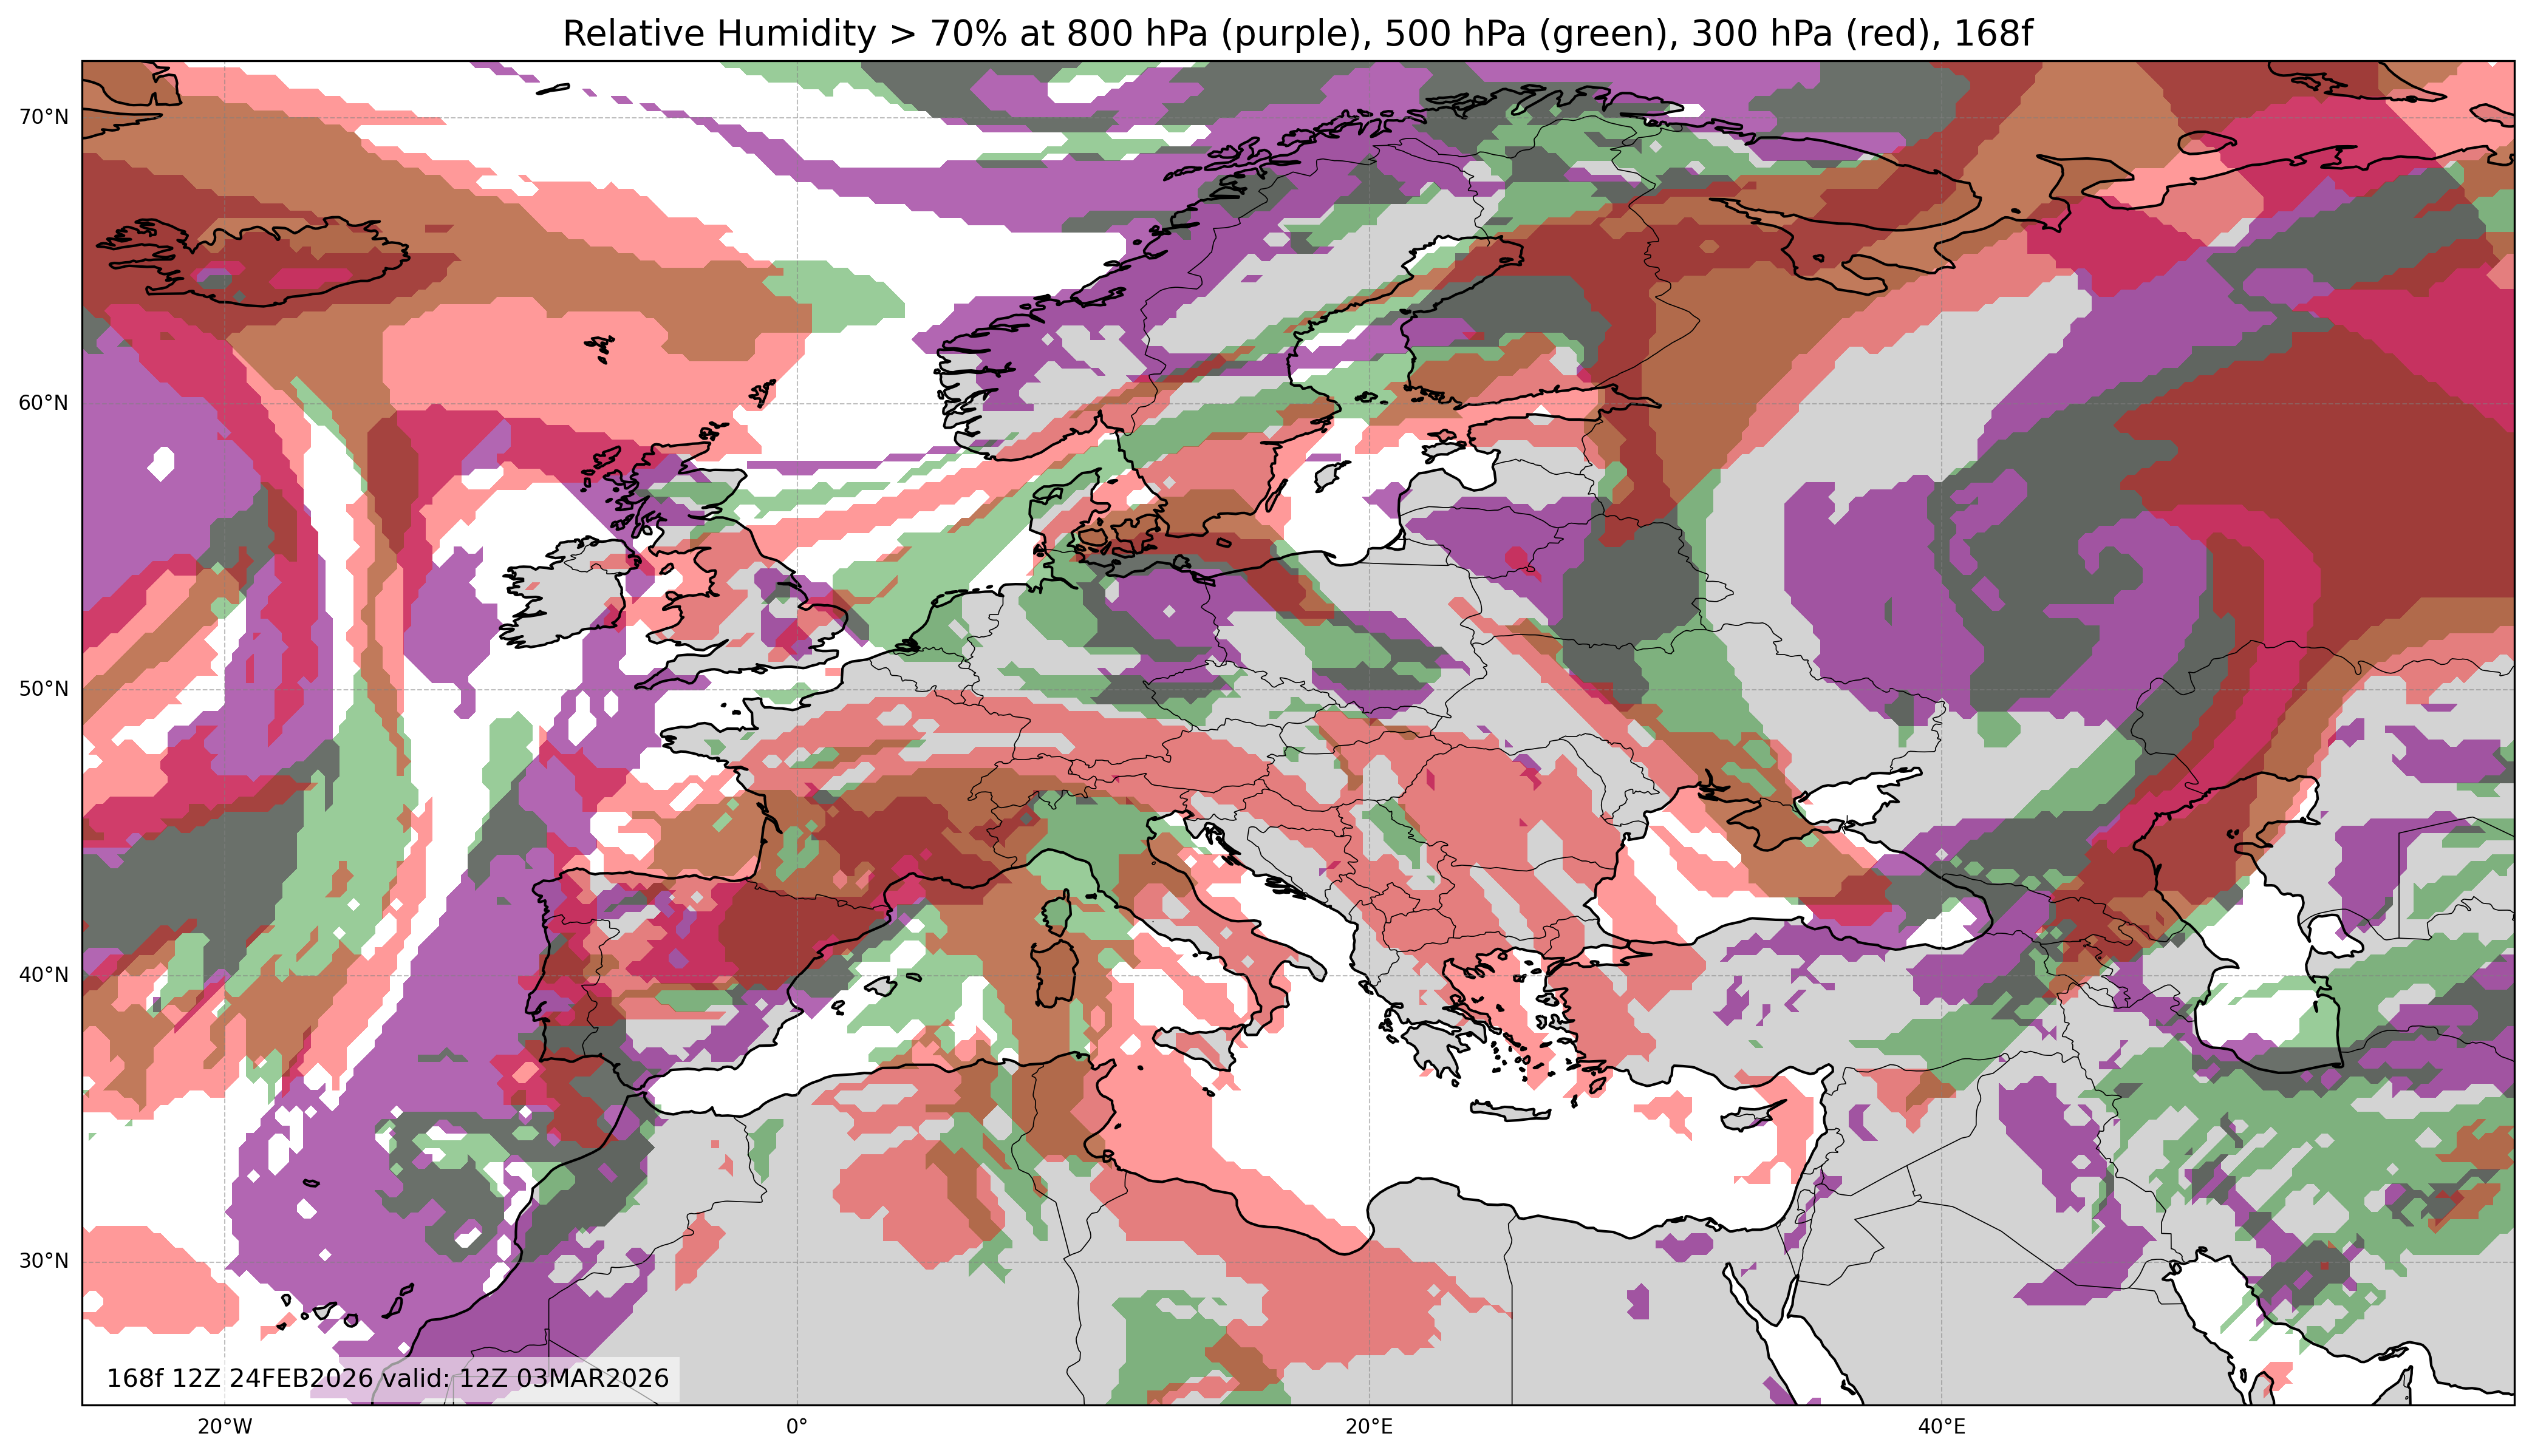
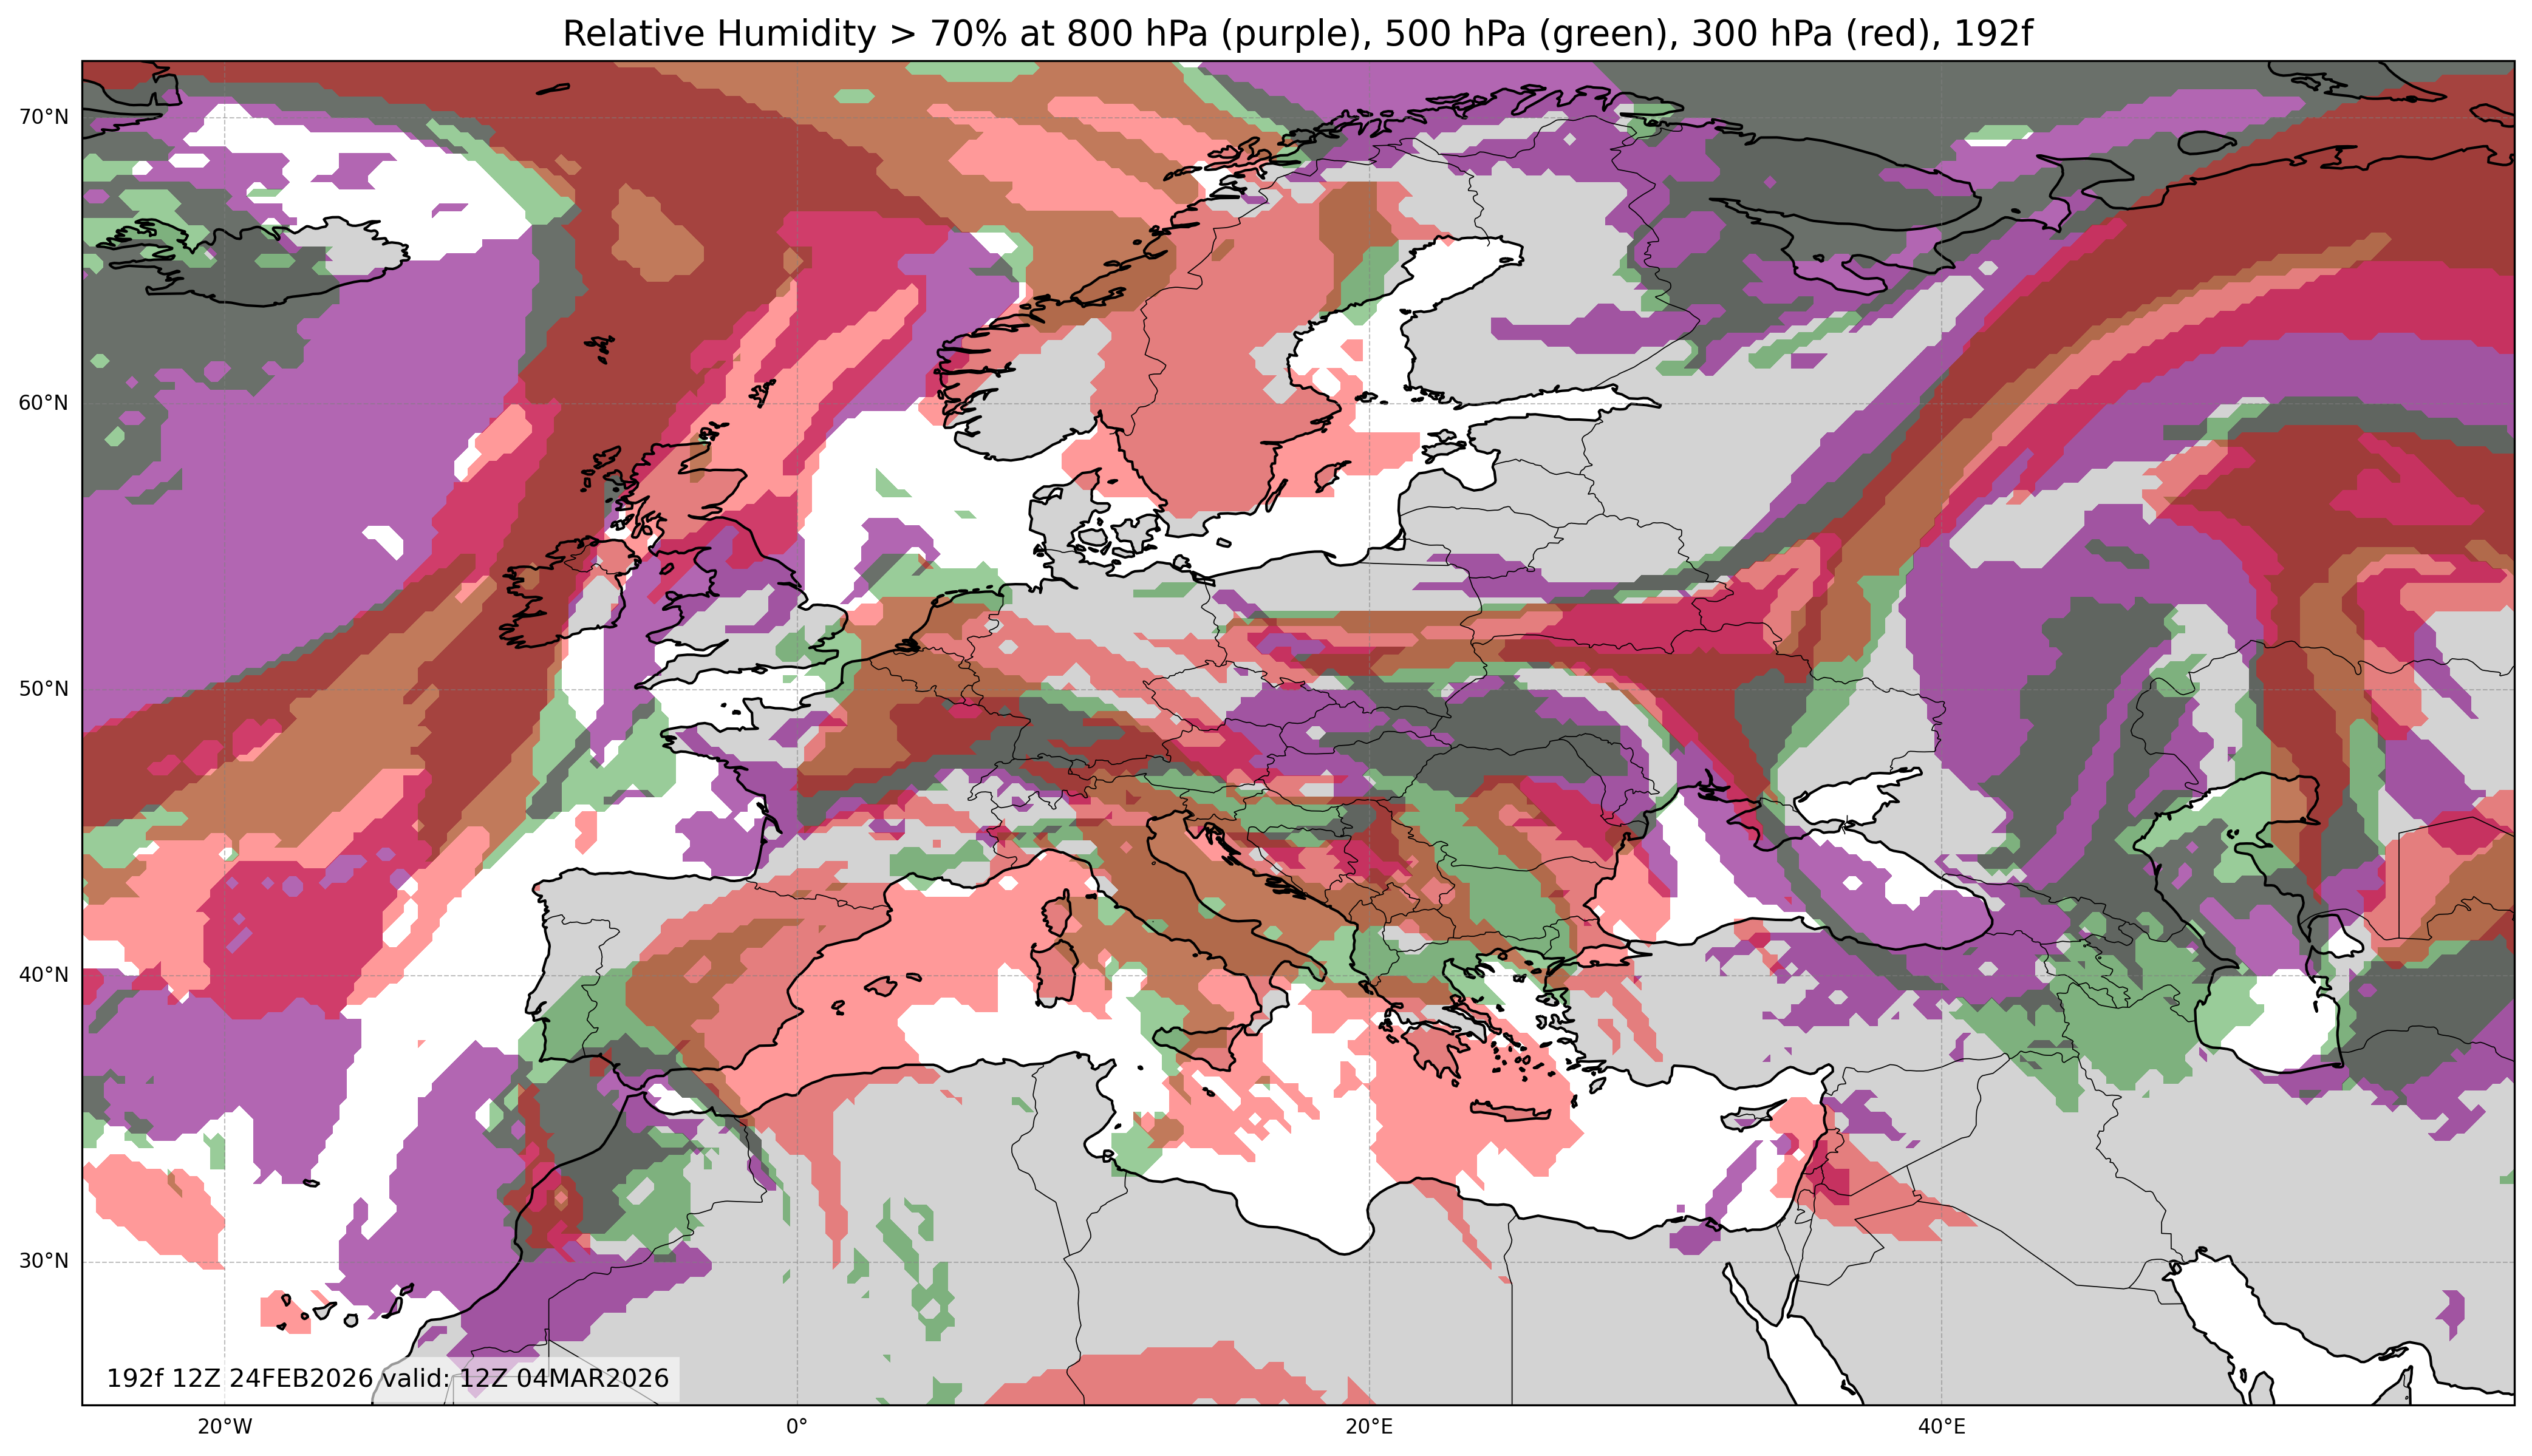
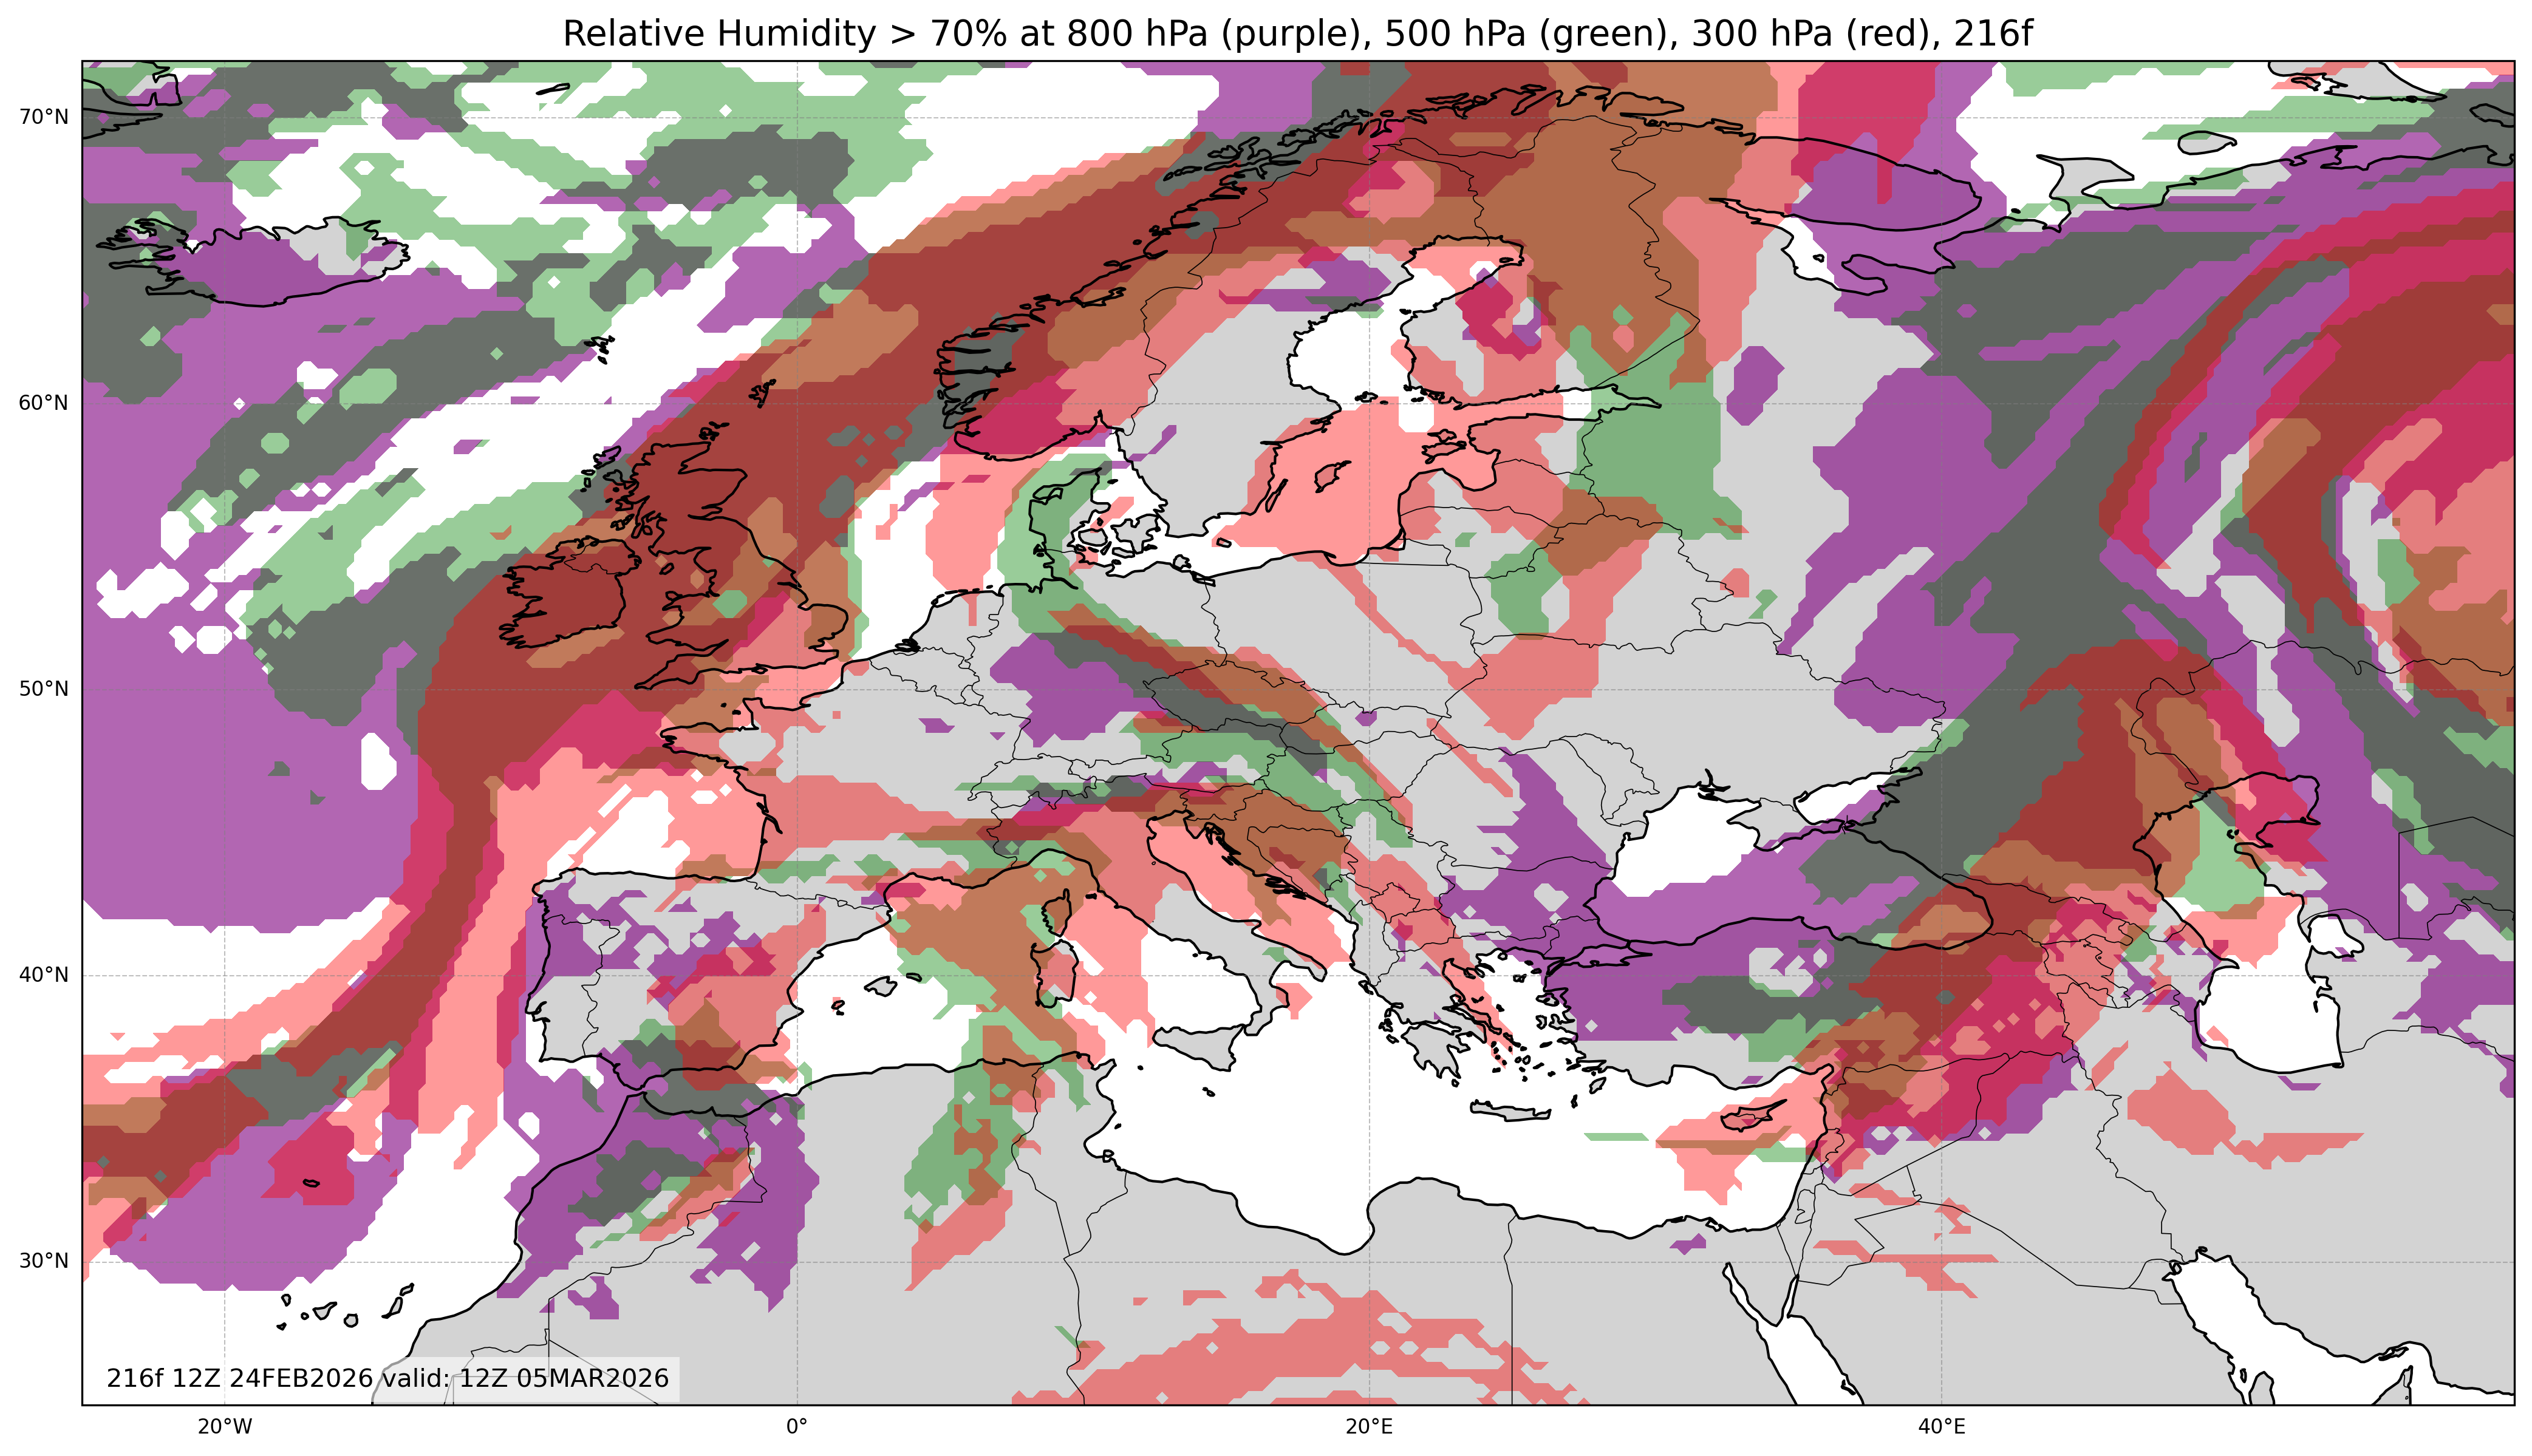
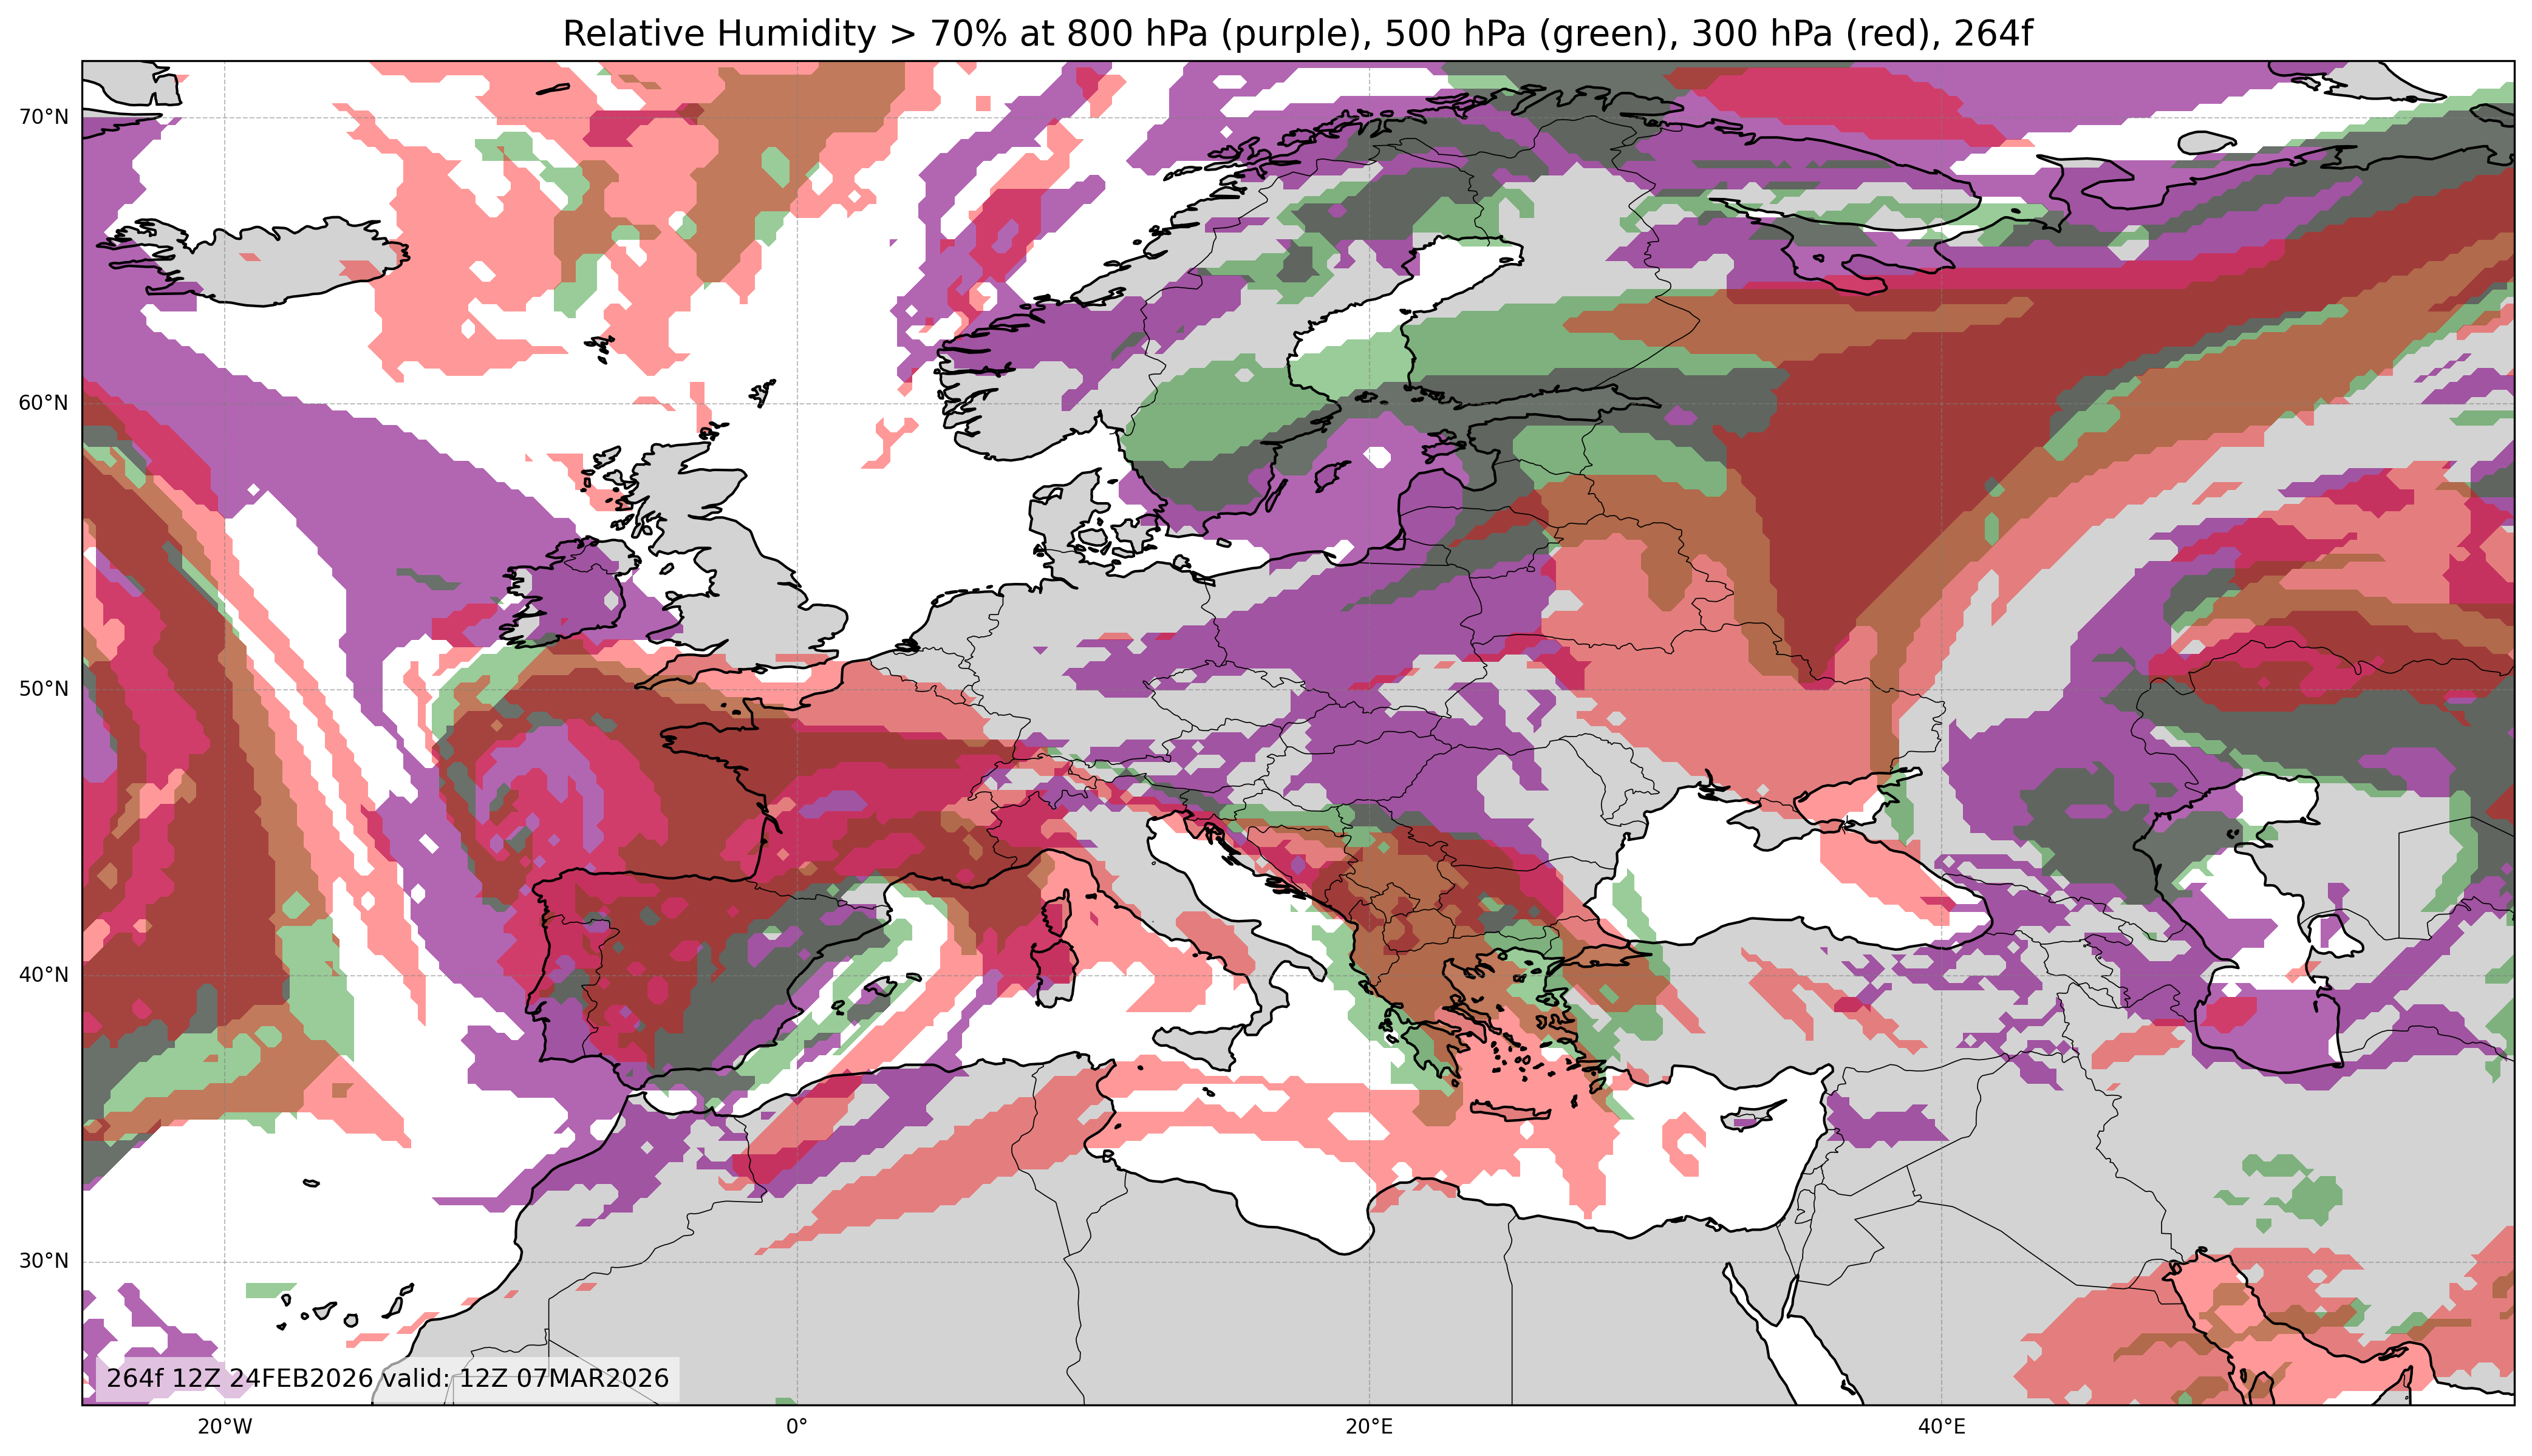
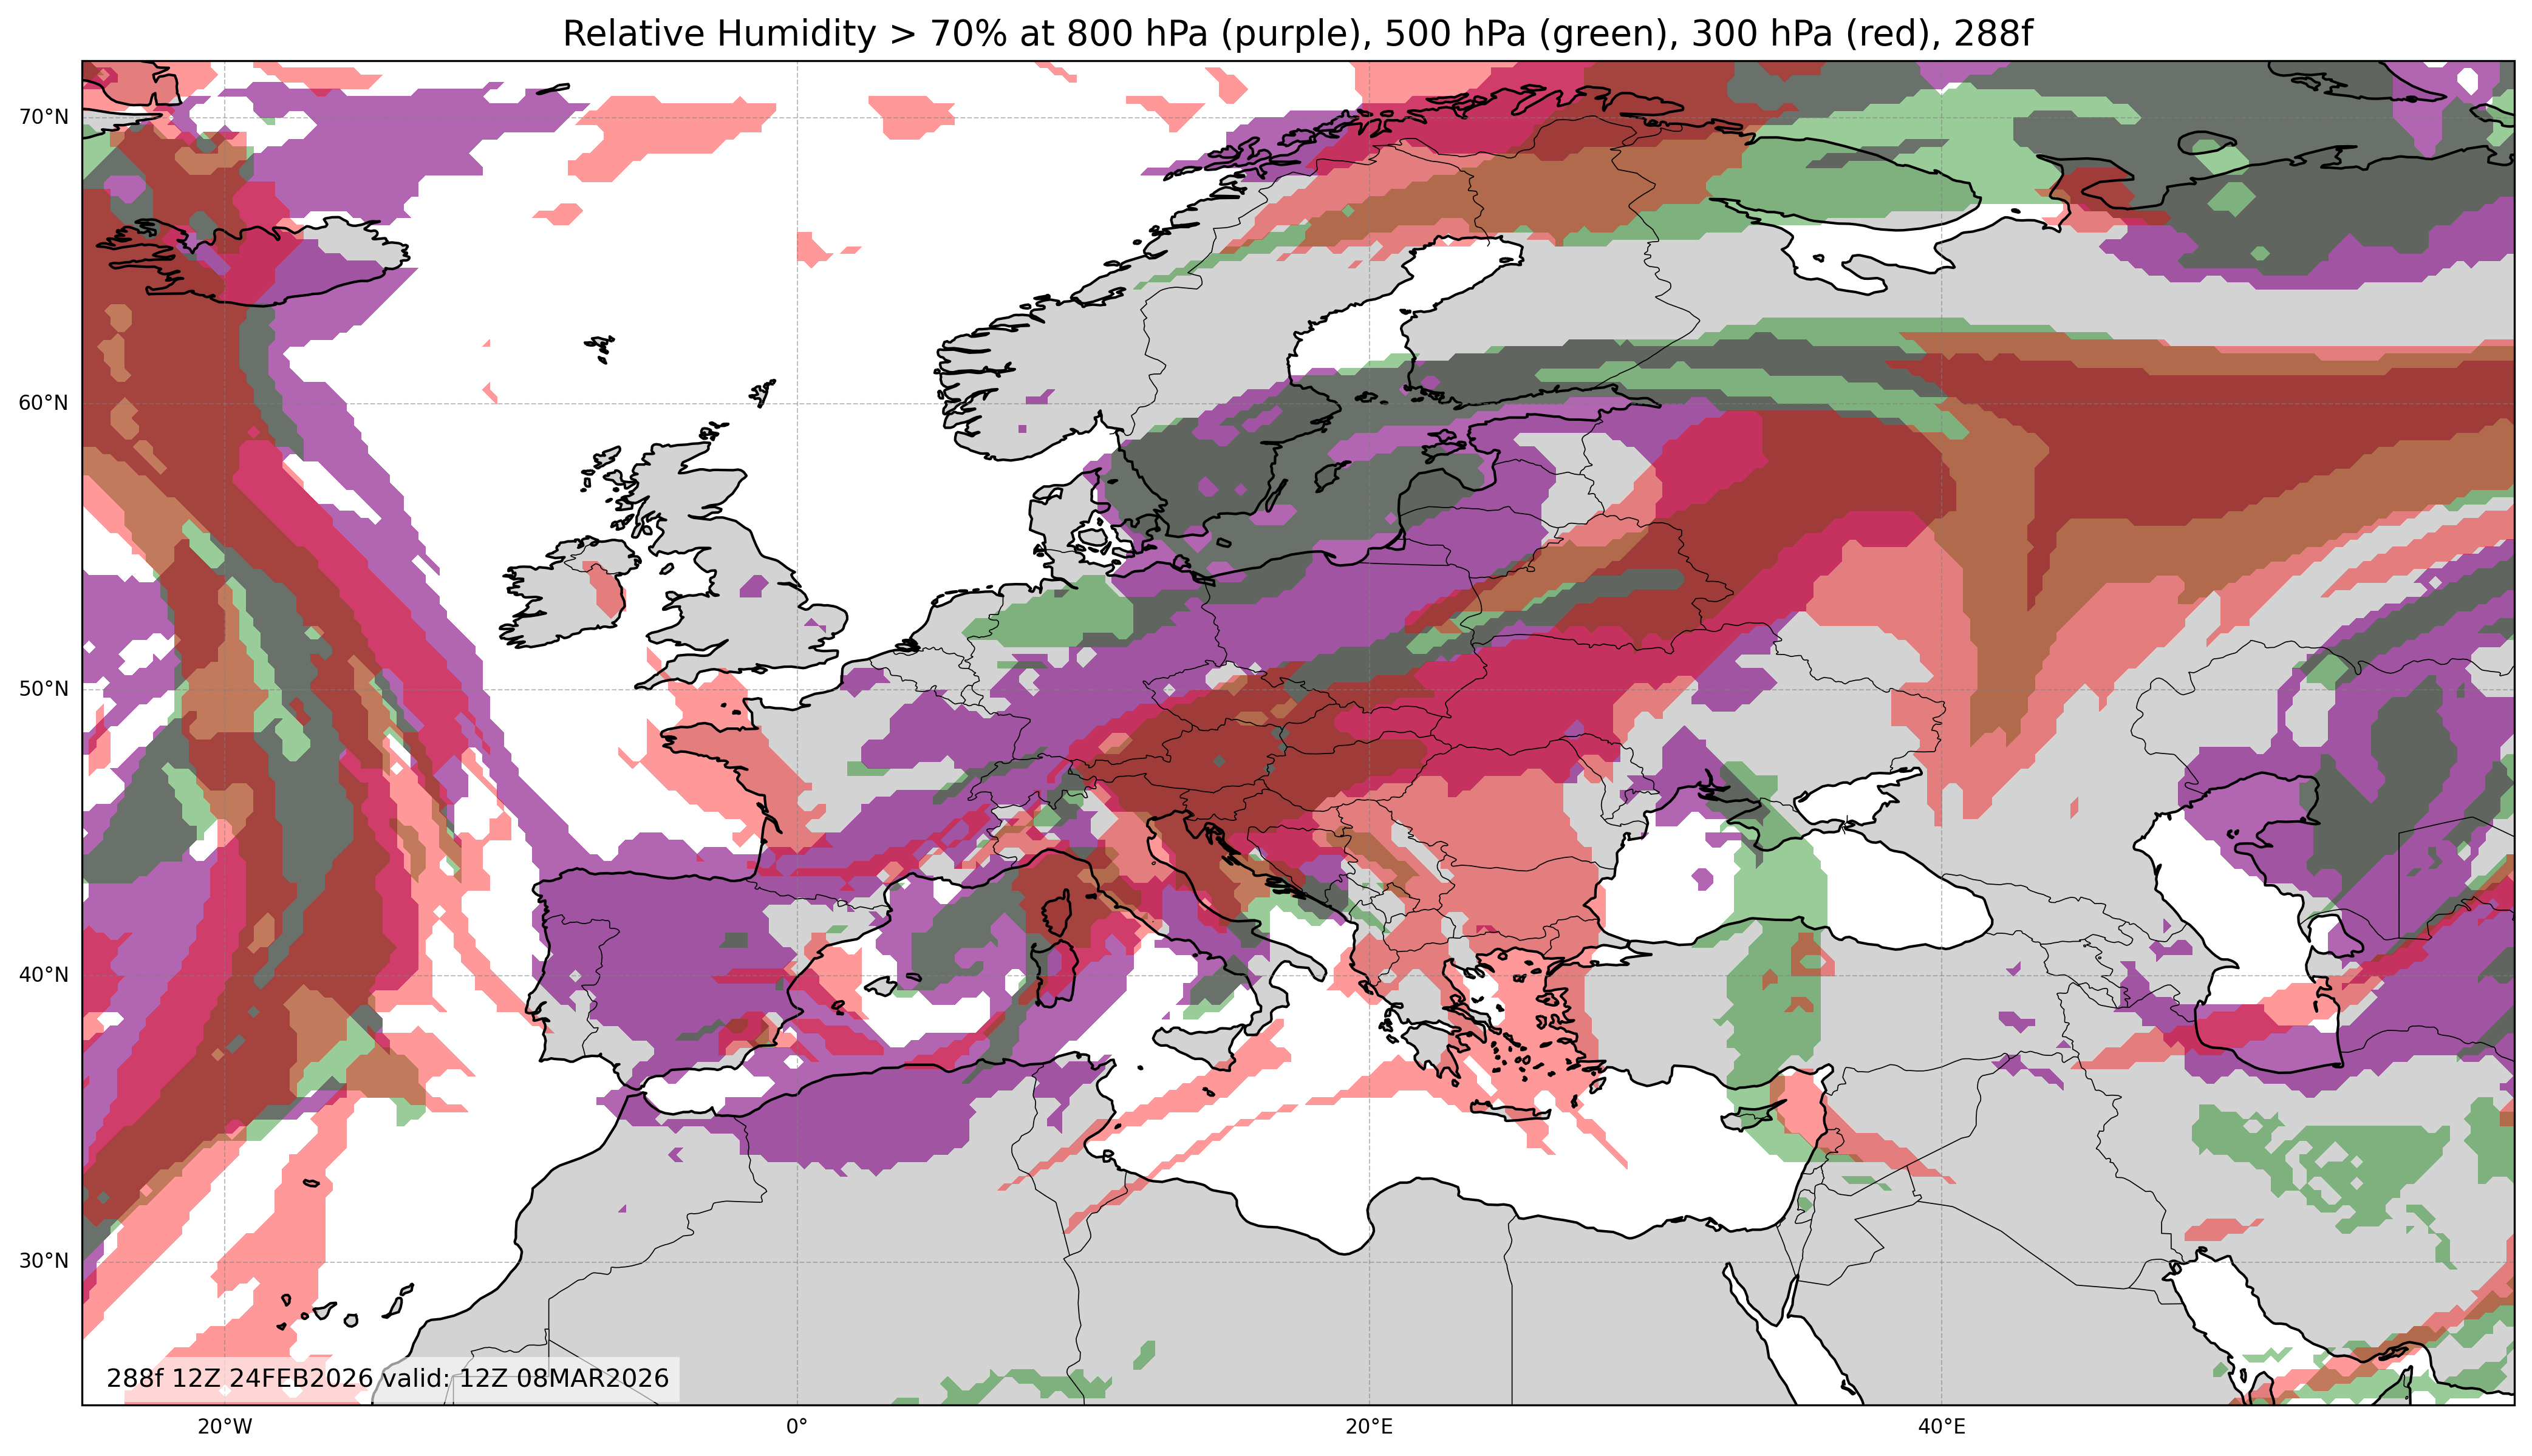
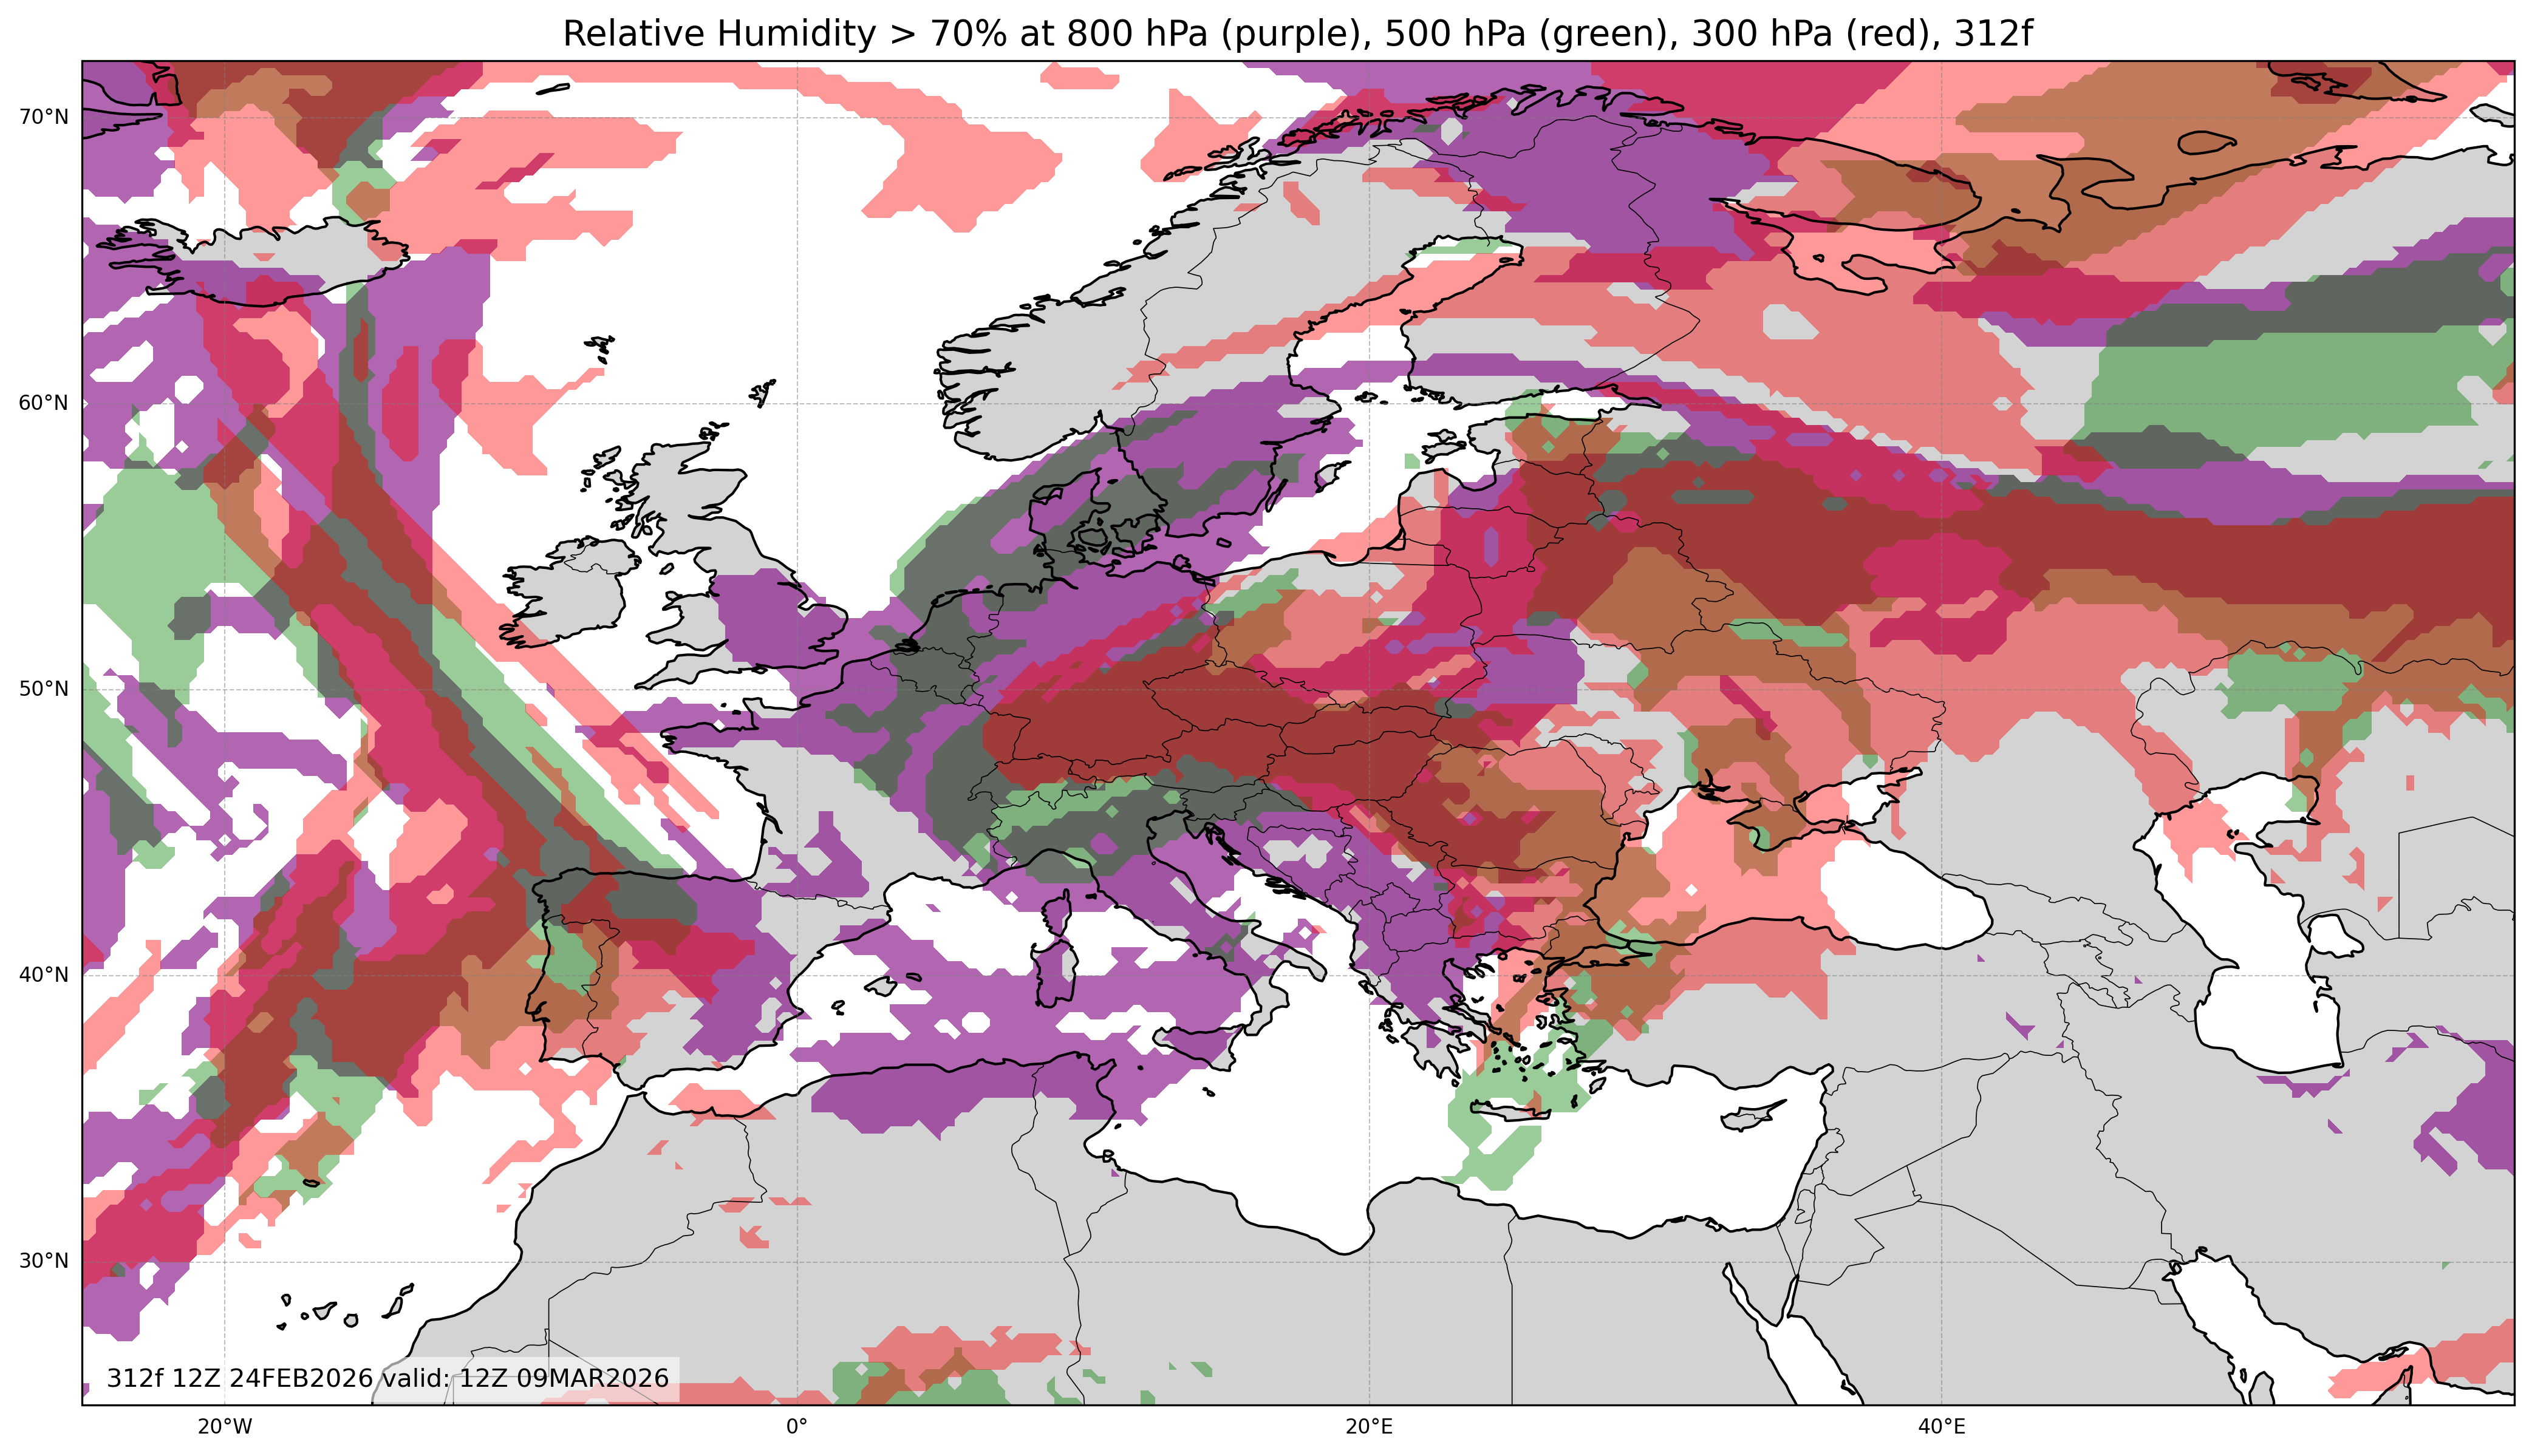
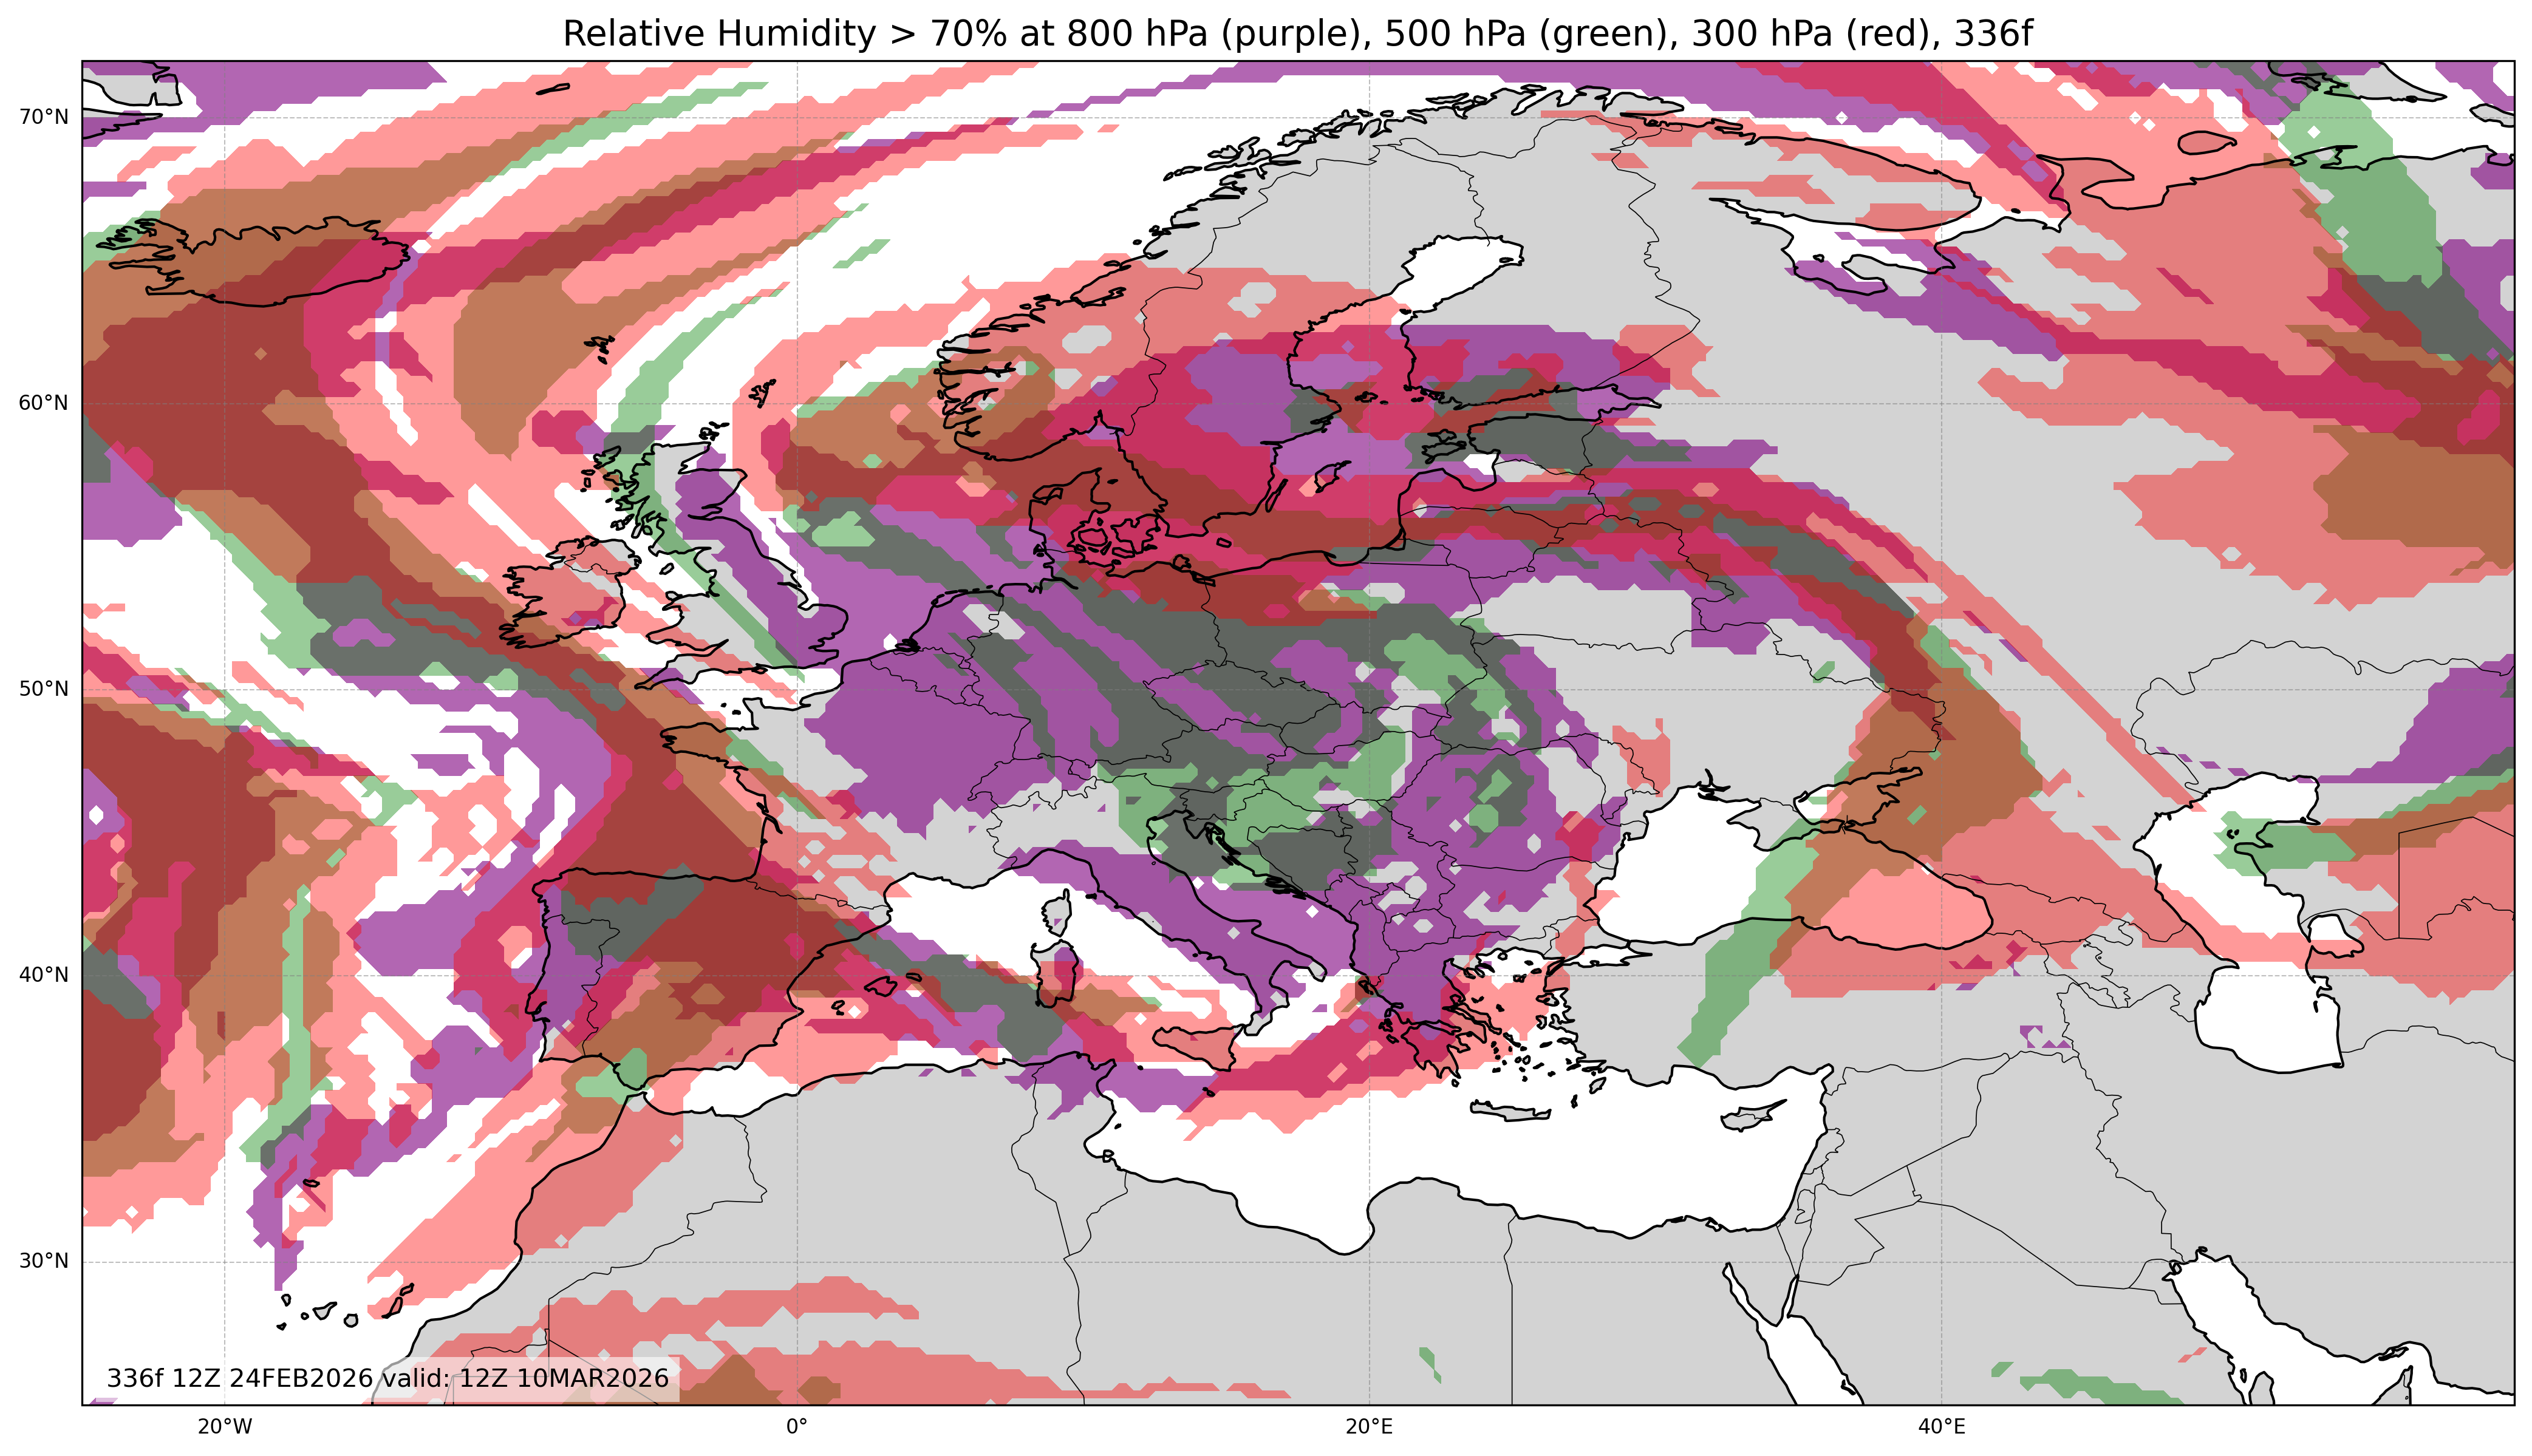
Relative Humidity at 800, 500, & 300mb
These maps display relative humidity at different atmospheric levels — low (800mb), mid (500mb), and high (300mb). This multi-level view helps forecasters distinguish between cloud layers, moisture depth, and vertical structure of weather systems. By analyzing trends from 24h to 72h forecasts, users can anticipate changes in cloud coverage and precipitation zones.
Low, Middle, & High Cloud Cover
The Low, Middle, & High Cloud Cover maps provide a comprehensive view of European cloud distribution. Observing cloud evolution through 24h, 48h, and 72h forecasts gives insight into storm progression, clear-sky regions, and radiative balance changes affecting temperature forecasts.
Why WXMAPS Europe Matters
WXMAPS Europe stands out as a powerful visualization tool combining atmospheric science and modern forecasting technology. Its detailed model graphics allow users to interpret geopotential height, temperature, humidity, and wind fields with precision. Whether you’re a meteorology student, forecaster, or weather hobbyist, WXMAPS Europe offers real-time insight into Europe’s evolving atmospheric dynamics. wxmaps middle east.
Conclusion: Wxmaps Europe – wxmaps middle east
With detailed maps for 500mb Geopotential Height & Vorticity, Sea Level Pressure & 1000-500mb Thickness, 850mb Temperature, 200mb Streamlines, and more, WXMAPS Europe is an invaluable resource for understanding Europe’s atmosphere. Its 24h, 48h, and 72h forecasts provide accessible yet scientifically robust visualizations for anyone analyzing short-term weather developments across the continent.